Article

Prediction of Torque Capacity in Circular Concrete-Filled Double-Skin Tubular Members under Pure Torsion via Machine Learning and Shapley Additive Explanations Interpretation

by
Lenganji Simwanda
* and
Bolanle Deborah Ikotun
Department of Civil & Enviromental Engineering and Building Sciences, University of South Africa, Johannesburg 2001, South Africa
*
Author to whom correspondence should be addressed.
Buildings 2024, 14(4), 1040; https://doi.org/10.3390/buildings14041040
Submission received: 27 February 2024 / Revised: 20 March 2024 / Accepted: 4 April 2024 / Published: 8 April 2024

Abstract

:
The prediction of torque capacity in circular Concrete-Filled Double-Skin Tubular (CFDST) members under pure torsion is considered vital for structural design and analysis. In this study, torque capacity is predicted using machine learning (ML) algorithms, such as Categorical Boosting (CatBoost), Extreme Gradient Boosting (XGBoost), Gradient Boosting Machine (GBM), Random Forest (RF), and Decision Tree (DT), which are employed. The interpretation of the results is conducted using Shapley Additive Explanations (SHAPs). The performance of these ML models is evaluated against two traditional analytical formulas that have been proposed and are available in the literature. Through comprehensive analysis, it is shown that superior predictive capabilities are possessed by the CatBoost and XGBoost models, characterized by high R 2 values and minimal mean errors. Additionally, insights into the influence of input features are provided by SHAP interpretation, with an emphasis on key parameters such as concrete compressive strength and steel tube dimensions. The gap between empirical models and ML techniques is bridged by this study, offering engineers a more accurate and efficient tool for CFDST structural design. Significant implications for optimizing CFDST column designs and advancing structural engineering practices are presented by these findings. Directions for future research include the further refinement of ML models and the integration of probabilistic analyses for enhanced structural resilience. Overall, the transformative potential of ML and SHAP interpretation in advancing the field of structural engineering is showcased by this study.

1. Introduction

Prominence in the construction industry has been gained by Concrete-Filled Double-Skin Steel Tube (CFDST) columns due to their inherent advantages, including high load-bearing capacity [1], high strength-to-weight ratio [2], and favorable dynamic characteristics [3] compared to traditional composite columns. An innovative solution for modern load-bearing structures is offered by these columns, contributing to the efficiency and sustainability of engineering projects. However, a complex challenge remains the accurate prediction of the torque capacity of CFDST columns under torsion loading conditions [4], and provisions for this are still lacked by modern structural design standards.
In a bid to understand this complex behavior, a few experimental (e.g., [5,6,7]) and numerical studies (e.g., [8,9]) have been conducted by researchers. Experiments on the torque behavior of tapered CFDST columns with large hollow ratios ranging from 0.75 to 0.9 under two loading modes: pure torsion and combined compression-torsion, were conducted by Deng et al. [5]. Through test investigation and numerical analysis, the torque behavior of CFDST columns under combined compression and cyclic torsion was studied by Zhang et al. [
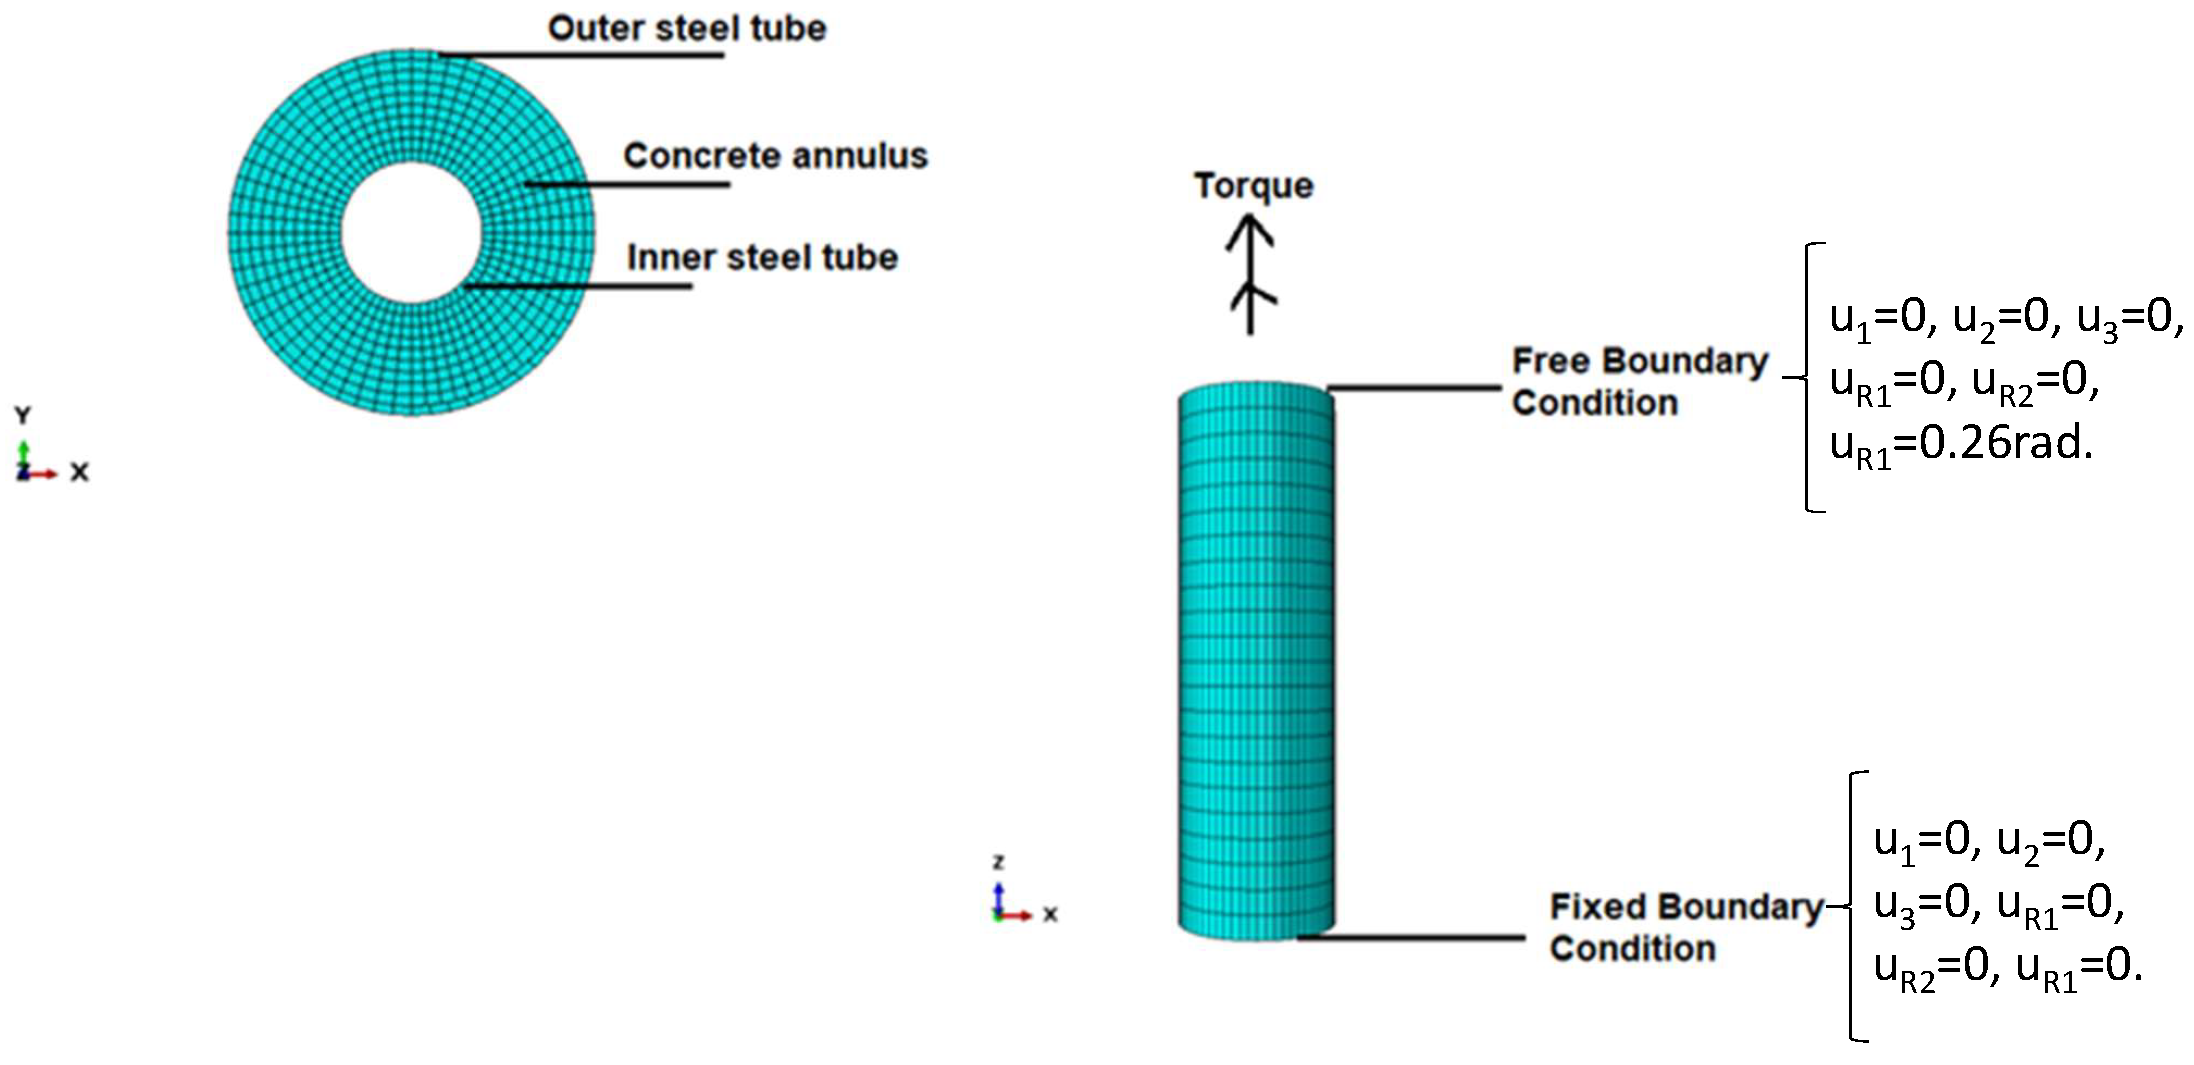
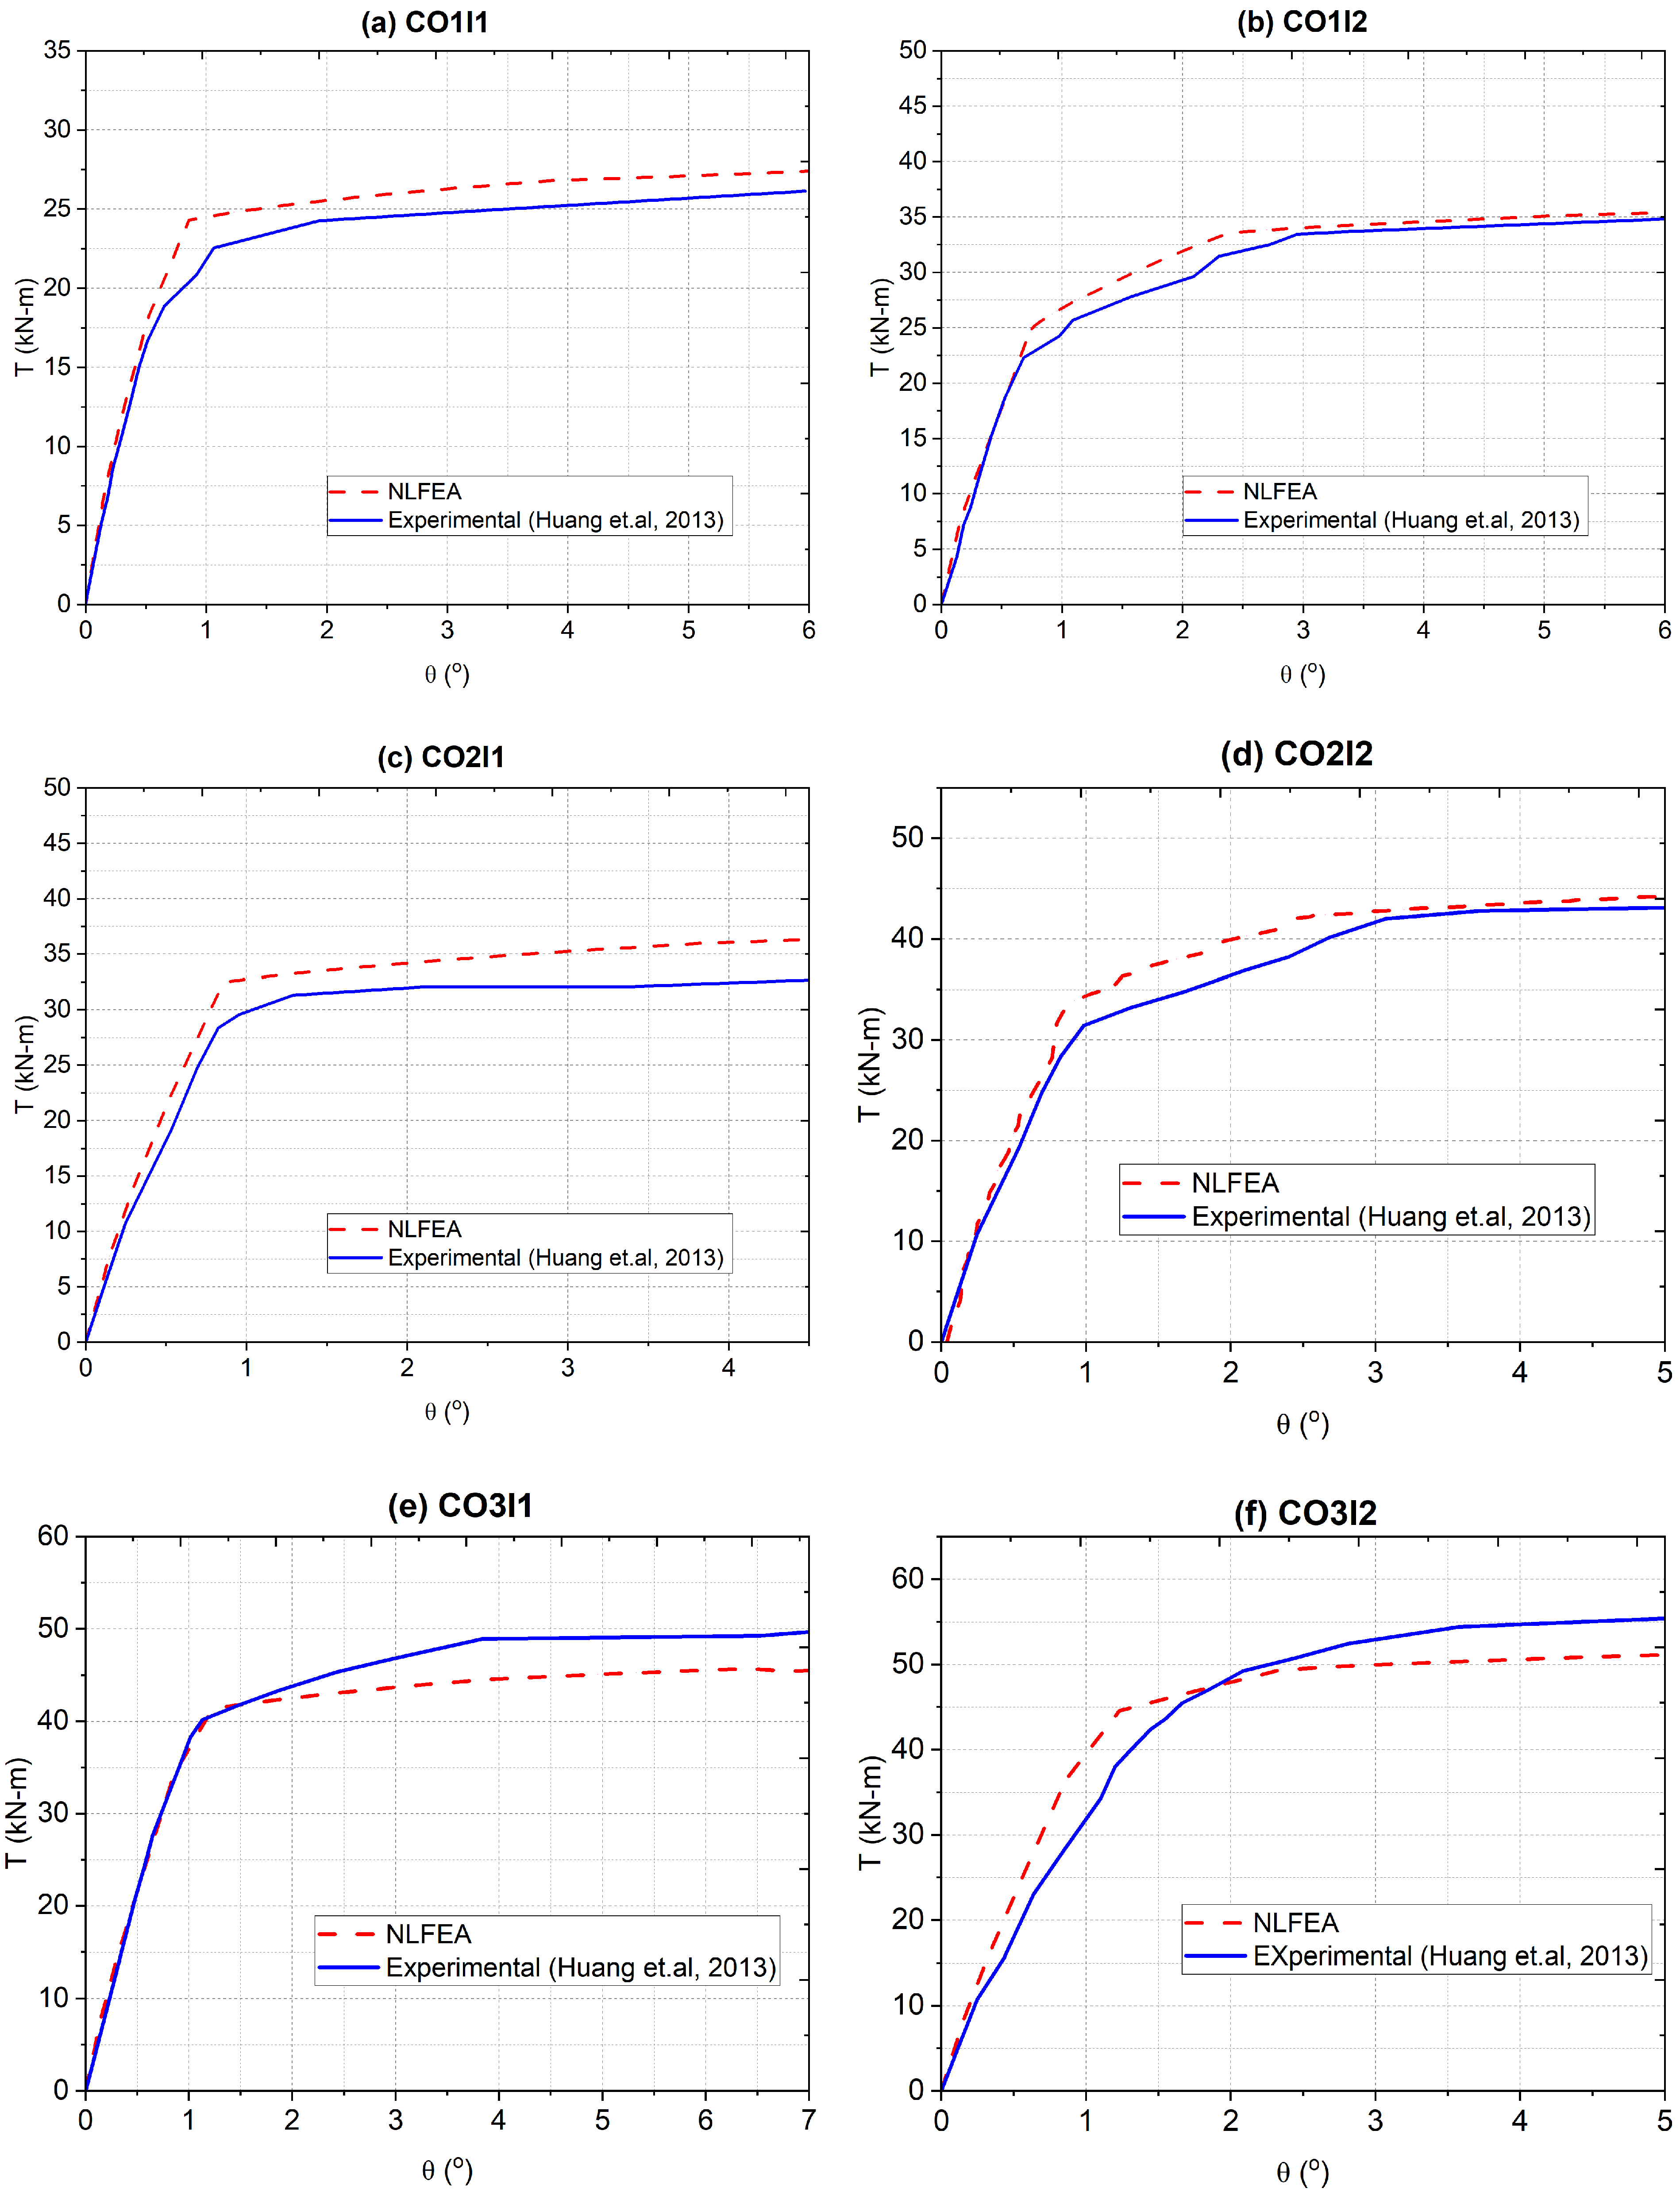
6], who proposed axial compression–torque correlation equations and formulas for predicting the torque capacity of CFDST columns under combined compression and torsion via regression analysis. The behavior of CFDST members under pure torsion was investigated by Huang et al. [7], who employed nonlinear finite element analysis (NLFEA) to examine failure modes, torque–rotation curves, and the interaction between steel tubes and concrete in CFDSTs. Reasonably well with experimental data were aligned the results from NLFEA by their study, which identified six key parameters influencing torque versus torsional rotation curves in CFDST members.
Numerical investigations to understand the torsional behavior of CFDST columns have also been carried out. An NLFEA study on the torsional behavior of circular CFDST columns was conducted by Lu et al. [4], who established a refined NLFEA model, validated using experimental results. Through parametric analyses, the influence of significant parameters, such as concrete strength, steel tube properties, and aspect ratio, on the torsional capacity of circular CFDST columns, was explored by their research, resulting in the proposal of accurate design formulas for predicting torsional capacity, with demonstrated accuracy in comparison to tests. In a related study, the numerical analysis of torsional behavior was focused on by Lu et al. [8], but their attention was shifted to rectangular and square CFDST members. They successfully developed NLFEA models, validating them against experimental data. Parametric investigations to assess the effects of factors such as hollow ratio, concrete strength, steel yield strength, and steel tube cross-sectional properties on the torsional response of these members were conducted. The outcome was the formulation of precise design formulas for predicting the torsional capacity of rectangular and square CFDST members.
Turning their attention to an emerging area, the behavior and bearing capacity of tapered CFDST members that fall outside the realm of traditional design codes were explored by Wang et al. [9]. They used numerical and theoretical research methods, including NLFEA, to understand how these tapered CFDST members respond to torsional and compression–torsion loads. Their study introduced a modified design method, especially suitable for predicting the performance of tapered CFDST members with out-of-code parameters.
While the aforementioned studies have significantly advanced our understanding of CFDST columns’ behavior under torsion and provided foundational insights for design and analysis, several limitations persist within the current body of research. Firstly, many of the experimental [5,6,7]) and numerical studies [8,9] focused on specific column configurations or loading conditions, limiting the generalizability of their findings. Furthermore, the complex interactions between the concrete core, inner, and outer steel tubes under torsion are not fully explored, especially for columns with non-standard geometries or material properties. Additionally, the current methods for predicting torque capacity primarily rely on the empirical formulas derived from limited datasets, which may not accurately capture the behavior of CFDST columns under diverse conditions. Moreover, the lack of comprehensive design provisions for torsion in CFDST columns in existing structural design standards underscores the need for a more versatile and robust prediction tool.
Often relying on analytical methods (e.g., [4,7]), which may not adequately capture the complex behavior of these columns under pure torsion, are conventional approaches for estimating torsional capacity. To the best of the authors’ knowledge, the torsion provisions for CFDST columns are not addressed by any current structural design standard. To address these limitations, this paper introduces a novel data-driven analysis using machine learning (ML) techniques for predicting the torque capacity of circular CFDST columns.
Significant attention in various engineering disciplines due to their capacity to comprehensively analyze large datasets [10], identifying complex patterns and relationships that may not be evident through conventional methods [11], has been gained by ML in recent years. Several recent studies have explored the application of ML techniques in predicting the strength of concrete-filled steel tubular (CFST) columns under various loading conditions. A framework utilizing the gradient tree boosting (GTB) algorithm to forecast the strength of CFST columns subjected to concentric loading was introduced by Vu et al. [10]. An artificial neural network (ANN) model tailored to estimate the ultimate compressive strength of square CFST columns, demonstrating enhanced performance compared to traditional design codes, was proposed by Le [12]. The integration of mechanism analysis with machine learning models, particularly Gaussian process regression (GPR), to predict the axial compression strength of circular CFST columns, was investigated by Hou and Zhou [13]. Their findings suggested superior accuracy and broader applicability compared to existing design standards. Similarly, a machine learning model capable of estimating the axial capacity of both circular and rectangular CFST columns under various loading conditions, offering a high level of accuracy and serving as a viable alternative to empirical and theoretical formulations, was developed by Faridmehr and Nehdi [11].
The exploration of ML techniques in structural engineering, particularly for predicting the behavior of CFST columns, has showcased the potential for highly accurate predictions that often exceed conventional design standards. Despite these advancements, the ML literature reveals gaps such as a limited focus on the torsional behavior of CFDST columns and challenges in model interpretability and data availability. Our study aims to bridge these gaps by specifically targeting the prediction of torque capacity in CFDST columns under torsion, leveraging a comprehensive database derived from NLFEA simulations for model training and validation. In doing so, we not only enhance the predictive accuracy and applicability of ML models but also contribute to the structural engineering domain by providing interpretable models that elucidate the complex interplay of factors influencing torsional capacity. This approach marks a significant step forward in the application of data-driven methodologies to the nuanced field of structural engineering, addressing both the technical and practical challenges highlighted in previous research.
This study aims to develop reliable and accurate predictive ML models for estimating the torque capacity of circular CFDST columns under pure torsion. By leveraging ML algorithms, the intricate behavior of these columns, considering multiple influencing factors, and providing comprehensive prediction tools for structural engineers, are sought to be captured. A new database, integrating data from multiple NLFEA instances to ensure the adequacy and diversity of the training set, is compiled. The integration of ML in the analysis of CFDST columns represents a significant advancement in structural engineering. This data-driven approach offers the potential to overcome the limitations of conventional methods and provide more accurate and reliable estimates of torque capacity. The outcomes of this study are expected to enhance the design and performance of CFDST columns in various engineering applications, ultimately contributing to safer and more efficient structures.

2. Finite Element Modeling

In this section, the details of Finite Element Modeling for the analysis of circular CFDST columns is presented, with a focus particularly on their response to pure torsional loading. It begins with an overview of the experimental studies adopted for validation and the NLFEA modeling strategies that are employed.

2.1. Experimental Studies

Consideration is given to six (6) CFDST members with circular hollow sections (CHSs) on the inner and outer tubes. These specimens, taken from an experimental protocol conducted by Huang et al. [7], are included for the purpose of validating the NLFEA model that will be developed in the subsequent section. For detailed descriptions of the fabrication and experimental setup of these columns, reference to their work [7] is made. Here, salient details of their geometric and material properties, as shown in Table 1, are provided.

2.2. Nonlinear Finite Element Analysis

2.2.1. NLFEA Model Description

To assess the torque capacity of circular CFDST members under pure torsion, a “solid” NLFEA model of CFDST columns was established using the ABAQUS program [14]. In this NLFEA model, eight-node brick elements with reduced integration (C3D8R) were used for discretizing the outer and inner steel tubes, and the concrete annulus. The concrete damage plasticity (CDP) model, which can effectively account for the compression and tension stiffening actions expected in members undergoing torque-induced shear stresses, was utilized for simulating the damage plasticity behavior of the confined concrete. The CDP model was defined with parameters such as the dilation angle = 31°, Eccentricity = 0.1, f b 0 / f c 0 = 1.16, K = 0.67, and viscosity parameter = 0.003 [15]. This approach has been employed to model the plastic behavior of the confined concrete in CFDST members subject to torsional loads by several authors (e.g., [4,5,7,16]).
The study examined mesh sensitivity analysis with mesh sizes of 15 mm, 20 mm, 25 mm, and 30 mm to explore variations in the NLFEA’s performance across different mesh sizes. Findings indicated that the mesh size influences the prediction of the torque capacity, with the 20 mm and 15 mm mesh sizes yielding results that were closest to experimental data, implying that the convergence of the algorithms stabilize for a mesh size of 20 mm or less. Therefore, a mesh size of 20 mm was adopted in the NLFEA models. The grid meshing of the CFDST components and boundary conditions adopted in the NLFEA model is illustrated in Figure 1. For simulating the interactions at the interface between the steel tubes and the confined concrete, a solid contact and penalty friction formulation were employed for normal and tangential behavior, respectively. It is noted that the friction coefficient for this NLFEA model was set at 0.6 [17]. The load was applied via an angular displacement of 0.25 radians around the z axis, which induces rotational forces on the model and the static general analysis approach was employed given the requirements of slowly varying the loading conditions and good computational efficiency.
The adoption of the quadratic plastic flow model proposed by Esmaeily and Xiao [18], expected to capture the plastic hardening behavior of steel tubes under torsional load, is reflected in the NLFEA steel tubes as expressed in Equation (1),
σ = E s ε if ε ε y f y if ε y ε k 1 ε y k 3 f y + E s ( 1 k 3 ) ε y ( k 2 k 1 ) 2 ( ε k 2 ε y ) 2 if k 1 ε y ε k 2 ε y f u if ε k 2 ε y
where k 1 = 5 , k 2 = 46 , and k 3 = 1.44 —as experimentally shown by Shi et al. [19]. Here, E s represents the Young’s modulus of the steel, ε represents the strain corresponding to the applied stress σ , ε y represents the strain at yield stress f y , and f u represents the ultimate strength of steel.
Given the enhanced confinement offered by the steel tubes, which augments both the strength and ductility of the concrete within CFDST columns and consequently their torsional capacity, a typical stress–strain response by Mander et al. [20] is employed within our NLFEA model, as illustrated in Figure 2. The Mander [20] model’s stress-strain curve for concrete features three regions: OA, where stress and strain are linearly related and the behavior is elastic; AB, marking the transition from elastic to plastic behavior with diminishing stress growth and onset of permanent deformation; and BC, a strain softening region where stress decreases with increasing strain, leading to eventual material failure at the ultimate strain point C. This methodology has been utilized by numerous researchers (e.g., [21,22,23]) to replicate the nonlinear behavior of confined concrete in circular CFDST columns. The computation of the values of the compressive stress–strain curve in Figure 2 is based on Equations and references presented in Table 2.
The behavior of the confined concrete in tension was determined using the tensile strength f t , which was estimated as per the methodology described in the work by Pagoulatou et al. [22].
f t = 0.6 f c γ c .
The cracking strength f t occurs at a corresponding cracking strain, denoted by ε c c (see Table 2).

2.2.2. NLFEA Model Validation

A comprehensive validation process was undertaken to ensure the reliability and accuracy of the NLFEA model in simulating the torque capacity of CFDST members. This involved a meticulous comparison of the torque (T) versus rotation ( θ ) predictions made by the model against the experimentally derived data, with a primary focus on the findings reported by Huang et al. [7]. The aim of this comparison was to assess the model’s capability in accurately replicating the key aspects of torsional response, such as peak torque capacity and the behavior of the T - θ curves as shown in Figure 3. The torque capacity ( T u , e x p t ) is defined as the torque applied when the shearing strain reaches a value of 0.01 , as the T - θ curves do not exhibit a descending branch, in accordance with [29].
Model validation is crucial in computational engineering, ensuring that our NLFEA model’s predictions align with real-world observations. This process not only confirms the model’s accuracy for predicting CFDST columns’ behavior under torsion but also identifies areas for refinement, such as assumptions or modeling techniques that need adjustments. The outcomes of model validation guide the iterative enhancement of our models, pinpointing strengths and areas for improvement. This facilitates the more precise modeling of CFDST columns, supports the development of innovative design practices, and helps optimize their performance under torsional loads. In essence, thorough model validation boosts the trustworthiness of computational models as predictive tools, laying the groundwork for their use in developing safer and more efficient structural designs.
Encouraging results were yielded from this comparative analysis (Figure 3), indicating a significant alignment between the predictions made by the NLFEA model and the experimental findings. It was noted that the initial stiffness and peak torque capacities were accurately predicted by the model, with deviations from the experimental measurements contained within a 5% margin for the majority of the cases analyzed. This level of accuracy in predicting peak torque values highlighted the effectiveness of the model in capturing the essential aspects of structural torsional response.
However, slight discrepancies in the post-peak response predictions were observed, where a slightly more conservative estimate than the experimental data was demonstrated by the NLFEA model. These discrepancies are attributed to the simplifications inherent in the material modeling processes within the NLFEA framework. Despite these minor differences, the overall predictive performance of the model, supported by a Pearson correlation coefficient of 0.95 with the experimental data, underscored its robustness and reliability in simulating the torsional behavior of structural elements.
This validation process not only attests to the model’s accuracy but also enhances the confidence in its application for structural design and analysis. The model’s slight overestimation in torque capacity predictions, reflected by a mean model error (defined as T u , e x p t / T u , N L F E A [30,31]) value of 1.05 and a coefficient of variation of 0.08 , positions the model on the conservative side of predictions (see Table 1). Such conservatism is seen as preferable in structural engineering practices, ensuring the safety and reliability of design recommendations.
Upon the foundation of this validation, significant contributions to a database aimed at enriching machine learning algorithms are poised to be made by the model. This future application will leverage the validated model’s capabilities to predict structural behaviors more efficiently, facilitating the design of safer and more resilient structural systems.

3. Database Presentation

3.1. Database Development

To address the lack of a global database and limited experimental data on the torque capacity of CFDST members subjected to pure torsion, a pioneering approach is taken in this study by creating a novel database. This comprehensive database, which includes 800 instances generated through NLFEA models and an additional six (6) instances derived from experimental work conducted by Huang et al. [7], encompasses a substantial total of 806 instances. This provides a valuable resource for researchers and practitioners in the field of structural engineering. To generate the 800 NLFEA models, a parametric analysis was employed varying parameters such as t o , t i , f y i , f y o , and f c u over the ranges shown in Table 3.
A critical dimension of our database development was the intentional inclusion of extreme conditions that are not typically addressed by current code specifications. This inclusion is particularly significant as it aims to push the boundaries of the models’ predictive capabilities, ensuring that the developed machine learning algorithms can accurately predict the behavior of CFDST members under a wider range of conditions than those commonly encountered. By incorporating instances that feature high-strength steel and ultra-high-performance concrete, our dataset goes beyond the conventional ranges dictated by existing industry standards. This strategic choice significantly contributes to the robustness and generalizability of the predictive models developed in this study, making them more adaptable to future advances in material science and changes in design standards.
The inclusion of such extreme conditions facilitates a deeper understanding of the potential impacts on the torque performance of CFDST members, thereby enhancing the predictive accuracy and applicability of our models to real-world scenarios that may arise as materials and design practices evolve.

3.2. Summary Statistics

A comprehensive summary of the statistical properties of data gathered from both experimental tests conducted by Huang et al. [7] and additional data generated from NLFEA models is meticulously detailed in Table 4. This summary encapsulates input features encompassing geometric parameters such as the outer and inner diameters ( D o , D i ) alongside their respective thicknesses ( t o , t i ), and material properties including the yield strengths of the outer and inner layers ( f y o , f y i ), and the ultimate strength ( f c u ). These parameters exhibit a broad spectrum of variability, highlighted by their extensive ranges and coefficients of variation, indicative of the diverse configurations explored. Conversely, the output feature, represented by the torque capacity ( T N L F E A ), serves as a measure of the performance of circular CFDST columns under pure torsion. The torque capacity values demonstrate significant diversity, underscored by a considerable standard deviation in relation to the mean, pointing to the varied performance outcomes across different column configurations. Grasping the statistical distribution of both input and output features is pivotal for the development and validation of machine learning models aimed at precisely predicting the torque capacity of circular CFDST columns.
Table 4 provides a structured representation of the statistical distribution of the collected data, featuring the minimum (Min.), 25th percentile ( Q 25 ), median (50th percentile, Q 50 ), 75th percentile ( Q 75 ), and maximum (Max.) values, alongside the mean, standard deviation (Std), and coefficient of variation (CoV) for each parameter. The Min. value marks the smallest observation in the dataset, whereas the Q 25 , Q 50 (median), and Q 75 values represent the thresholds below which 25%, 50%, and 75% of the observations in the dataset fall, respectively. These percentile values are critical for understanding the data’s spread and central tendency, providing insights into the distribution’s shape and skewness. The Max. value indicates the largest observation. Together, these statistics offer a comprehensive snapshot of the data’s variability and distribution, aiding in the accurate characterization and modeling of the parameters influencing the torque capacity of circular CFDST columns. The graphical representation in terms of the distribution of values for T N L F E A values is further elucidated in Figure 4, where the histogram and probability density function (PDF) plots serve to visually articulate the dispersion and skewness of the T N L F E A values. The PDF plot, in particular, affords a continuous probability curve that underscores the likelihood of different torque capacities occurring within the dataset. The pronounced skew towards the lower end of the torque spectrum suggests a preponderance of lower-capacity values, with fewer instances of high-capacity outcomes.

3.3. Regression and Correlation Analysis of Dataset

Utilizing the Spearman–Pearson correlation coefficient ( ρ ), the relationships between input variables and their impact on the torque capacity, T u , of CFDST columns was explored as shown in Figure 5. The analysis revealed that the cube compressive strength of the concrete, f c u , with ρ = 0.62 , has the most significant positive effect on T u . This finding underscores the pivotal role of concrete quality in the design of CFDST columns for enhanced torque capacity. Other parameters, including the thickness of the outer steel tube, t o , and dimensions of the inner steel tube ( D i and t i ), also influence T u , albeit to a lesser extent.
Notably, the correlation between D i and t i ( ρ = 0.64 ) highlights the importance of considering the slenderness of the inner steel tube in predicting torque capacity. However, this linear correlation analysis does not fully encapsulate the complex, nonlinear interdependencies among variables, prompting a further investigation through advanced machine learning algorithms and SHAP analysis.
Parametric scatterplots illustrated in Figure 6 further detail the impact of input parameters on T u , with the concrete strength f c u showing a pronounced correlation. These insights, particularly the dominant influence of f c u , can inform future research and design practices, suggesting a focus on optimizing the concrete quality for an improved performance of CFDST columns under torsion loading. This approach could lead to more resilient structural designs capable of handling increased torsional demands.
The substantial impact of f c u on T u suggests that enhancing the concrete quality could be a key factor in optimizing the torsional performance of CFDST columns. Future research could explore innovative concrete mixes or reinforcement strategies to leverage this insight, potentially leading to design advancements that further exploit the strength and durability of concrete in composite structural elements.

4. Machine Learning Algorithms

Torque capacity estimators for circular concrete-filled double-skin tubular (CFDST) columns are trained using five tree-based machine learning models, namely Decision Tree (DT), Random Forest (RF), Gradient Boosting Machine (GBM), Categorical Boosting (CatBoost), and Extreme Gradient Boosting (XGBoost). A concise overview of each ML model is provided in this section, and the general architecture of these tree-based algorithms is illustrated in Figure 7.

4.1. Decision Trees

Known for their interpretability and ease of comprehension by humans, DTs are utilized as a classification technique [32]. Their popularity stems from a simple and efficient generalization technique [33]. Constructed based on attribute support degrees, DTs represent logical combinations of sequential tests leading to efficient classification [34]. Their application in predicting the bearing capacity of concrete-filled steel columns is documented [35,36].

4.2. Random Forest

RF, an ensemble method, enhances the predictive performance through the combination of multiple decision trees, using averaging or voting. Studies have shown that RF outperforms decision trees with accuracy [37], proving particularly effective where high accuracy is crucial. RF’s application extends to concrete-filled steel columns, among other areas [38,39,40].

4.3. Gradient Boosting Machine

GBM, another ensemble method, sequentially builds decision trees to correct prior errors, thereby improving the predictive accuracy. Known for its iterative learning process to enhance the model performance, GBM has been applied to understand the behavior of concrete-filled steel columns [39,41].

4.4. Categorical Boosting

CatBoost optimizes the handling of categorical variables within boosting algorithms, aiming for improved model performance. Its application in scenarios where categorical variables significantly influence the outcome leads to more accurate predictions [42]. Recent research has applied CatBoost to predict the bearing capacity of concrete-filled steel columns [43].

4.5. Extreme Gradient Boosting

XGBoost, known for its scalability and efficiency, is a popular choice for its computational efficiency and performance [44]. Its wide adoption in various machine learning competitions and applications stems from its high predictive accuracy. XGBoost’s use in predicting the bearing capacity of concrete-filled steel columns is noted in recent studies [45,46].

5. ML Model Deployment and Validation

5.1. Data Preparation and Cleansing

The raw dataset underwent a comprehensive pre-processing regimen to render it apt for both the training and evaluation of ML models. Initially, the dataset was divided through a two-step stratified random sampling method. Firstly, 80% of the data were earmarked for a combined pool of training and validation purposes, with the remaining 20% allocated for testing. Subsequently, the training-validation pool was further split, allocating 75% for training (effectively 60% of the total dataset) and 25% for validation (constituting 20% of the total dataset). This structured division ensures a balanced distribution of data across training, testing, and validation sets, facilitating the development of robust and generalizable ML models [47].
Feature scaling ensued, employing the StandardScaler from the Scikit-Learn library to normalize the scales of the features, ensuring that no variable disproportionately influences the model’s learning process. The dataset was thoroughly scrutinized for missing values; the absence of such discrepancies negated the need for imputation techniques or the elimination of data points, allowing the dataset to maintain its original volume of 806 entries. A critical step involved segregating the target variable from the predictor features, a practice that is crucial for preserving the dataset’s integrity and optimizing the generalization capability of the ensuing models.

5.2. Details of ML Deployment

5.2.1. Hyperparameters of the ML Models

Grid search and 10-fold cross-validation were employed by the study to fine-tune the hyperparameters for 5 ML algorithms [38,39,40,43]. Hyperparameters, which are crucial for optimal model performance, are predefined by users and require meticulous optimization [45,46]. A systematic exploration of model performance across various hyperparameter combinations is conducted by grid search, while 10-fold cross-validation mitigates overfitting and guards against data-specific biases. Optimal hyperparameters and their ranges were determined based on insights from prior studies on concrete-filled steel columns [38,39,40,43,45,46] and relevant expertise, as summarized in Table 5. Default values were adopted for hyperparameters that were not explicitly listed in the table. Further details on hyperparameters and algorithms can be found in the provided references.

5.2.2. Evaluation Metrics

Four performance metrics were utilized to evaluate the quality and accuracy of the ML models, notably:
  • Coefficient of determination ( R 2 ): R 2 measures the proportion of the variance in the dependent variable explained by independent variables [48]. A higher R 2 value indicates a better fit of the model to the data. An R 2 value of 1 implies a perfect fit, while 0 suggests no explanatory power. Mathematically, R 2 is defined as:
    R 2 = j = 1 N ( y 0 , j y ¯ ) ( y p , j y ¯ ) j = 1 N ( y 0 , j y ¯ ) 2 j = 1 N ( y p , j y ¯ ) 2
  • Mean square error (MSE): MSE quantifies the average deviation between predicted and actual values [48]. It is computed as the average squared differences between predictions and actual values:
    MSE = 1 N i = 1 N ( y 0 y p ) 2
  • Root mean square error (RMSE): RMSE quantifies the average deviation between predicted and actual values [48]. It is computed as the square root of the average squared differences between predictions and actual values:
    RMSE = 1 N i = 1 N ( y 0 y p ) 2
  • Mean absolute error (MAE): MAE measures the average absolute difference between predicted and actual values. It provides a measure of the average magnitude of the errors made by the model [48]:
    MAE = 1 N i = 1 N | y 0 y p |

5.3. Performance Comparison among ML Algorithms

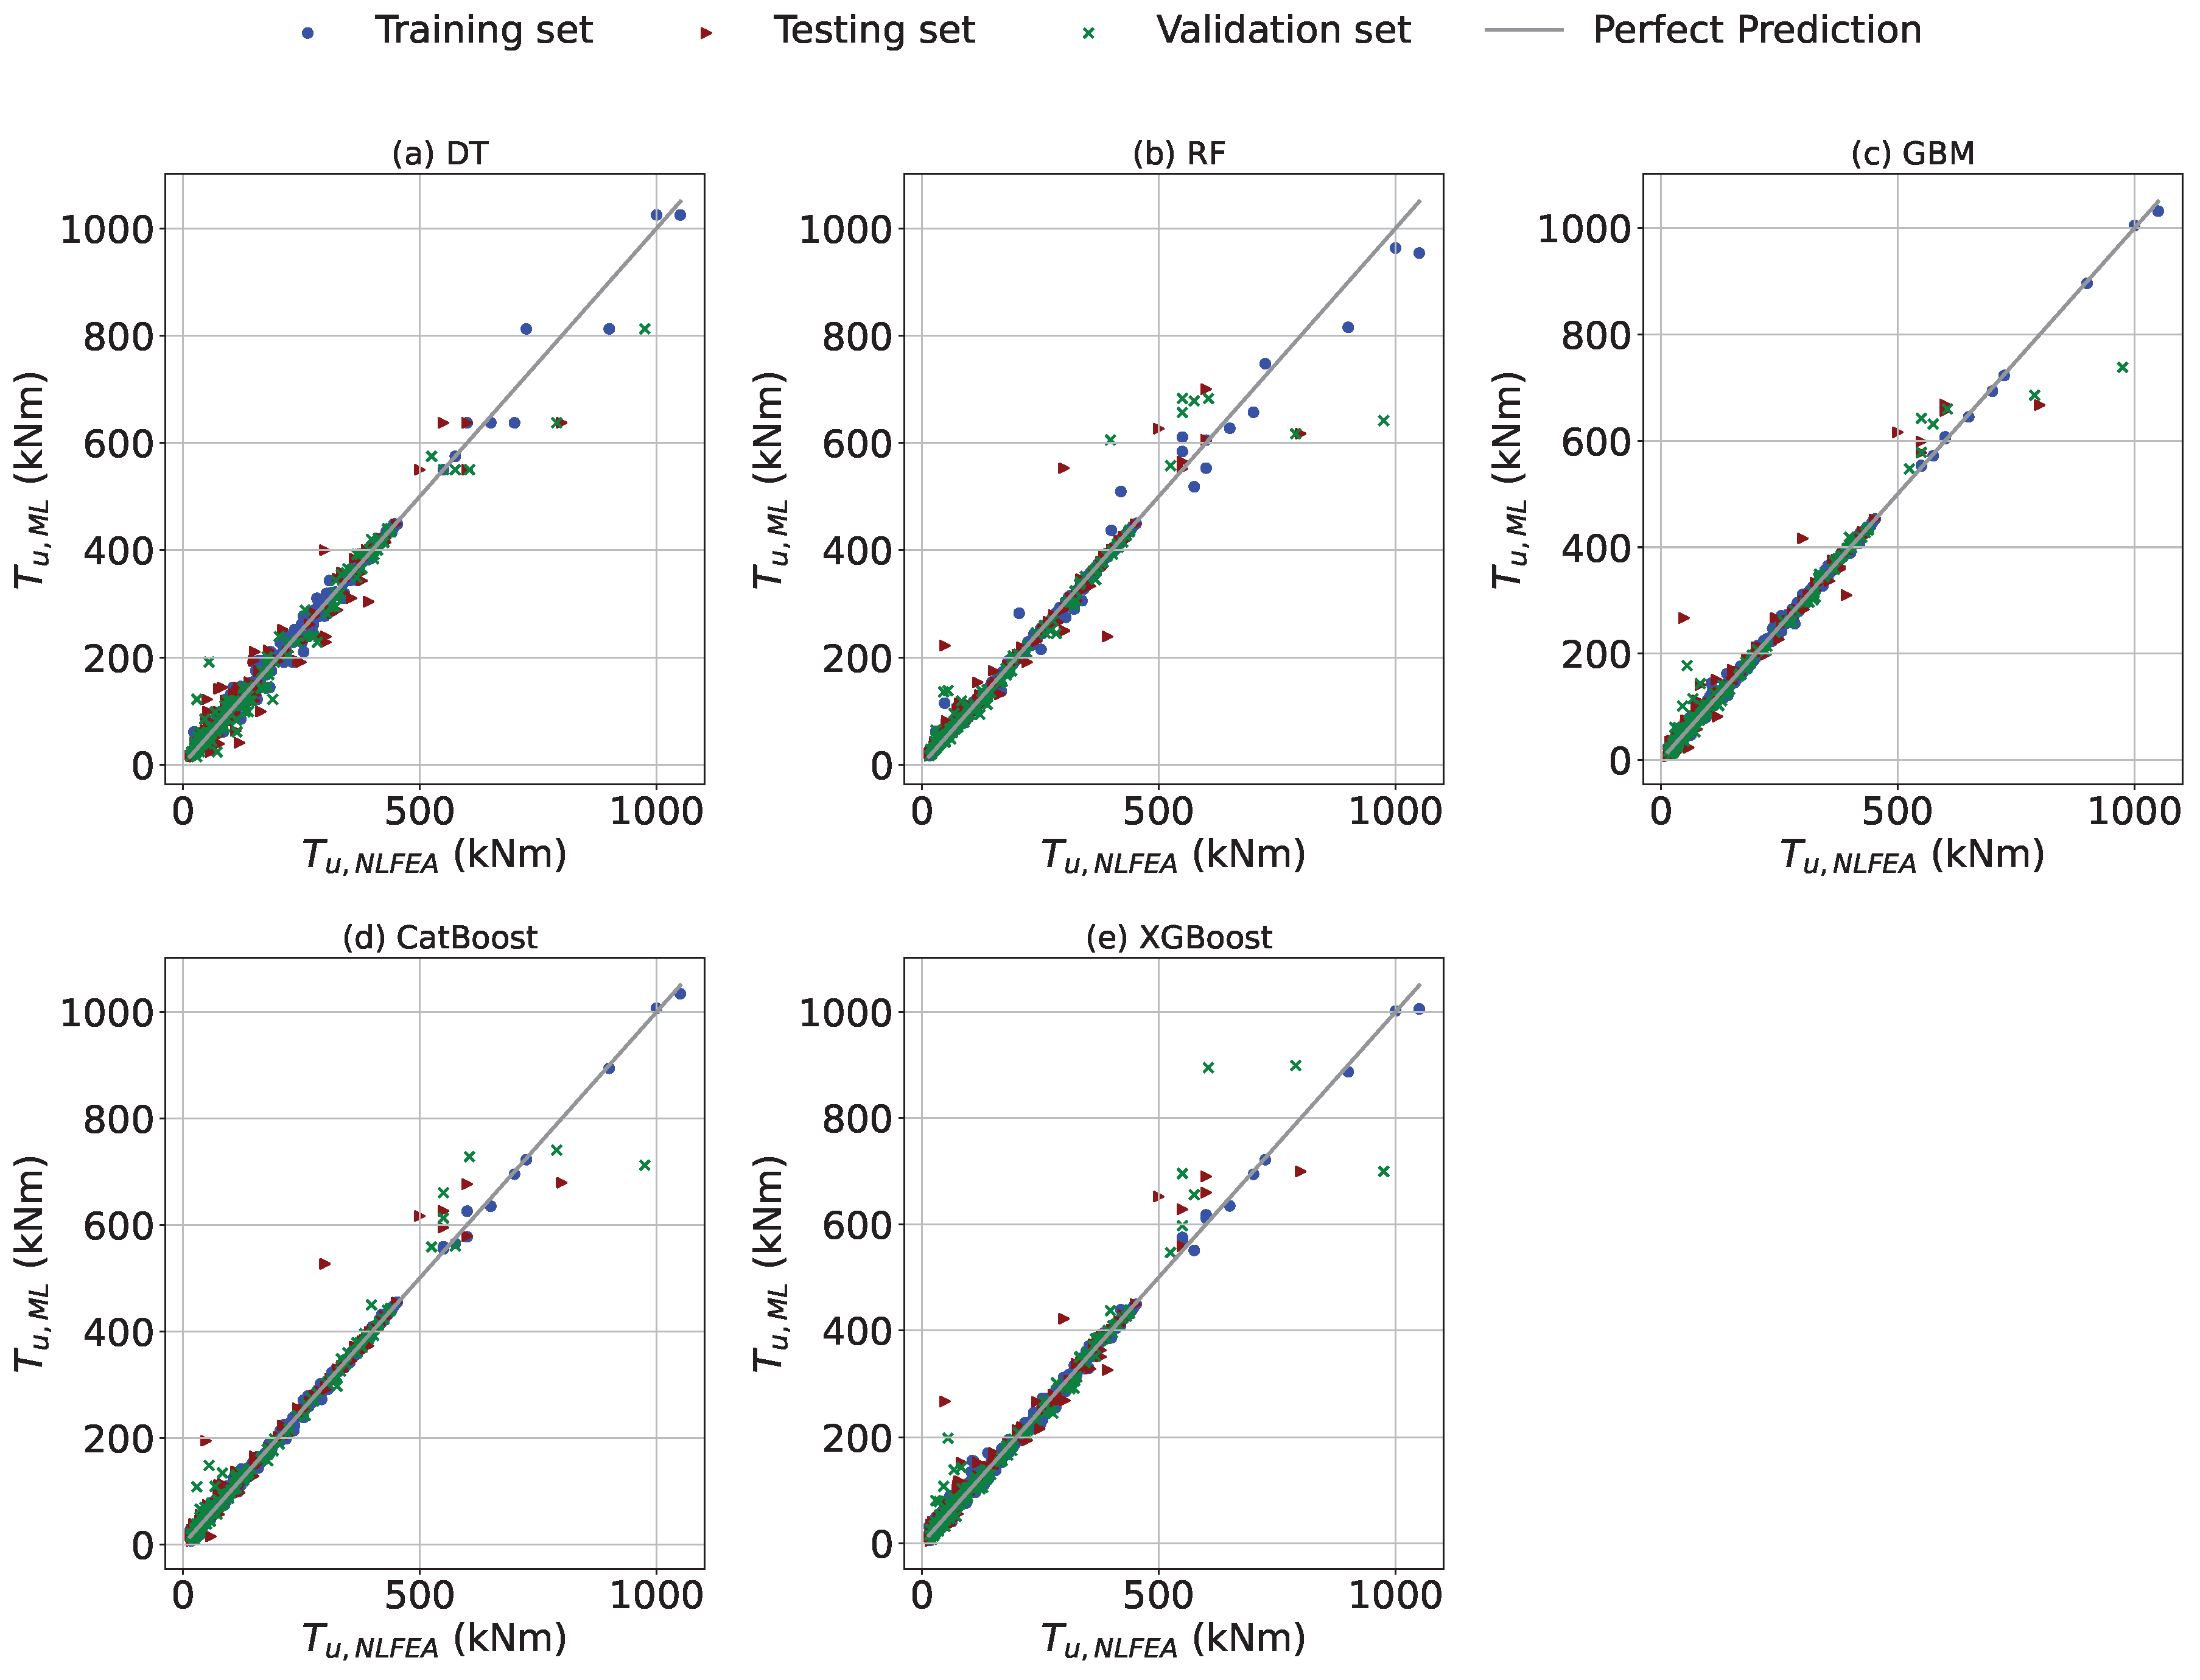
The relationship between the predicted torque capacity by ML ( T u , M L ) and the actual torque capacity ( T u , N L F E A ) for the five ML models across both training and testing datasets is illustrated by the scatterplot depicted in Figure 8. The close alignment of the points on the plot with the ideal prediction line ( y = x 
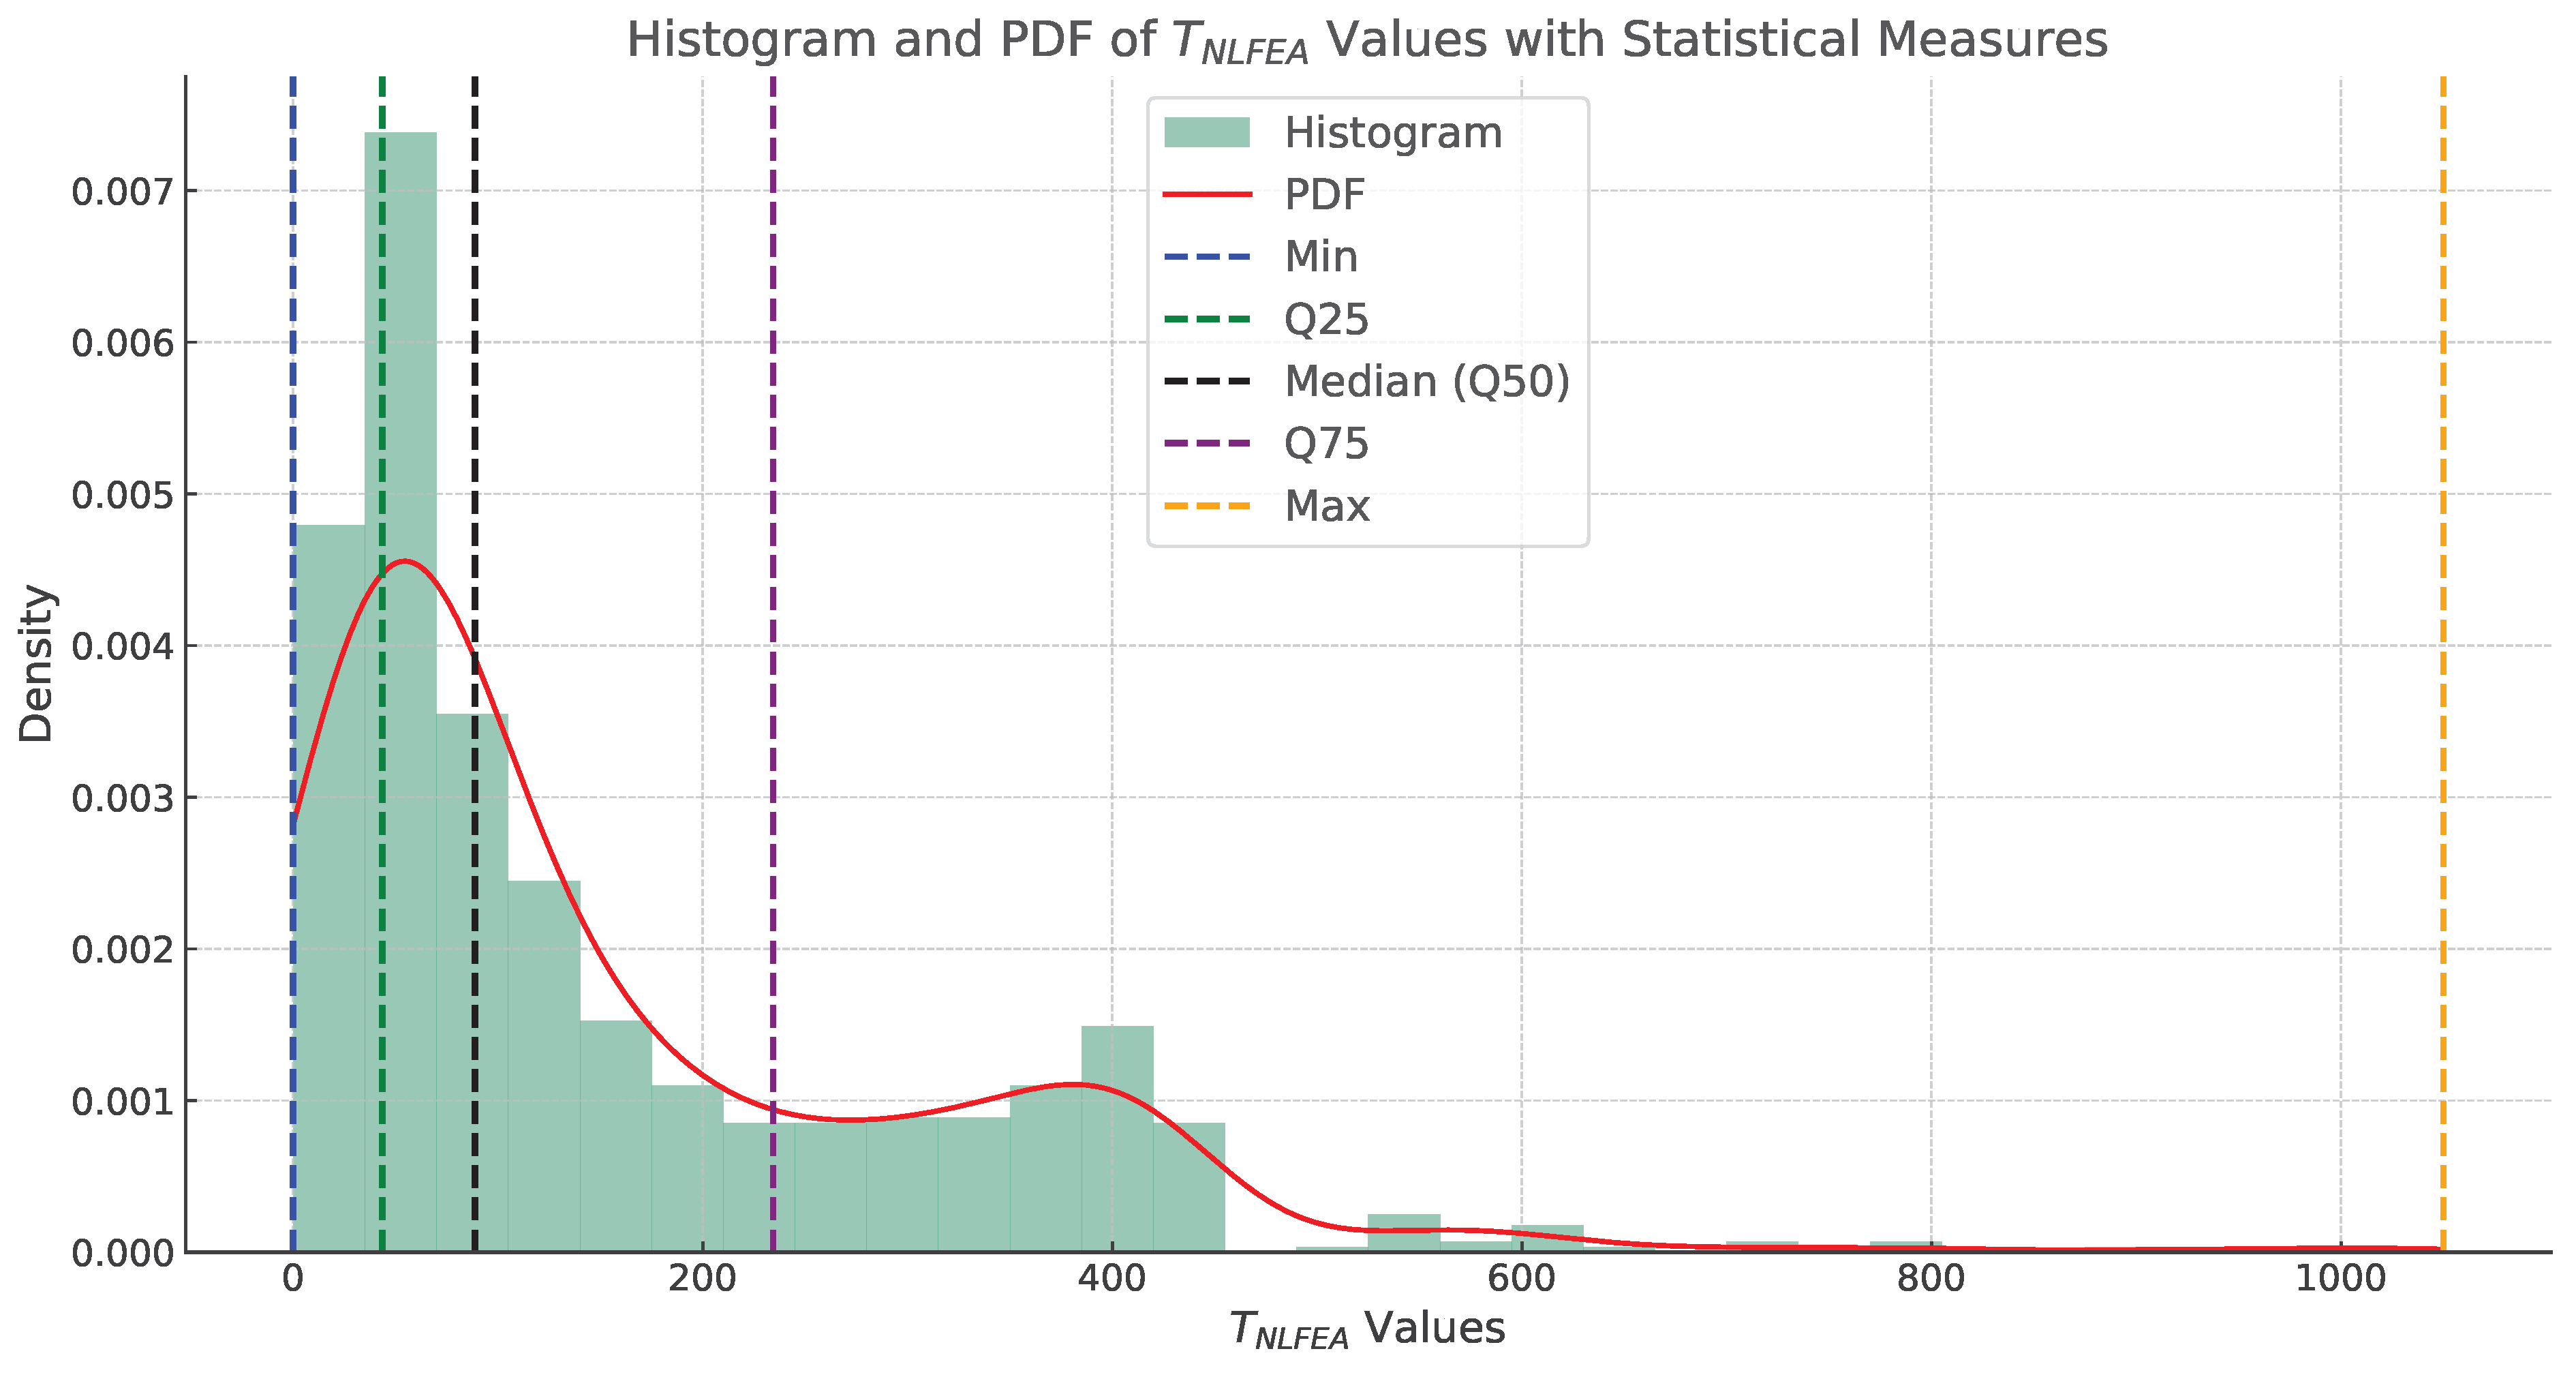
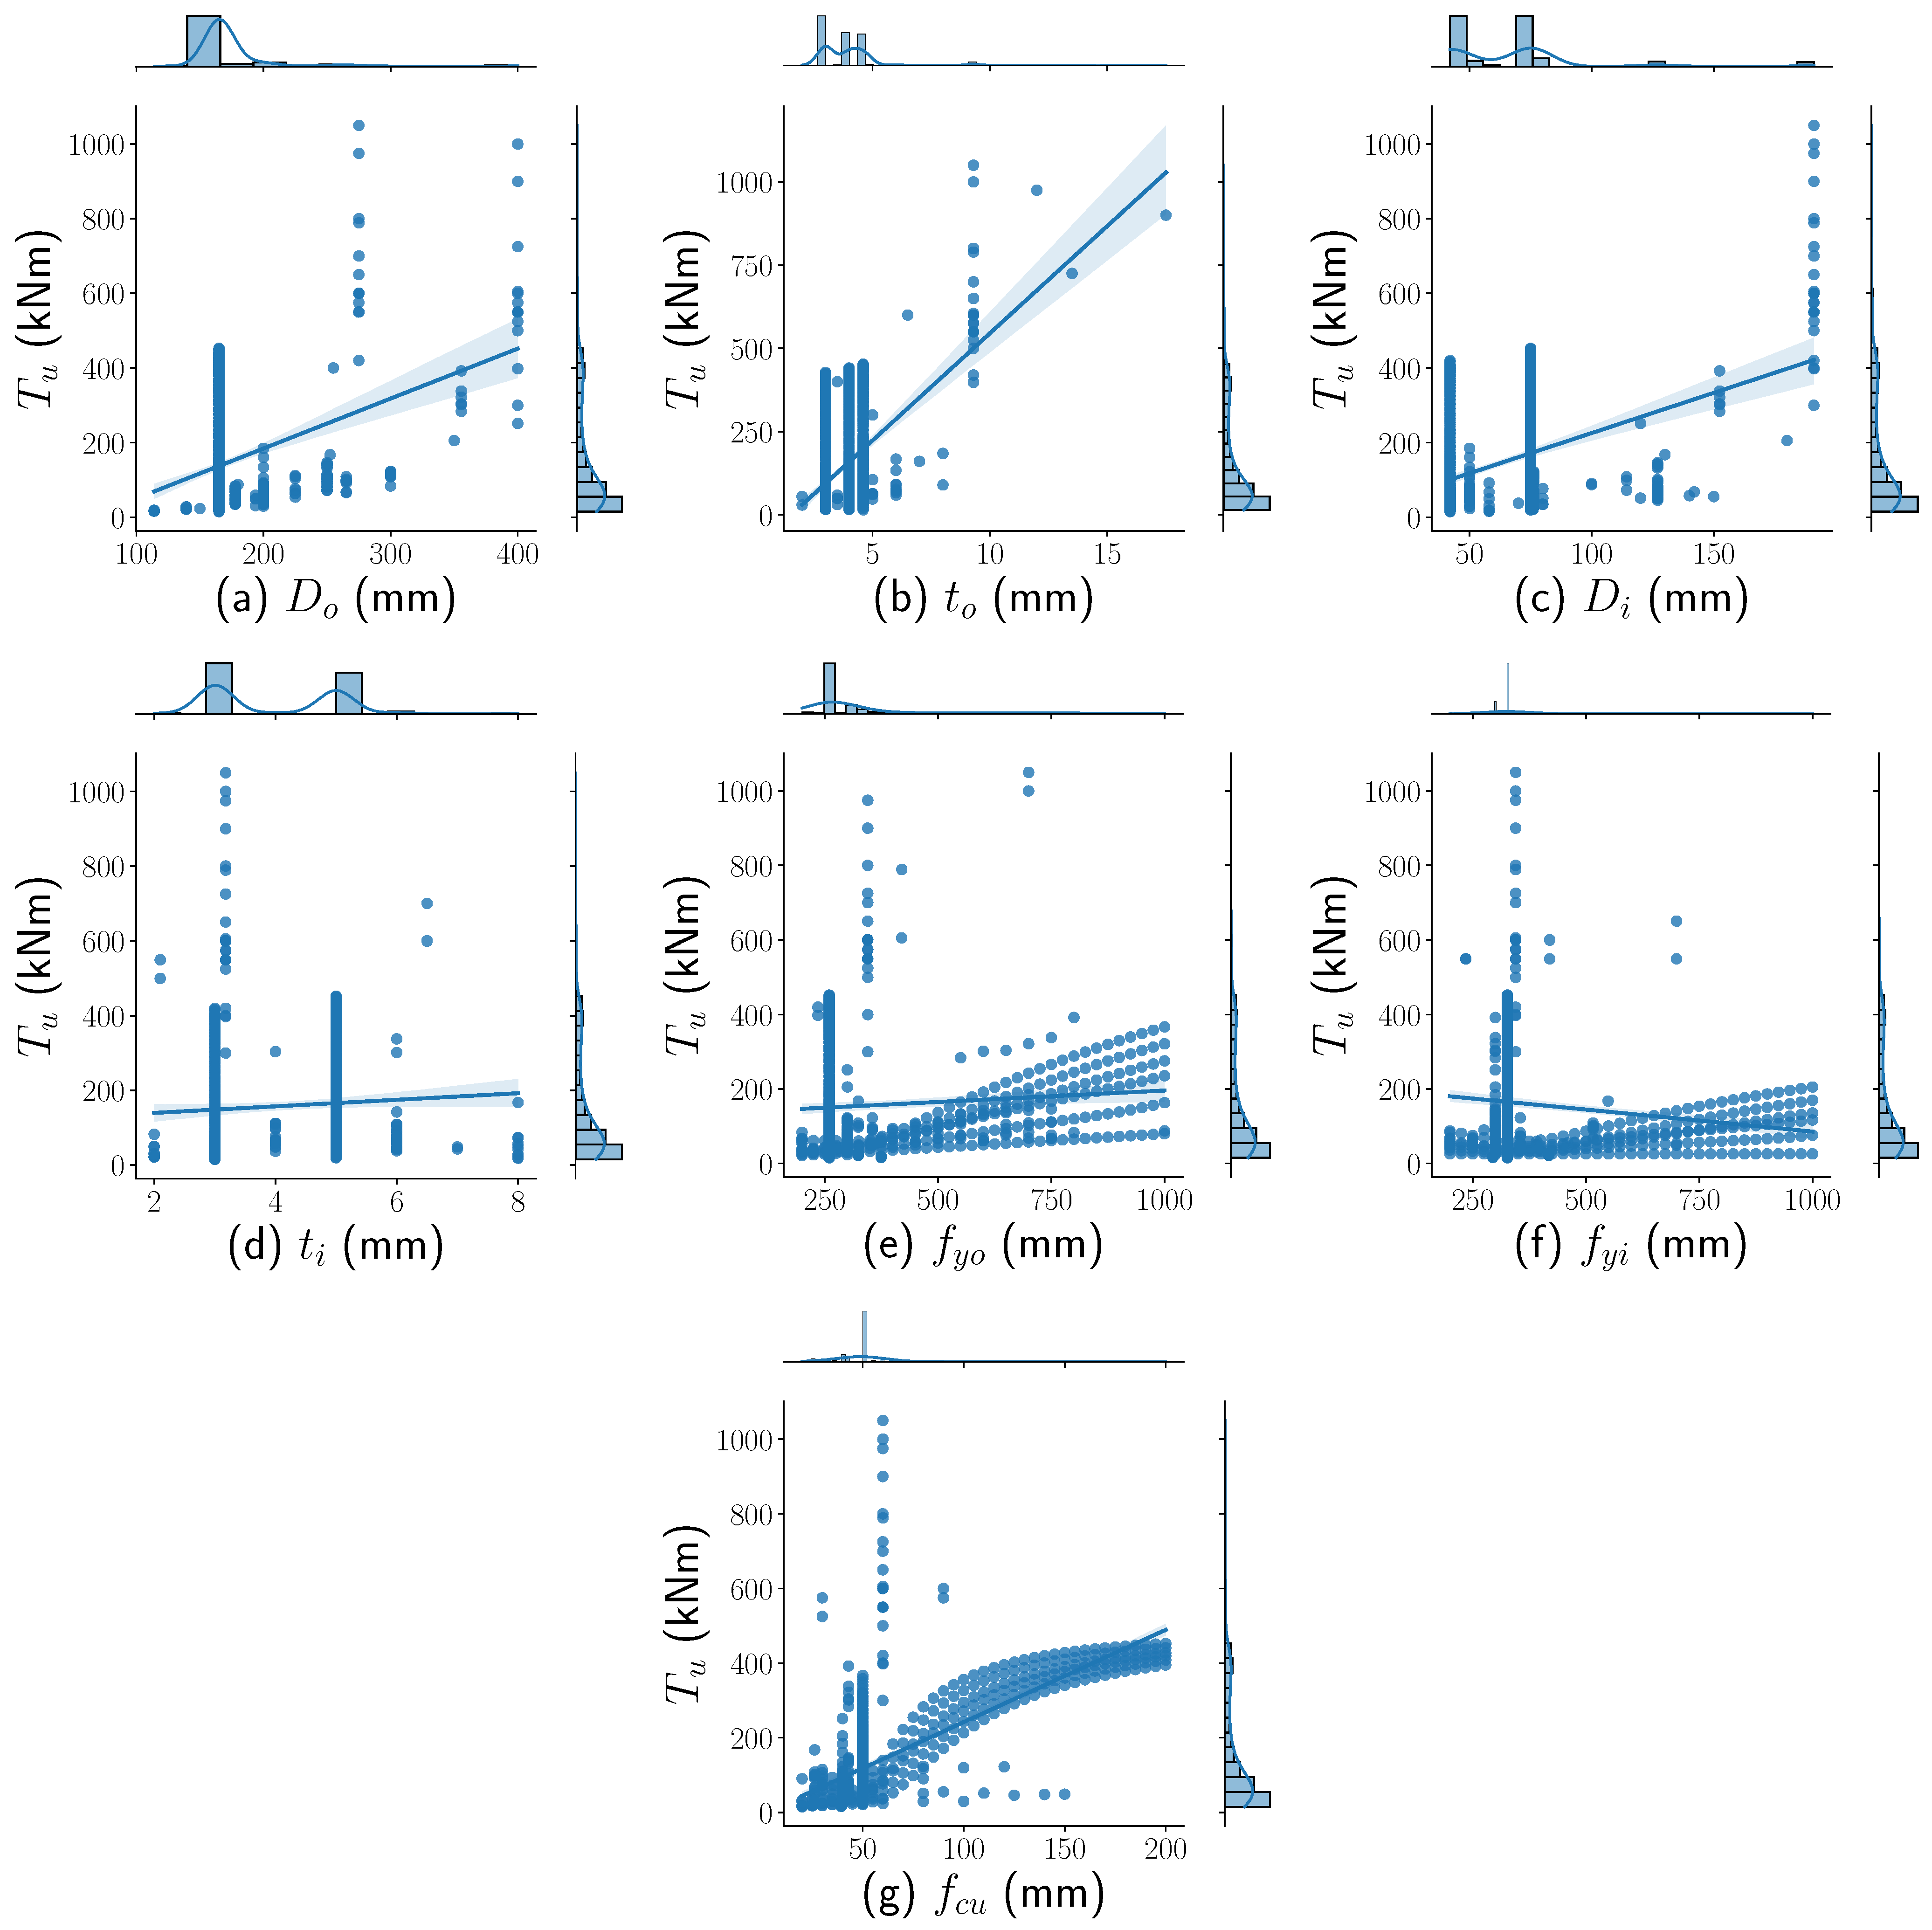
) indicates the high accuracy in predicting the torsional capacity of CFDST members. Prediction beyond 500 kNm for the testing and validation sets seems less strong due to the fact that most of the data are poorly represented in this range (Figure 4). Future studies on this topic should simulate NLFEA CFDST members with torque capacities beyond 500 kNm.
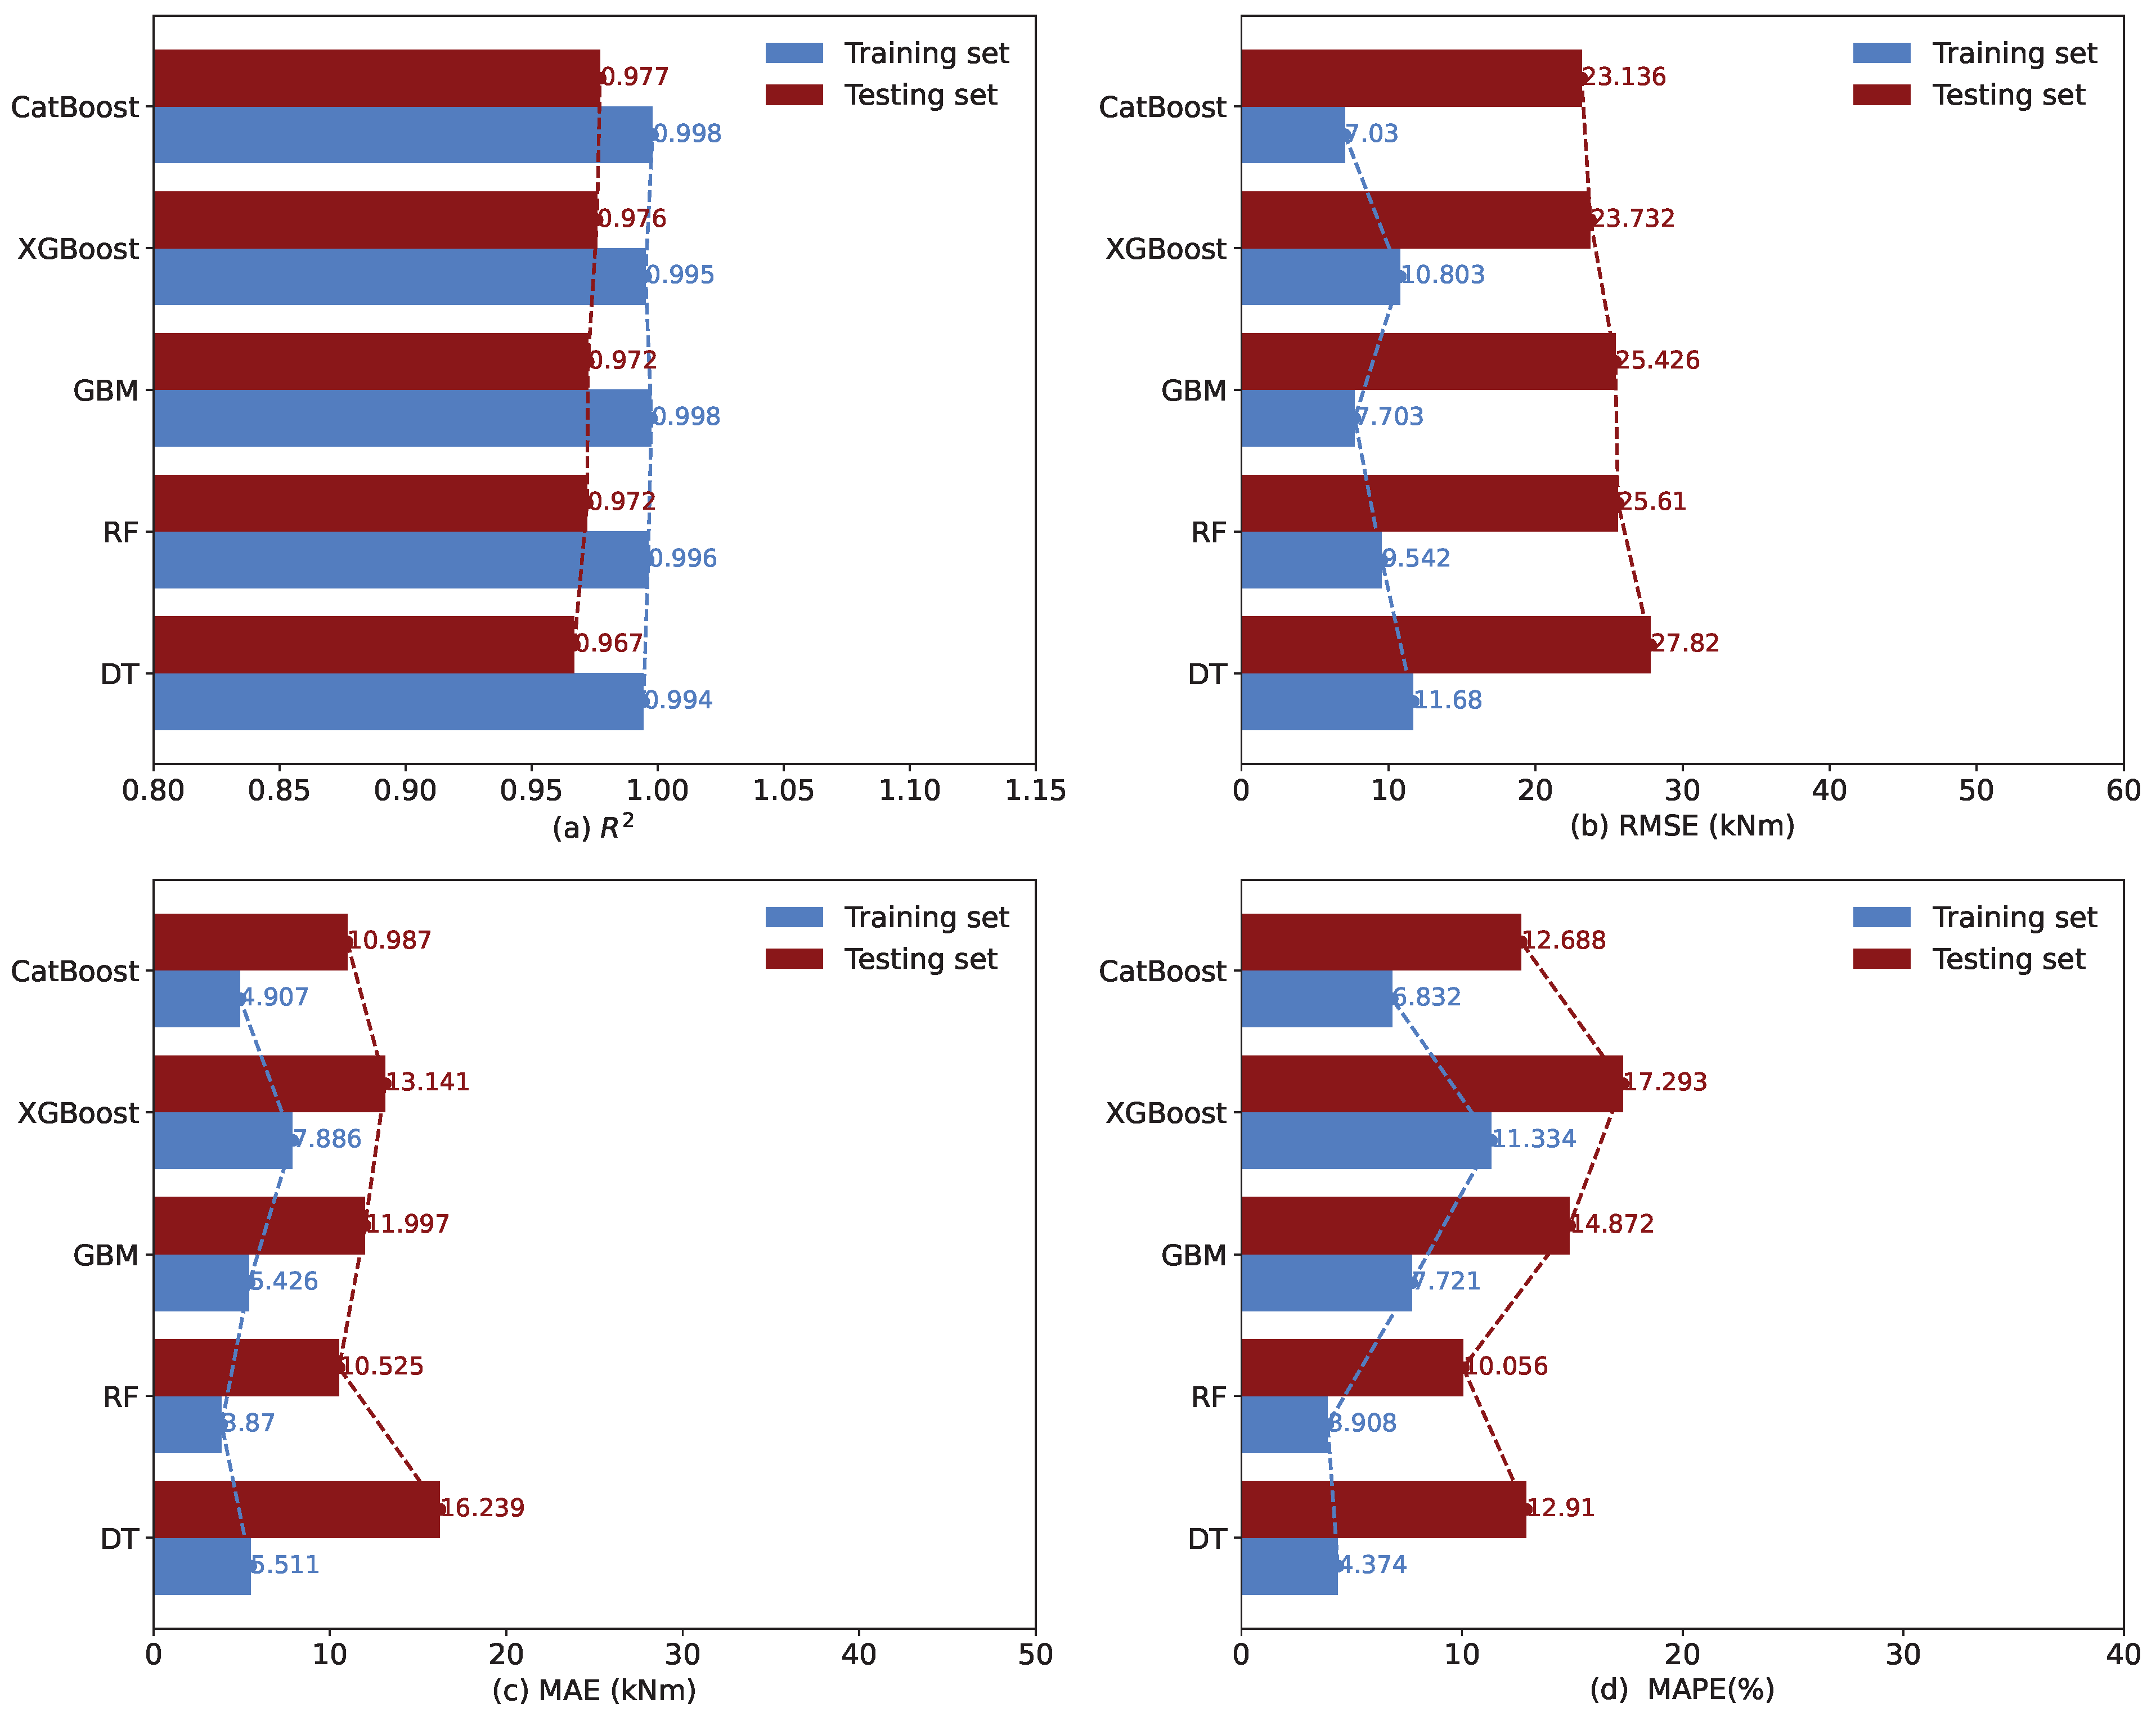
To delve deeper into the performance of these models that only focus on training and validation sets, four metrics— R 2 , RMSE, MAE, and MAPE—were employed. These metrics are outlined in Table 6 and further visualized in Figure 9. Each model’s performance is evaluated using four key metrics: R 2 (coefficient of determination), MSE (mean squared error), RMSE (root mean squared error), and MAE (mean absolute error).
Upon analysis, it was revealed that the highest R2 values and the lowest error metrics across both the training and testing sets were exhibited by CatBoost and GBM. Specifically, an R2 of 0.998 on the training set and 0.977 on the testing set was achieved by CatBoost, with the corresponding MSE values of 7.03 and 23.14, RMSE values of 4.91 and 10.99, and MAE values of 6.83 and 12.69, respectively. Similarly, the strong performance with an R2 of 0.998 on the training set and 0.972 on the testing set, accompanied by MSE values of 7.70 and 25.43, RMSE values of 6.43 and 12.00, and MAE values of 7.72 and 14.87, respectively, was demonstrated by GBM.
Conversely, competitive results were also yielded by XGBoost, RF, and DT, but they exhibited slightly lower R2 values and higher error metrics compared to CatBoost and GBM. Notably, the lowest RMSE and MAE values on the training set were demonstrated by RF, indicating its effectiveness in capturing the underlying patterns in the data.
These findings suggest that particularly well suited for predicting the torque capacity of CFDST members under pure torsion are CatBoost and GBM, due to their superior performance in both model fitting and generalization. The importance of selecting an appropriate ML model based on a thorough evaluation of its performance metrics is also highlighted by the results, considering factors such as overfitting tendencies, computational efficiency, and interpretability.

6. Comparison Study

The effectiveness of the studied algorithmic approach was determined by comparing the CatBoost and XGBoost models with the results calculated by two formulas proposed by previous researchers. The specific calculation formulas are described and given in Table 7. Due to the scarcity of research results on straight circular CFDST members under torsion, the database of NLFEA models presented in this work was used as a baseline for comparison, and this approach is justifiable given the large scope of the database.

6.1. Current Analytical Approaches

To the best of the authors’ knowledge, two analytical approaches are provided in the literature by Huang et al. [7] and Lu et al. [4]. These approaches represent the only design formulas identified in the available literature.
The approach of Huang et al. [7] considers the combined impact of the outer steel tube and sandwiched concrete and supplements it with the torsional contribution of the inner steel tube. Conversely, the design formula by Lu et al. [4] calculates the combined torsional capacity by summing the distinct contributions made by the outer steel tube, inner steel tube, and sandwiched concrete individually. A concise summary of the analytical formulas proposed by Huang et al. [7] and Lu et al. [4] for estimating the torque capacity of circular CFDST columns under torsion is provided in Table 7.
While offering a comprehensive and robust means of determining the torque capacity of CFDST columns, including accounting for crucial factors such as concrete and steel properties, tube dimensions, and shear stresses, the design formulas by Huang et al. [7] and Lu et al. [4] note that certain parameters like γ t , α , and β within the formula are calibrated through regression using a limited dataset of experimental results. Consequently, a degree of variability is anticipated when these parameters are applied across a broader design space. In the subsequent section, the two best ML models, namely CatBoost and XGBoost models, are employed to evaluate and quantify this variability. This assessment will serve as the foundation for future investigations into full probabilistic analyses or safety factor calibrations following the partial factor format, particularly for circular and straight CFDST members subjected to pure torsion.

6.2. Comparison Analysis

A graphical comparison of the torque capacity of CFDST beams, obtained from the compiled NLFEA database and predicted by the two proposed ML models, is presented in Figure 10a,b. Additionally, the comparison between the database and the two analytical models found in the literature is illustrated in Figure 10c,d. The figures clearly indicate that superior predictions of the torsional capacity of CFDST columns are provided by the proposed ML models compared to the two analytical approaches. This superiority is evidenced by the ML models’ calculated and measured torque capacities clustering more closely around the ideal fit line, denoted by T u , pred / T u , NLFEA = 1 . Furthermore, it is observed that, in comparison to the ML-based models, the torque capacity of CFDST columns tends to be underestimated by the formulas presented in the literature by Huang et al. [7] and Lu et al. [4], with Huang et al.’s model outperforming Lu et al.’s in this regard.
It is evident from the figures that our proposed ML models provide the superior predictions of the torsional capacity of CFDST columns when compared to the two analytical approaches. This is indicated by the ML models’ calculated and measured torque capacities clustering more closely around the ideal fit line, denoted by T u , pred / T u , NLFEA = 1 . Furthermore, it can be observed that the formulas presented in the literature by Huang et al. [7] and Lu et al. [4] tend to underestimate the torque capacity of CFDST columns in comparison to our ML-based models. Notably, Huang et al.’s model [7] outperforms Lu et al.’s [4] in this regard.
For a quantitative assessment of this comparison in terms of performance metrics, the values of R 2 , RMS, MSE, and MAE have been computed and presented in Table 8. These metrics confirm a robust correlation between the torque capacity predicted using the proposed ML models and the actual results, further reinforcing the superior estimation capabilities of the ML-based predictive expressions for the torque capacity of CFDST columns.

6.3. Extrapolation Capabilities

Six (6) examples were solved with the finite element model for cases where the values are beyond the values presented in Table 4 in order to check the extrapolation capabilities of the CatBoost algorithm. The results of the comparison between the NLFEA and CatBoost model are shown in Table 9.

6.4. Extrapolation Capabilities

The ability of machine learning models to accurately predict outcomes in scenarios beyond the confines of their training data is crucial for their application in engineering simulations. This study investigates the extrapolation capabilities of the CatBoost algorithm in predicting the ultimate torque ( T u ) of Concrete-Filled Double Skin Steel Tubes (CFDSTs) by comparing its predictions with those from Nonlinear Finite Element Analysis (NLFEA) across six case examples that extend beyond the parameter ranges presented in Table 4.
As detailed in Table 9, the comparison encompasses a variety of geometrical and material parameters, including outer diameter ( D o ), thicknesses ( t o , t i ), and yield strengths ( f y o , f y i ), alongside the ultimate compressive strength of concrete ( f c u ). The ultimate torque values predicted by NLFEA ( T u , N L F E A ) and those estimated by the CatBoost model ( T u , C a t b o o s t ) were compared, with their ratio ( T u , N L F E A / T u , C a t b o o s t ) providing insight into the model’s performance.
The mean ratio of the ultimate torques ( T u , N L F E A / T u , C a t b o o s t ) across all cases is reported as 1.055, with a coefficient of variation (CoV) of 0.021. These results indicate that the CatBoost model tends to slightly underestimate the ultimate torque when extrapolating beyond the trained dataset, yet with a relatively small variation in the accuracy of its predictions.
This analysis reveals that the CatBoost model possesses a commendable ability to extrapolate within certain bounds but also highlights the challenges that machine learning models face when predicting scenarios far removed from their training data. Future work could explore the incorporation of a broader range of training data or the implementation of adaptive learning techniques to further enhance the model’s extrapolation capabilities.

7. SHAP Interpretation

Recent advancements, such as SHAP, have made a significant impact on enhancing the transparency and interpretability of ML predictions [49]. SHAP provides insights on two levels: it illuminates the influence of each input variable globally, contributing to the overall interpretability, and it enables local interpretability through Shapley values, which assess the importance of features for individual predictions. The explanation model, denoted by g ( z ) , is described by a linear function of binary features in additive feature attribution methods [49].
g ( z ) = ϕ 0 + i = 1 M ϕ i z i
where M denotes the number of input features and ϕ i represents the Shapley value of feature i, the computation is outlined as follows. Let S denote the set of all features, and S i denote the set of features excluding feature i. P ( S ) refers to the power set of S, containing all possible subsets of S, while | A | represents the cardinality, or the number of elements, in set A. The Shapley value ( ϕ i ) for a particular feature i is calculated using the given formula [49]:
ϕ i = A P ( S i ) | A | ! · ( | F | | A | 1 ) ! | F | ! f ( A { i } ) f ( A )
In this process, the sum is taken over all possible subsets A that exclude feature i, with F denoting the set of all features. The terms f ( A i ) and f ( A ) represent the model’s output with and without the inclusion of feature i in subset A, respectively. This formula quantifies the marginal contribution of feature i across all possible combinations of features, offering a comprehensive view of the possible feature subsets.
Focusing on the prediction of torque capacity in CFDST members under pure torsion, the CatBoost model has been identified as the most effective among the five ML models evaluated. Therefore, for SHAP analysis, the CatBoost model is utilized, highlighting its capability to not only provide accurate predictions but also to offer meaningful insights into the factors influencing those predictions.

7.1. Global SHAP Interpretation

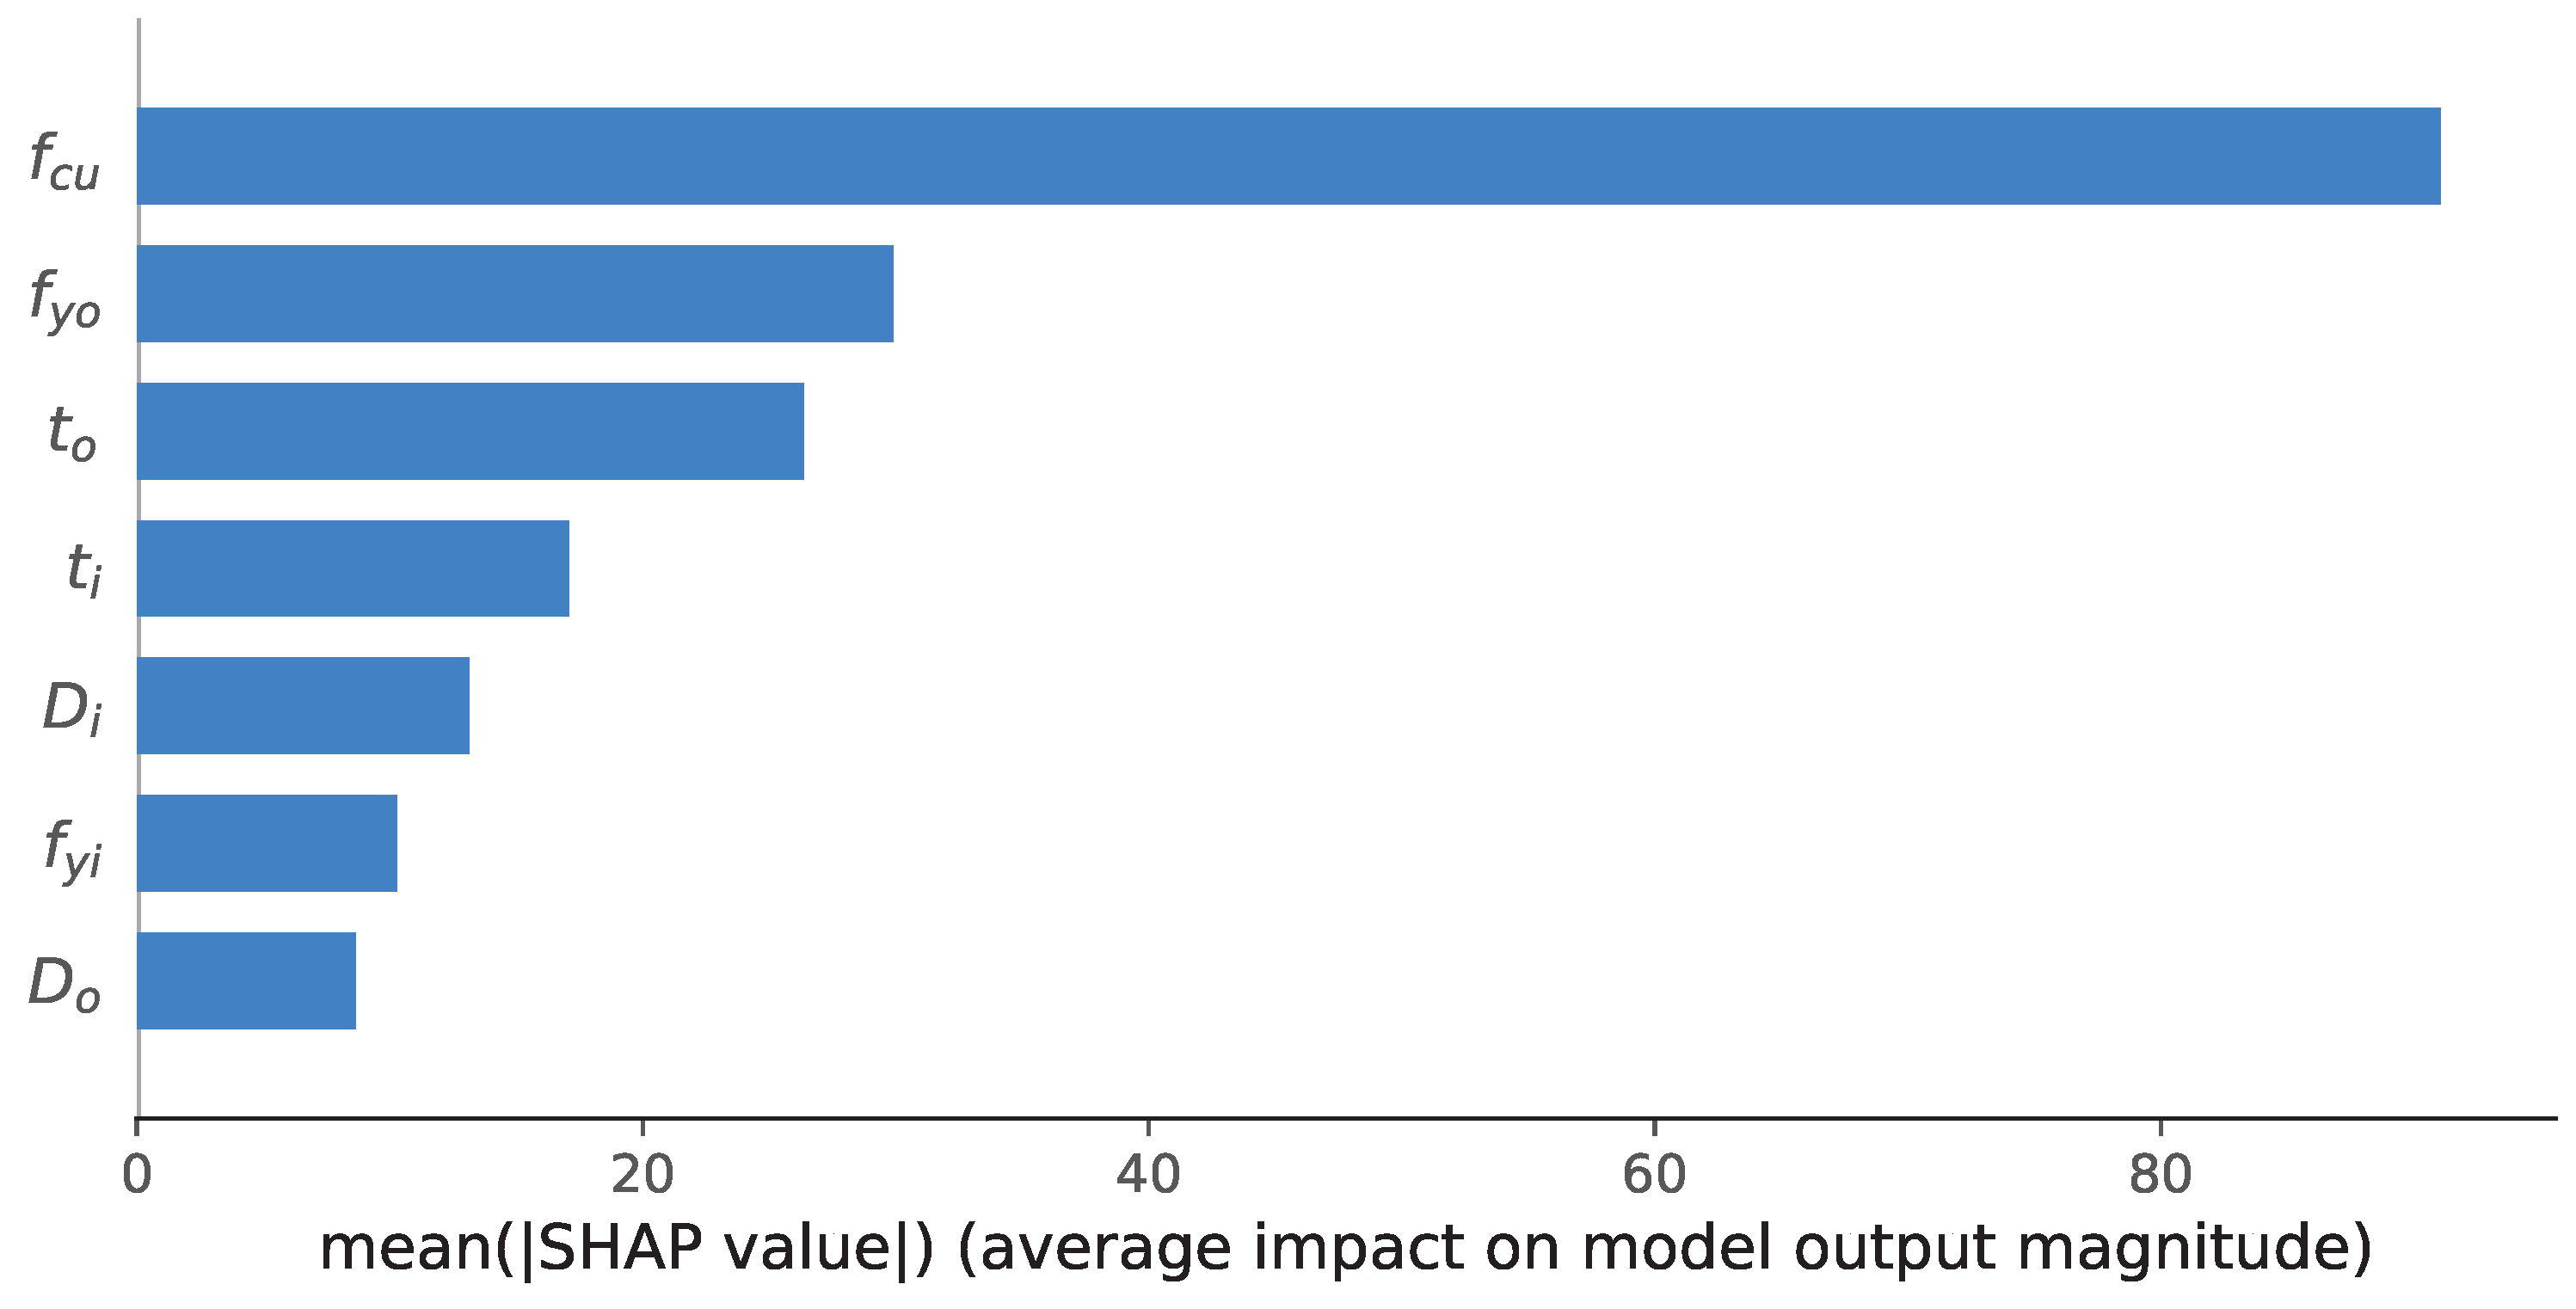
The factors influencing the torque capacity of CFDST columns are understood to be crucial for their optimal design. SHAP analysis has been recognized as a potent tool for unveiling the significance of various features within the CatBoost model, providing insights at both the global and local levels. Globally, the overall impact that each feature exerts on the predictions of torque capacity is elucidated by SHAP. Identified through this analysis (see Figure 11), the concrete compressive strength ( f c u ), the yield strength of the outer steel tube ( f y o ), the thickness of the outer steel tube ( t o ), and the thickness of the inner steel tube ( t i 
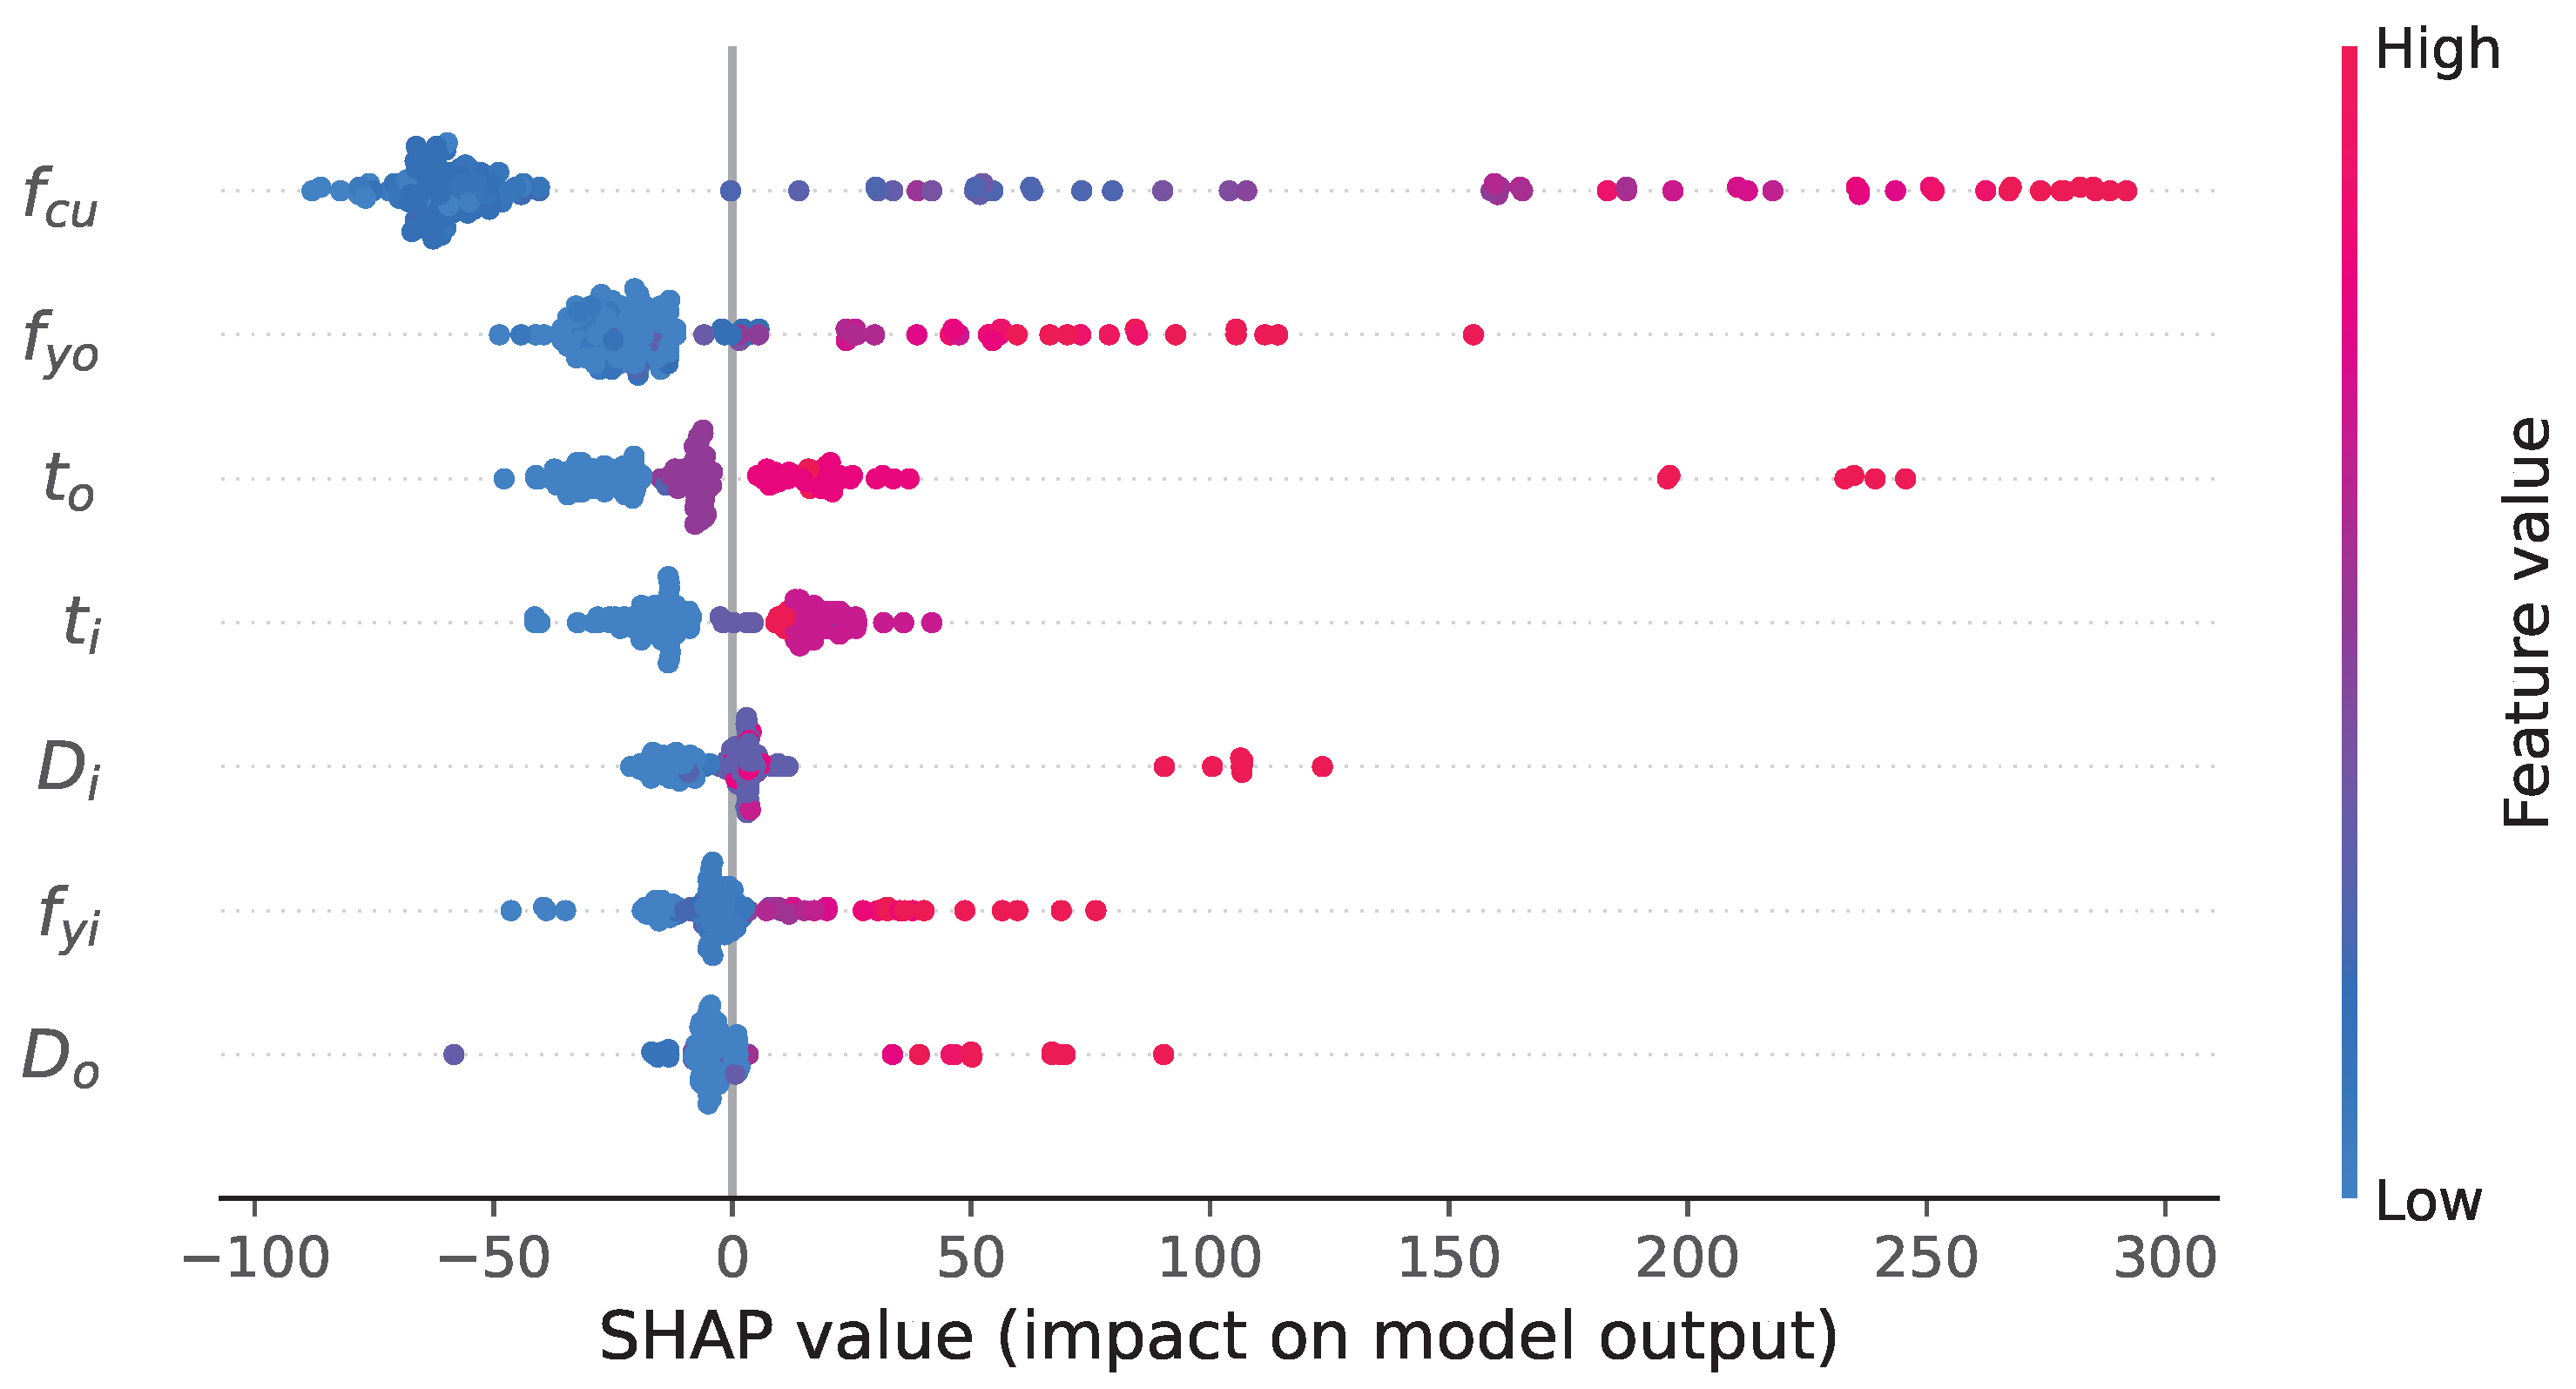
) have been found to be the top four influential parameters. In the SHAP summary plot (Figure 12), lower feature values are represented by blue dots, while higher feature values are signified by red dots. It is noteworthy that a positive influence on the SHAP values is exhibited by nearly all parameters, indicating that the enhancement of the torque capacity of CFDST columns is contributed to by increasing these parameters. This observation is in alignment with the findings from previous studies [4,7], reinforcing the importance of these factors in the structural performance of CFDST columns.

7.2. Local SHAP Interpretation

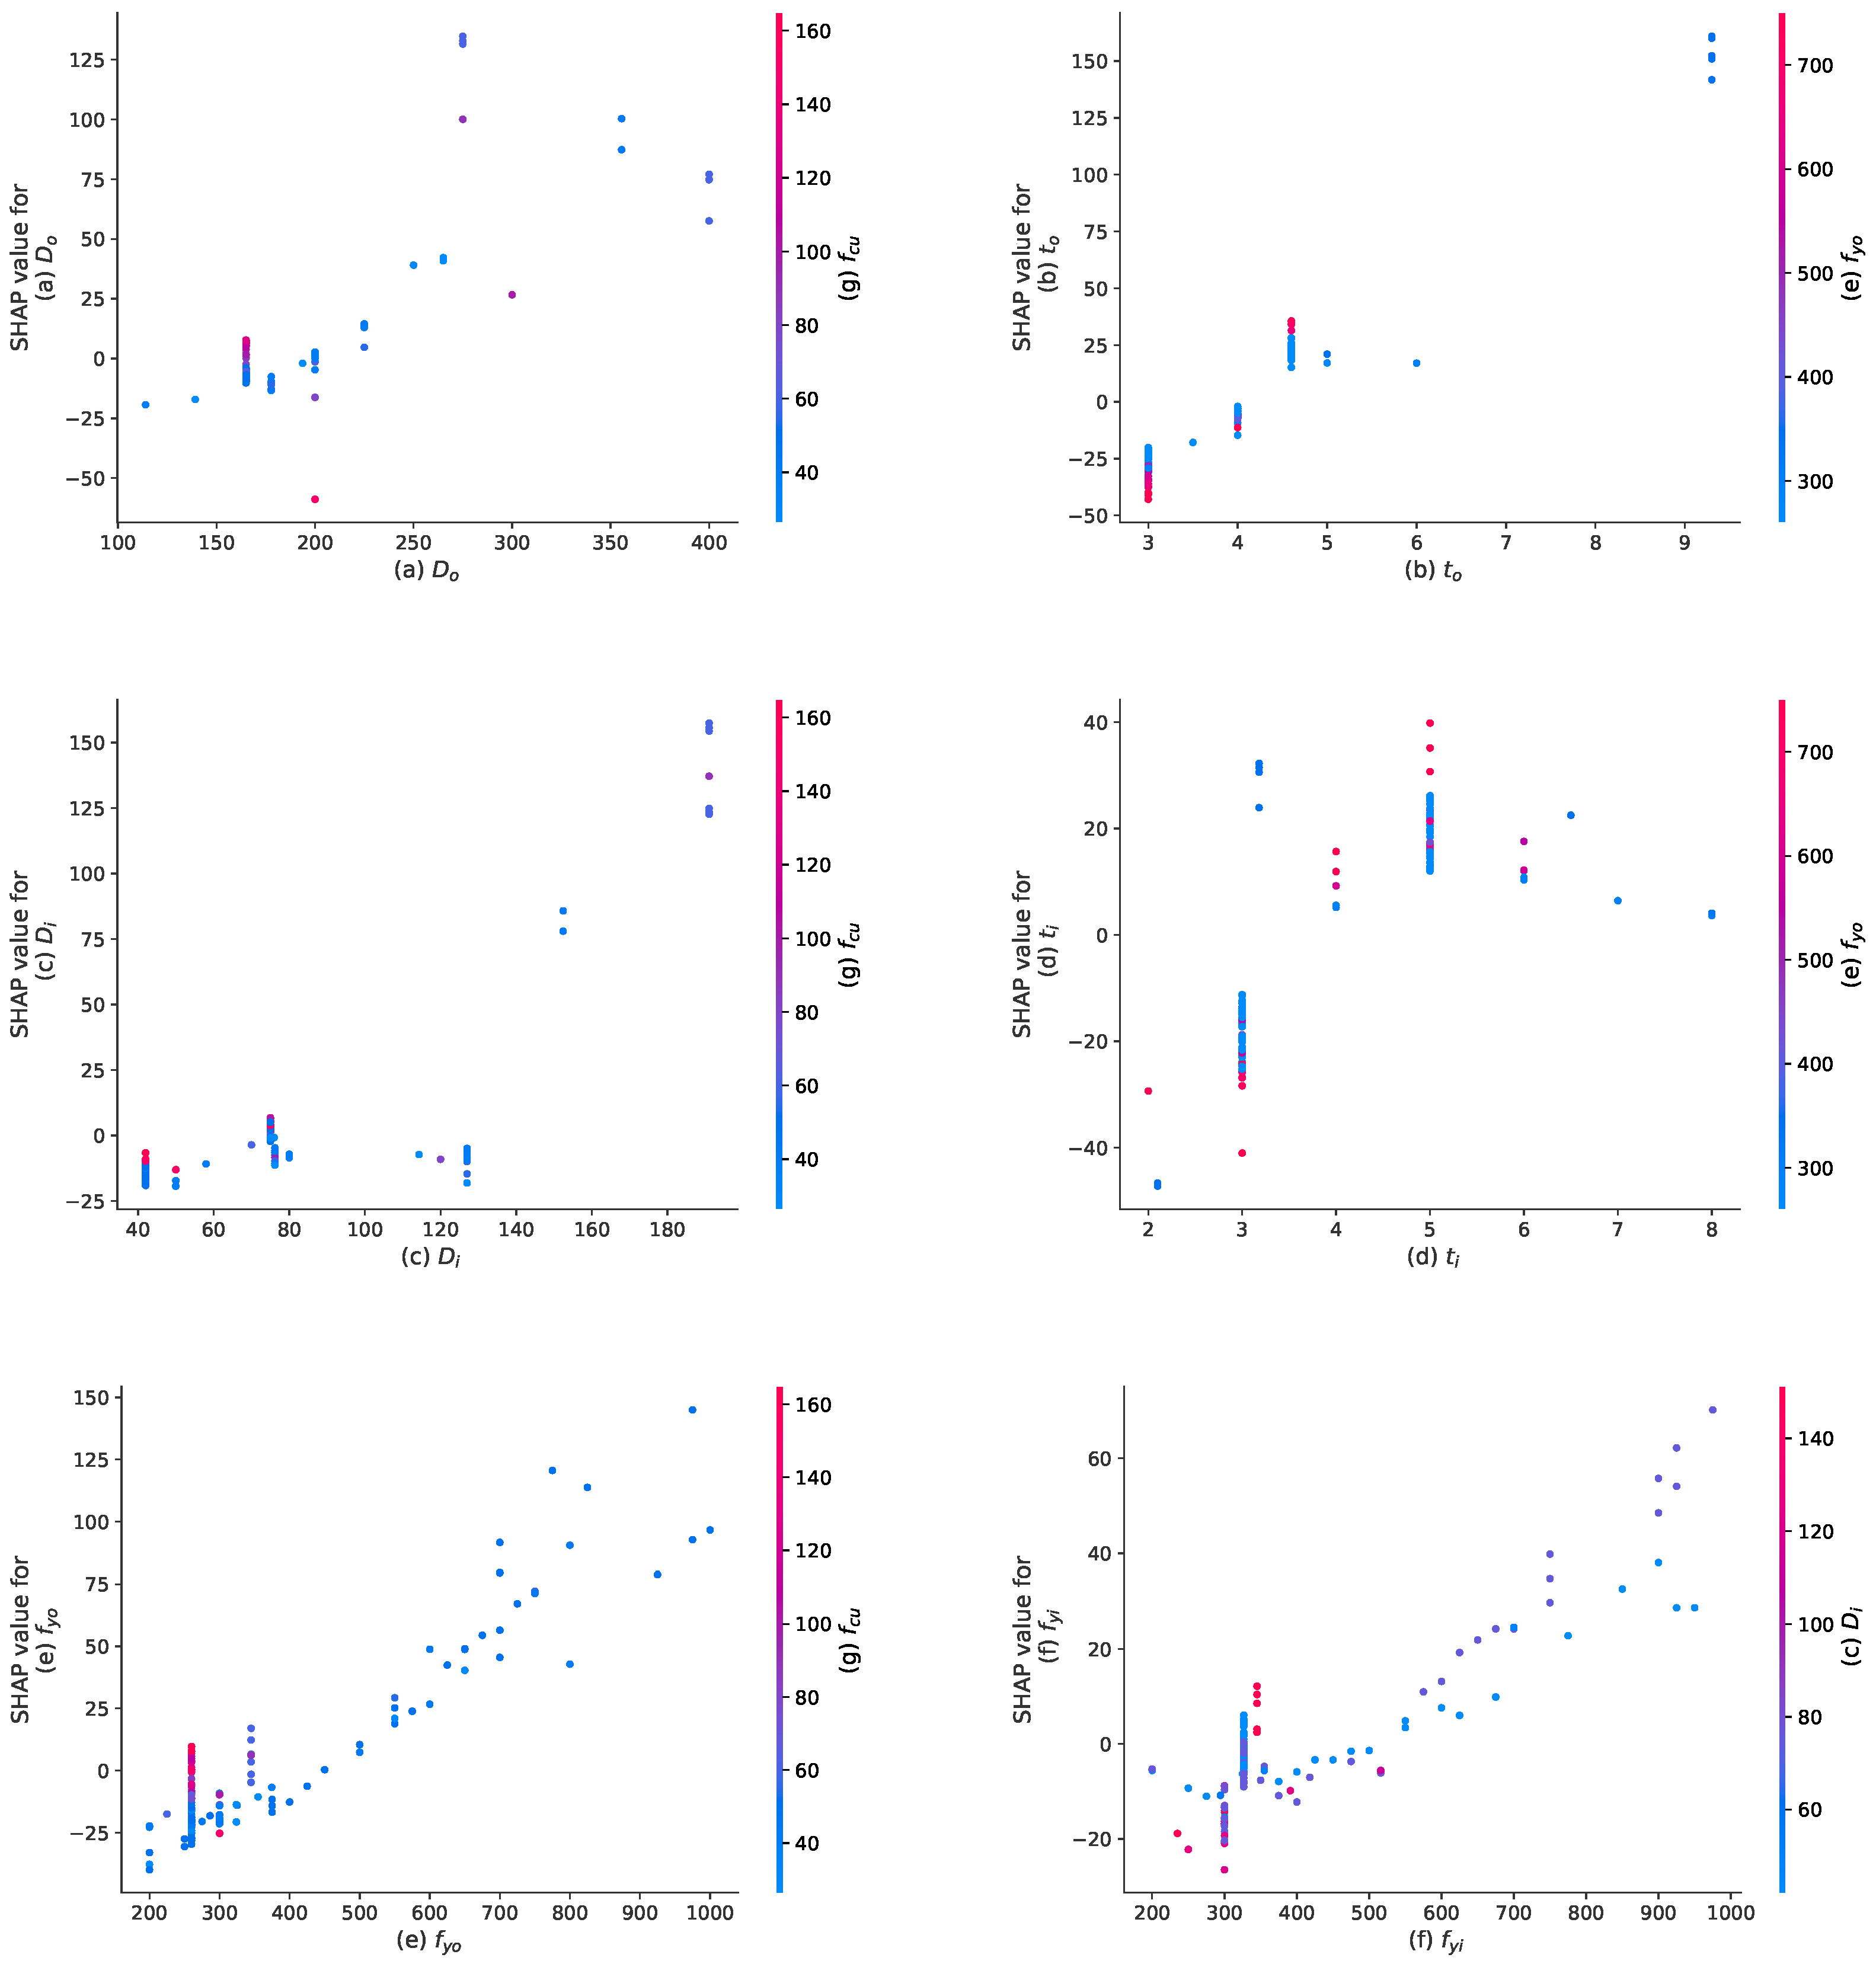
Averages are only provided by Global SHAP which may not reveal specific critical features, while a closer examination of individual data points is offered by local SHAP. When the CatBoost model for CFDST torque capacity under pure torsion is analyzed, crucial insights are revealed by local SHAP, as depicted in Figure 13, regarding the interaction among input features. A clear interrelationship between the input features and their contributions to the overall prediction of the CatBoost model is evident across all plots in Figure 13.
For the outer steel tube diameter ( D o ) against concrete compressive strength ( f c u ), it is indicated in Figure 13a that a positive effect on torque capacity prediction using the CatBoost model is associated with a larger D o combined with a high f c u for CFDST members. Conversely, for CFDST columns with a smaller D o , negative SHAP values for various levels of f c u are exhibited, although these values are only slightly below zero, indicating a minor influence on the reduction in torque capacity.
Regarding the thickness ( t o ) against the yield strength ( f y o ), it is revealed by Figure 13b that a positive impact on torque capacity prediction for the outer steel tube of CFDST members is associated with a larger t o combined with a high f y o . However, for CFDST columns with a smaller t o , high negative SHAP values for high values of f y o are exhibited, indicating a significant influence on the reduction in torque capacity.
For the inner steel tube diameter ( D i ) against concrete compressive strength ( f c u ), it is shown by Figure 13c that a positive effect on torque capacity prediction for CFDST members is associated with a larger D i combined with a high f c u . Conversely, for CFDST columns with a smaller and medium D i , negative SHAP values for various levels of f c u are exhibited, although these values are slightly below zero, indicating a relatively minor influence on the reduction in torque capacity.
Regarding the inner steel tube thickness ( t i ) against the yield strength ( f y o ), it is indicated by Figure 13d that the relationship between t i and f y o is unclear in the CatBoost model, as expected due to the intuitive independence of these two variables.
For the yield strength ( f y o ) against concrete compressive strength ( f c u ), it is demonstrated by Figure 13e that a positive impact on torque capacity prediction by the CatBoost model is associated with large values of both f y o and f c u . Although a linear relationship is observable, for very small values of f y o , the SHAP value turns negative only for small values of f c u , which are positive for the medium and high values of f c u . This suggests that a consistently positive impact on torque capacity prediction using the current CatBoost model is provided by f c u , regardless of the values of f y o .
For the inner steel yield strength ( f y i ) against the inner steel tube diameter ( D i ), an exponential relationship between f y i and D i is illustrated by Figure 13f, indicating that larger values of these parameters lead to an exponential increase in torque capacity prediction via the CatBoost model. However, for smaller values of f y i and high values of D i , negative SHAP values are observed, suggesting a slight negative impact on torque capacity by f y i when the hollow section ratio of the CFDST column increases.

7.3. Implications for Engineering Practice

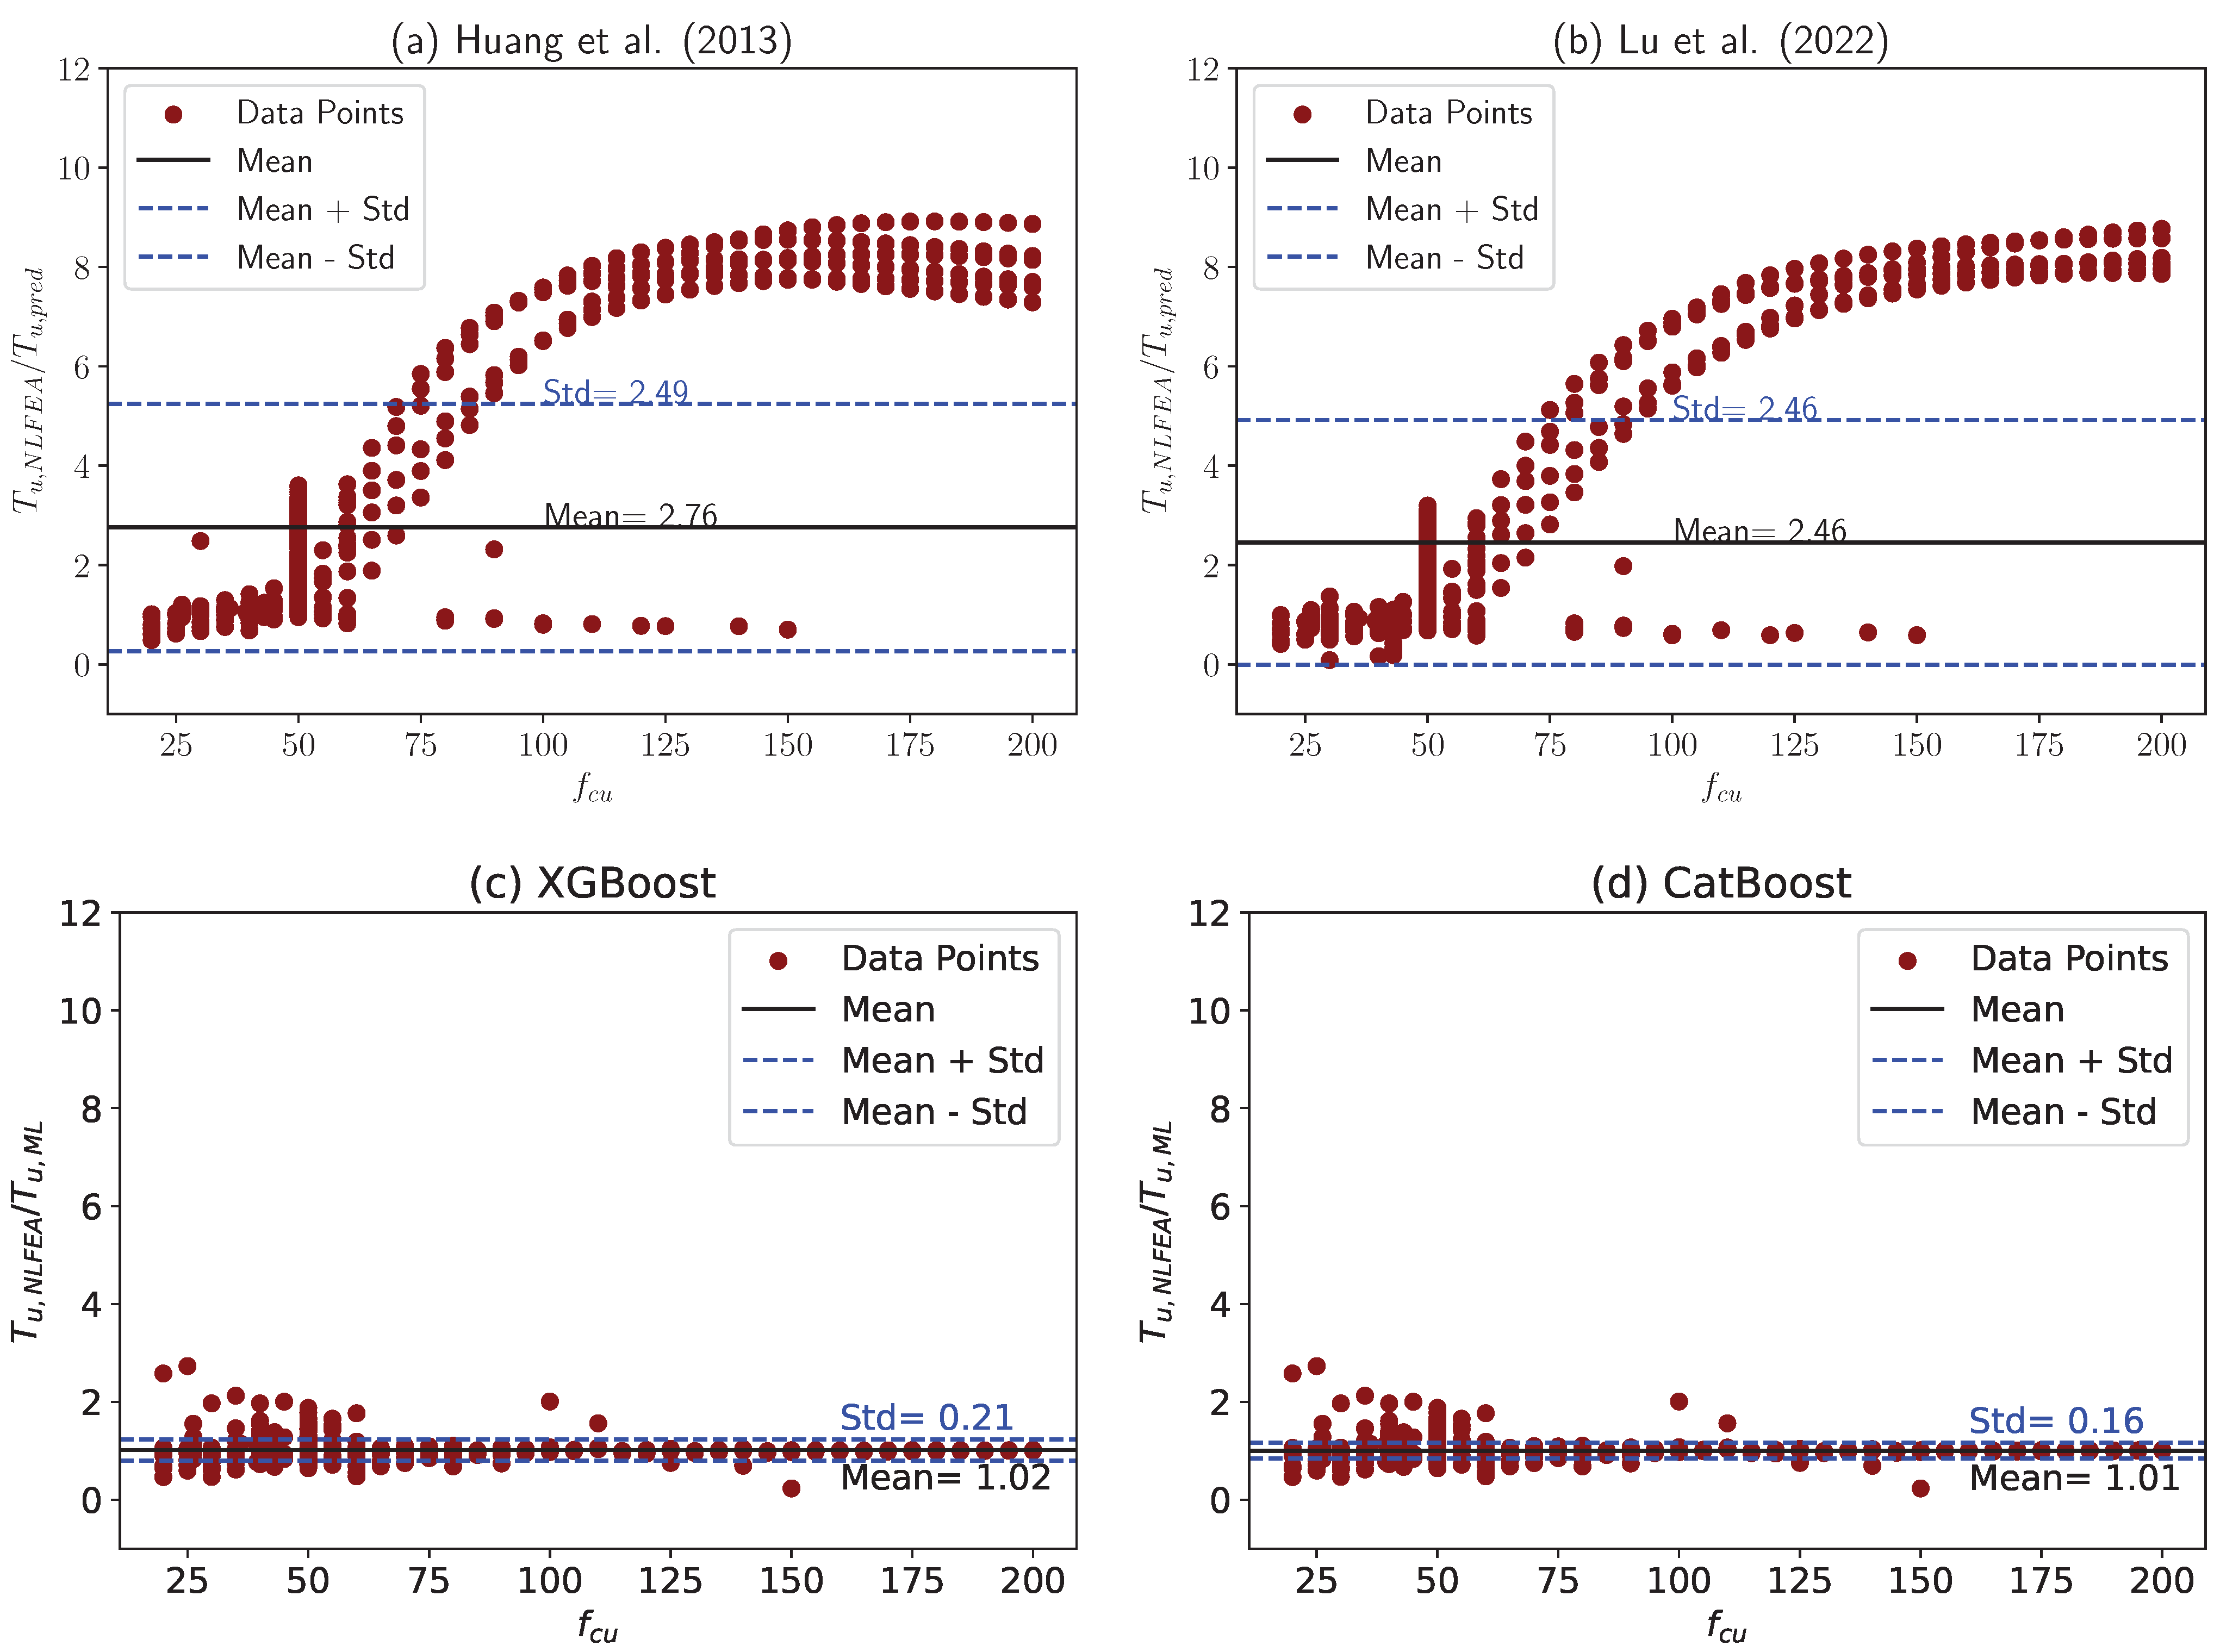
The performance evaluation of the CatBoost and XGBoost models, along with comparisons to empirical models and SHAP analysis, provides valuable insights for engineering practices in the design of CFDST columns subjected to pure torsion. Superior predictive capabilities are demonstrated by the CatBoost model, as evidenced by high R 2 values and minimal mean errors, establishing it as a reliable tool for engineers in search of precise torque capacity predictions.
Identified through global SHAP analysis, crucial parameters such as concrete compressive strength, outer steel tube yield strength, outer steel tube thickness, and inner steel tube thickness offer specific targets for optimization [50]. The intricate relationships unveiled by the local SHAP analysis highlight the interconnectedness of these parameters, providing engineers with a comprehensive understanding for customized design choices. Practical implications include the prioritization of key parameters to enhance torque resistance and the integration of advanced machine learning techniques into structural engineering practices [
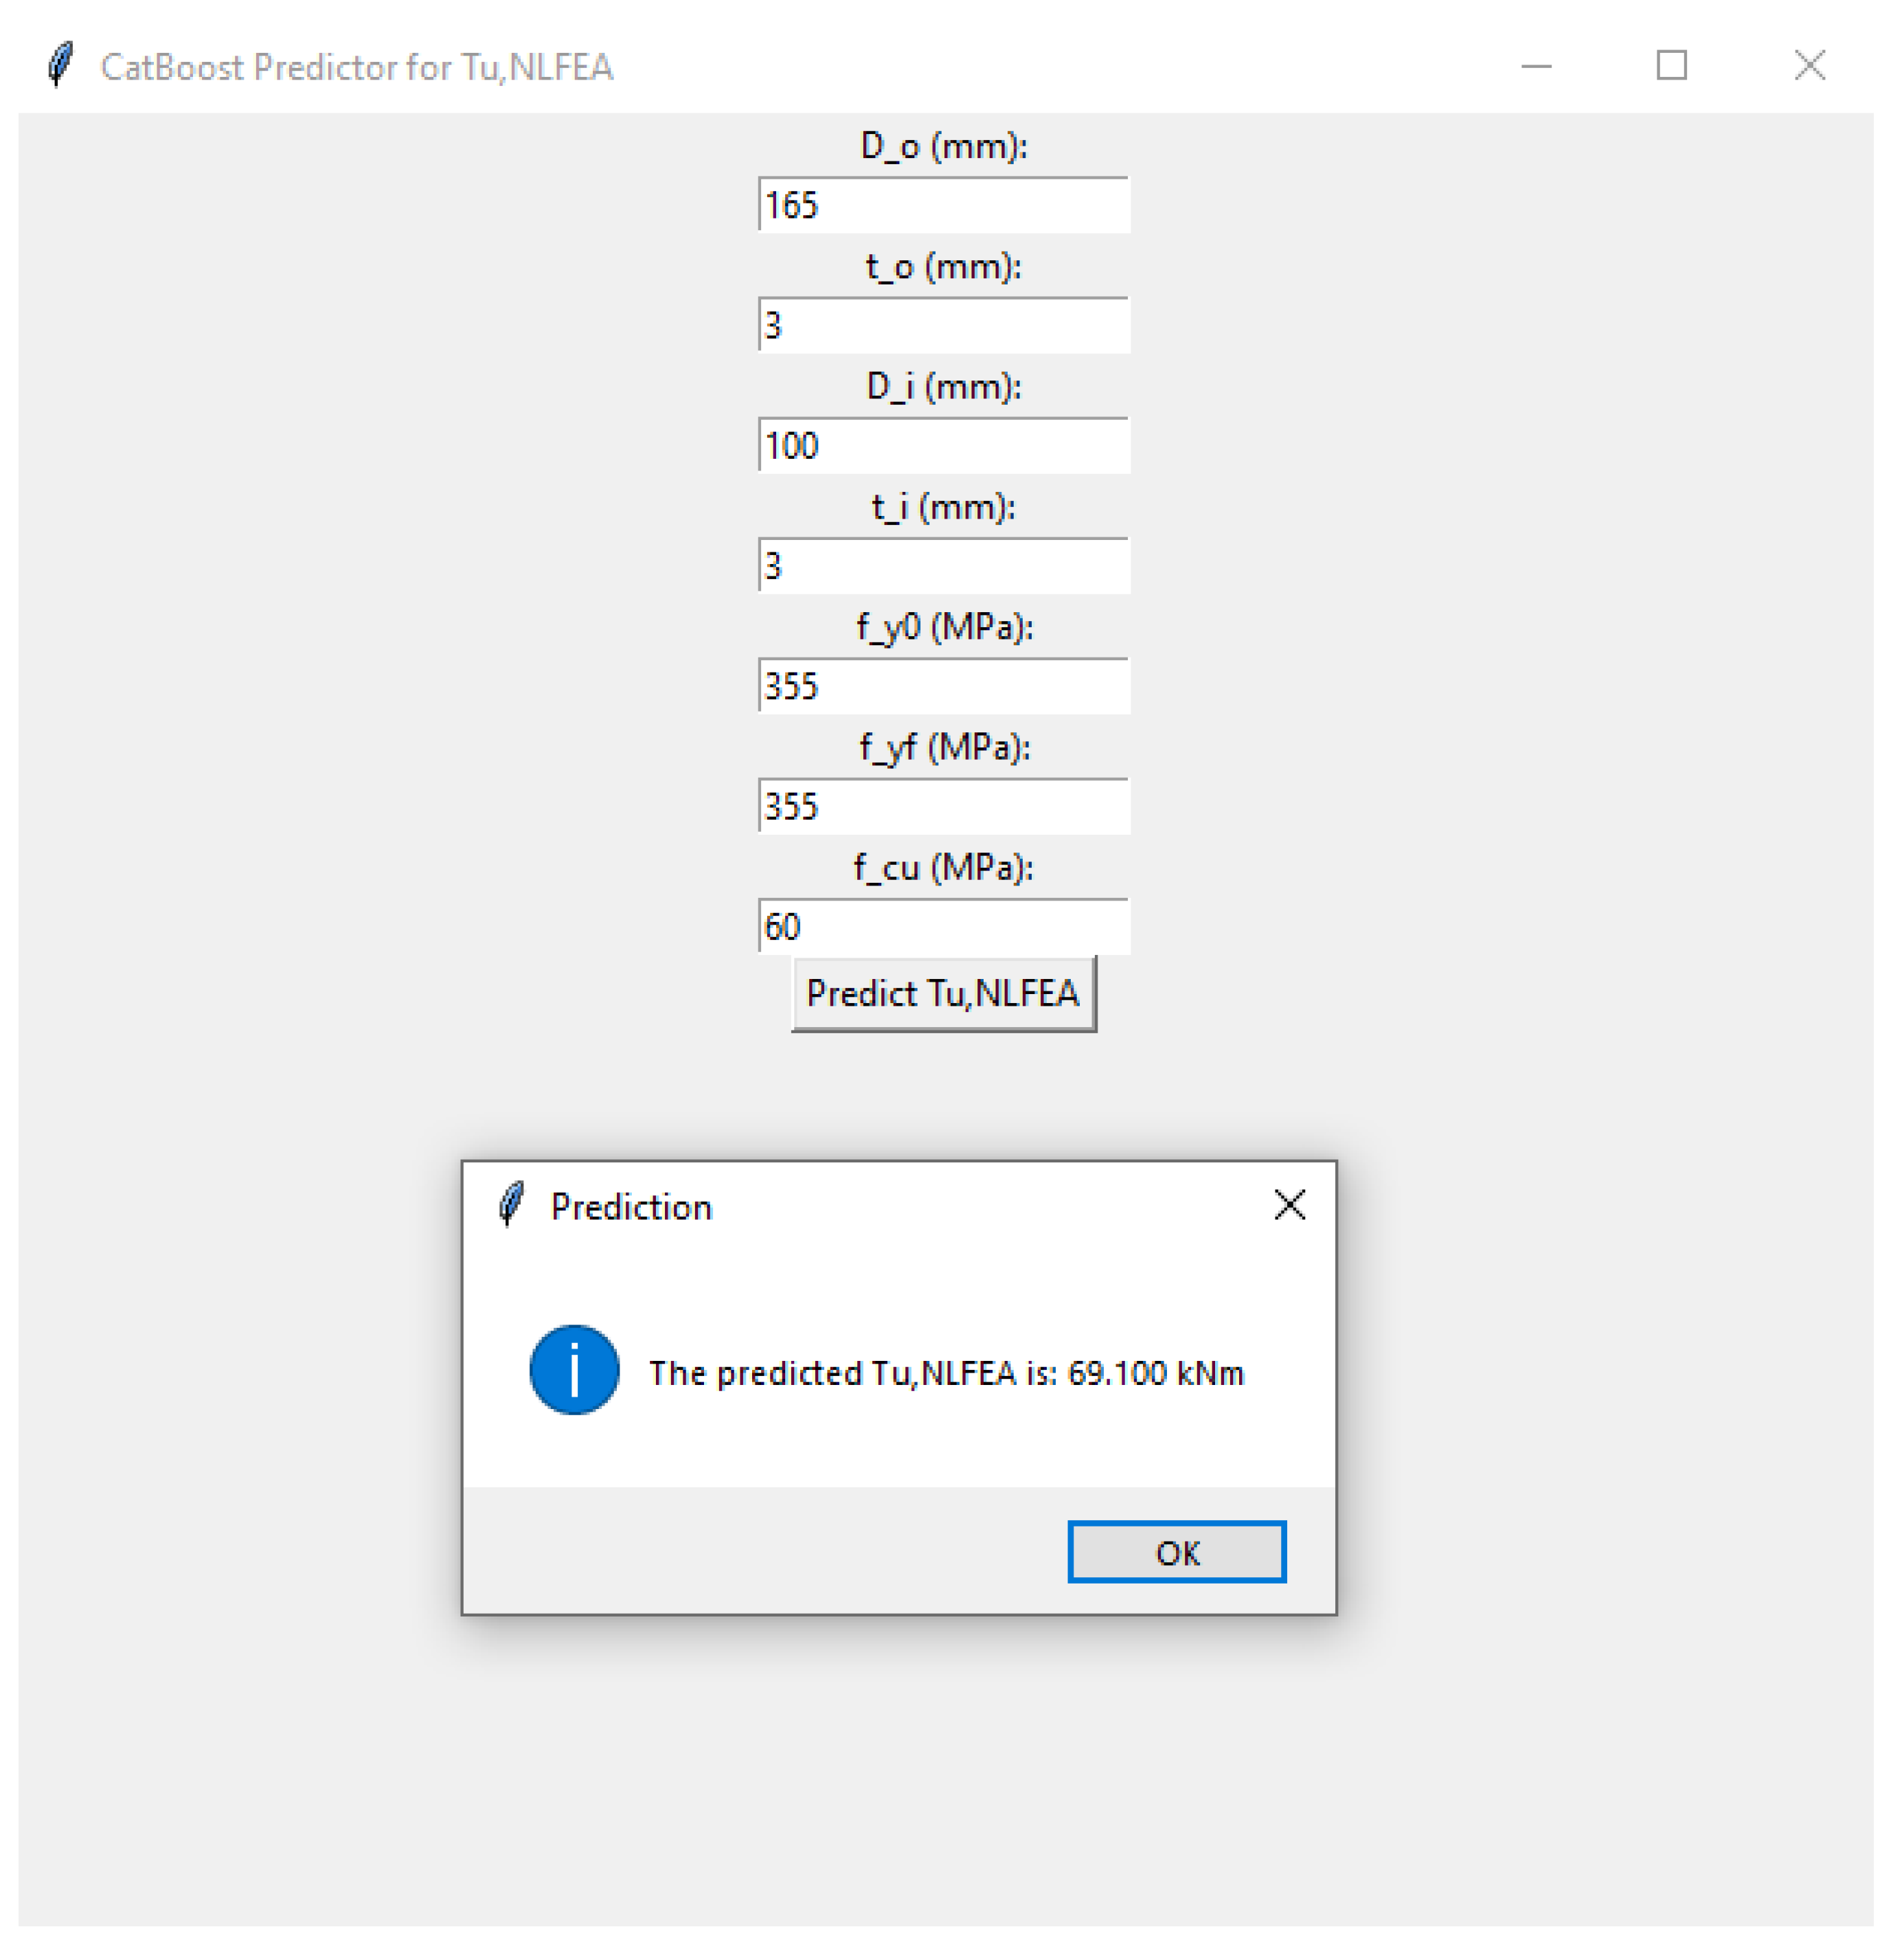
51]. This research narrows the gap between conventional empirical models and tree-based ML tools, enabling engineers to develop more effective and informed designs of CFDST columns for superior structural performance [50] by using the presented hyperparameters (e.g., for Catboost) to build a graphical user interface for the ease of use by lame engineers who may not understand ML codes (see Figure 14).

8. Limitations

The efficacy of any machine learning (ML) model significantly relies on the size, quality, and distribution of parameters within the chosen dataset. In this research, we harnessed a dataset consisting of over 806 NLFEA instances to construct models for predicting the torque capacity of CFDST columns. This dataset holds potential for expansion, especially considering the growing interest in expediting the testing of specialized thin-walled CFDST members intended for use in tall buildings and viaducts. Consequently, even though we employed the complete dataset of NLFEA instances for our data-driven ML framework in this study, it is expected that enhancing the dataset’s size will lead to improvements in the framework’s performance.
It is important for readers to recognize that the developed expressions are valid only within the range of variables presented in the dataset, as depicted in Figure 6 and Table 4. As previously mentioned, Figure 6 provides insights into the frequency of each significant variable present in the dataset. It is evident that certain values or ranges of features have limited occurrences in the dataset, resulting in a lower frequency for these variable values. While our proposed framework remains applicable, ensuring the reliability and applicability of expressions across a broader spectrum of variables necessitates additional testing and NLFEA data. Furthermore, acquiring more test data related to CFDST columns with diverse configurations and a higher occurrence of various variable ranges can facilitate the development of ML algorithms that can effectively derive new equations for different CFDST column configurations. This includes configurations with tapered cross-sections, which have gained increasing relevance in industries such as offshore and electricity.

9. Concluding Summary

Valuable insights into predicting the torque capacity of circular CFDST members under pure torsion using ML techniques, supplemented by SHAP (Shapley Additive Explanations) interpretation, are offered by the study. Through extensive analysis and comparison, several significant observations have been made:
  • The efficacy of CatBoost and XGBoost models in accurately predicting torque capacity is highlighted by the performance evaluation of various ML algorithms. High R 2 values and minimal mean errors are exhibited by these models, establishing them as robust tools for engineers in structural design applications.
  • The comparison study with existing empirical models underscores the superiority of ML-based approaches. More precise predictions of torque capacity are provided by the CatBoost model, in particular, outperforming traditional analytical formulas proposed by Huang et al. and Lu et al. This suggests the potential for ML techniques to enhance the accuracy and efficiency of structural design practices.
  • Deeper insights into the influence of input features on torque capacity predictions are offered by the SHAP interpretation. Significant contributors to torque capacity, such as concrete compressive strength and steel tube dimensions, are identified as key parameters by global SHAP analysis. Complex interactions among these parameters are elucidated by local SHAP analysis, providing engineers with actionable insights for optimizing CFDST column designs.
Overall, the gap between conventional empirical models and advanced ML tools is bridged by this study, paving the way for more effective and informed structural design practices. By leveraging the predictive capabilities of ML and the interpretability of SHAP, data-driven decisions to enhance the performance and reliability of CFDST structures in real-world applications can be made by engineers. The further refinement of ML models and exploration of additional input features could lead to even more accurate predictions in future work. Additionally, the resilience and robustness of CFDST structures against torsional loading could be enhanced by integrating probabilistic analyses and safety factor calibrations based on ML-derived predictions.

Author Contributions

L.S.: Conceptualization of this study, methodology, software, writing—original draft. B.D.I.: methodology, funding acquisition, writing—review and editing. All authors have read and agreed to the published version of the manuscript.

Funding

The involvement of Lenganji Simwanda in the research was supported by the University of South Africa (UNISA) Postdoctoral Research Fellowship. The Article Processing Charge (APC) was funded by UNISA CSET Research Office and Department of Civil & Enviromental Engineering and Building Sciences.

Data Availability Statement

All data, models, or scripts that support the findings of this study are available from the first author upon reasonable request (Lenganji Simwanda).

Acknowledgments

Machine learning and SHAP computations and s were performed using the scikit-learn toolkit’s APIs in Python 3.7. Feedback from two anonymous reviewers was received, offering substantial suggestions that contributed to enhancing the quality of the paper.

Conflicts of Interest

The authors declare that they have no known competing financial interest or personal relationships that could have appeared to influence the work reported in this paper.

Nomenclature

A c Cross-sectional area of the confined concrete
A c e Nominal core concrete cross-sectional area
A s c o Cross-sectional area of the outer steel tube and the confined concrete
A s c Cross-sectional area of CFDST member
A s i Cross-sectional area of inner steel tube
A s c Cross-sectional area of outer steel tube
D i Inner steel tube outer diameter
D o Outer steel tube outer diameter
f c k Characteristic concrete compressive strength
f c u 28-day characteristic concrete cube compressive strength
f c Cylinder concrete compressive strength
f s y i Strength of inner steel tube at yield under normal stress
f s y o Strength of outer steel tube at yield under normal stress
TTorque
T u c 1 Torque–capacity predicted via Huang et al.’s formula
T u c 2 Torque–capacity predicted via Lu et al.’s formula
T u , N F E A Torque–capacity predicted via NLFEA model
W s c t Polar section modulus of outer steel tube and concrete
W s i Polar section modulus of inner steel tube
W s o Polar section modulus of outer steel tube
t o Thickness of outer steel tube
t i Thickness of inner steel tube
α Steel ratio
α n Nominal steel ratio
χ CFDST hollow ratio
ε Strain
θ Rotation angle due to torque
τ s c y Strength of the composite section of outer steel tube and concrete under torsion
τ y Yield strength of steel in shear
τ y i Yield strength of inner steel tube in shear
τ y o Yield strength of outer steel tube in shear
ξ Confinement factor

References

  1. Ekmekyapar, T.; Hasan, H.G. The influence of the inner steel tube on the compression behaviour of the concrete filled double skin steel tube (cfdst) columns. Mar. Struct. 2019, 66, 197–212. [Google Scholar] [CrossRef]
  2. Yan, X.F.; Zhao, Y.G. Experimental and numerical studies of circular sandwiched concrete axially loaded cfdst short columns. Eng. Struct. 2021, 230, 111617. [Google Scholar] [CrossRef]
  3. Guo, J.L.; Pan, S.; Guo, X.; Wu, Z.Y. Numerical simulation of the dynamic responses and impact-bearing capacity of cfdst columns under lateral impact. Buildings 2023, 13, 805. [Google Scholar] [CrossRef]
  4. Lu, G.B.; Zhou, X.H.; Wang, Y.H.; Deng, X.W.; Bai, Y.T.; Zhu, R.H. Numerical investigation on circular concrete-filled double skin steel tube columns under torsion. Structures 2022, 37, 17–31. [Google Scholar] [CrossRef]
  5. Deng, R.; Zhou, X.; Wen, H.; Li, R.; Ji, W.; Wang, Y.; Ren, W. Torsional behaviour of tapered concrete-filled double-skin steel tubular columns with large hollow ratios. Thin-Walled Struct. 2023, 183, 110343. [Google Scholar] [CrossRef]
  6. Zhang, D.L.; Jiang, Z.Q.; Zhao, S.X.; Lu, G.B.; Zhou, X.H.; Wang, Y.H. Cyclic behavior and ultimate bearing capacity of circular concrete-filled double skin steel tube members subjected to combined compression and torsion. Thin-Walled Struct. 2023, 186, 110707. [Google Scholar] [CrossRef]
  7. Huang, H.; Han, L.H.; Zhao, X.L. Investigation on concrete filled double skin steel tubes (cfdsts) under pure torsion. J. Constr. Steel Res. 2013, 90, 221–234. [Google Scholar] [CrossRef]
  8. Lu, G.; Su, M.; Zhou, X.; Deng, X.; Bai, Y.; Wang, Y. Numerical analysis on torsional behavior of rectangular and square cfdst members. J. Constr. Steel Res. 2022, 193, 107294. [Google Scholar] [CrossRef]
  9. Wang, J.T.; Liu, X.H.; Sun, Q.; Li, Y.W. Analytical behavior and bearing capacity research on out-of-code tapered cfdst members under pure torsion and compression-torsion combination. Ocean Eng. 2023, 284, 115324. [Google Scholar] [CrossRef]
  10. Vu, Q.V.; Truong, V.H.; Thai, H.T. Machine learning-based prediction of cfst columns using gradient tree boosting algorithm. Compos. Struct. 2021, 259, 113505. [Google Scholar] [CrossRef]
  11. Faridmehr, I.; Nehdi, M.L. Predicting axial load capacity of cfst columns using machine learning. Struct. Concr. 2022, 23, 1642–1658. [Google Scholar] [CrossRef]
  12. Le, T.T. Practical machine learning-based prediction model for axial capacity of square cfst columns. Mech. Adv. Mater. Struct. 2022, 29, 1782–1797. [Google Scholar] [CrossRef]
  13. Hou, C.; Zhou, X.G. Strength prediction of circular cfst columns through advanced machine learning methods. J. Build. Eng. 2022, 51, 104289. [Google Scholar] [CrossRef]
  14. Systèmes, D. ABAQUS 6.14 Getting Started with Abaqus: Interactive Edition; Dassault Systèmes Simulia Corp.: Johnston, RI, USA, 2014. [Google Scholar]
  15. Hafezolghorani, M.; Hejazi, F.; Vaghei, R.; Jaafar, M.S.B.; Karimzade, K. Simplified damage plasticity model for concrete. Struct. Eng. Int. 2017, 27, 68–78. [Google Scholar] [CrossRef]
  16. Li, B.F.; Wang, X.T.; Lv, B.H.; Yan, X.F.; Yan, C.Z. Experimental study on torsional behavior of tapered high strength thin-walled concrete-filled double-skin steel tubular columns. Structures 2023, 55, 1823–1838. [Google Scholar] [CrossRef]
  17. Huang, H.; Han, L.H.; Tao, Z.; Zhao, X.L. Analytical behaviour of concrete-filled double skin steel tubular (cfdst) stub columns. J. Constr. Steel Res. 2010, 66, 542–555. [Google Scholar] [CrossRef]
  18. Esmaeily, A.; Xiao, Y. Behavior of reinforced concrete columns under variable axial loads: Analysis. ACI Struct. J. 2005, 102, 736. [Google Scholar]
  19. Shi, Y.; Wang, M.; Wang, Y. Experimental and constitutive model study of structural steel under cyclic loading. J. Constr. Steel Res. 2011, 67, 1185–1197. [Google Scholar] [CrossRef]
  20. Mander, J.B.; Priestley, M.J.N.; Park, R. Theoretical stress–strain model for confined concrete. J. Struct. Eng. 1988, 114, 1804–1826. [Google Scholar] [CrossRef]
  21. Dong, C.X.; Ho, J.C.M. Uni-axial behaviour of normal-strength cfdst columns with external steel rings. Steel Compos. Struct. 2012, 13, 587–606. [Google Scholar] [CrossRef]
  22. Pagoulatou, M.; Sheehan, T.; Dai, X.H.; Lam, D. Finite element analysis on the capacity of circular concrete-filled double-skin steel tubular (cfdst) stub columns. Eng. Struct. 2014, 72, 102–112. [Google Scholar] [CrossRef]
  23. Li, Z.; Lin, S.; Zhao, Y.G. Analytical model for concrete-filled double skin tube columns with different cross-sectional shapes under axial compression. Structures 2022, 43, 316–337. [Google Scholar] [CrossRef]
  24. American Concrete Institute. ACI 318-19: Building Code Requirements for Structural Concrete; American Concrete Institute: Indianapolis, IN, USA, 2019. [Google Scholar]
  25. Liang, Q.Q. Performance-based analysis of concrete-filled steel tubular beam-columns, part i: Theory and algorithms. J. Constr. Steel Res. 2009, 65, 363–372. [Google Scholar] [CrossRef]
  26. Liang, Q.Q.; Fragomeni, S. Nonlinear analysis of circular concrete-filled steel tubular short columns under axial loading. J. Constr. Steel Res. 2009, 65, 2186–2196. [Google Scholar] [CrossRef]
  27. Hu, H.T.; Huang, C.S.; Wu, M.H.; Wu, Y.M. Nonlinear analysis of axially loaded concrete-filled tube columns with confinement effect. J. Struct. Eng. 2003, 129, 1322–1329. [Google Scholar] [CrossRef]
  28. Tang, J.L.; Hino, S.; Kuroda, I.; Ohta, T. Modeling of stress–strain relationships for steel and concrete in concrete filled circular steel tubular columns. Kou Kouzou Rombunshuu 1996, 3, 35–46. [Google Scholar]
  29. Han, L.H.; Yao, G.H.; Tao, Z. Performance of concrete-filled thin-walled steel tubes under pure torsion. Thin-Walled Struct. 2007, 45, 24–36. [Google Scholar] [CrossRef]
  30. Simwanda, L.; Koker, N.D.; Viljoen, C.; Babafemi, A.J. Structural reliability of ultra-high-performance fiber reinforced concrete beams in shear. Struct. Concr. 2022, 244, 112767. [Google Scholar] [CrossRef]
  31. ISO 2394:2015; General Principles on Reliability for Structures. ISO: Geneva, Switzerland, 2015. [CrossRef]
  32. Vasudevan, S. Decision Trees; Taylor & Francis: Abingdon, UK, 2023; pp. 115–132. [Google Scholar] [CrossRef]
  33. Battula, B.; Krishna, K.; Kim, T. An efficient approach for knowledge discovery in decision trees using inter quartile range transform. Int. J. Control. Autom. 2015, 8, 325–334. [Google Scholar] [CrossRef]
  34. Lim, S.; Lee, H.; Song, S. Flow stress of Ti-6Al-4V during hot deformation: Decision tree modeling. Metals 2020, 10, 739. [Google Scholar] [CrossRef]
  35. Hong, Z.-T.; Wang, W.-D.; Zheng, L.; Shi, Y.-L. Machine learning models for predicting axial compressive capacity of circular cfdst columns. Structures 2023, 57, 105285. [Google Scholar] [CrossRef]
  36. Chen, D.; Montano, V.; Huo, L.; Song, G. Depth detection of subsurface voids in concrete-filled steel tubular (cfst) structure using percussion and decision tree. Measurement 2020, 163, 107869. [Google Scholar] [CrossRef]
  37. Kumar, K.v.B.; Kumar, S.M. Recognition of idleness among patients based on activity using random forest over decision tree algorithm. PNR 2022, 13, 1803–1808. [Google Scholar] [CrossRef]
  38. Arokiaprakash, A.; Selvan, S.S. Application of random forest and multi-layer perceptron anns in estimating the axial compression capacity of concrete-filled steel tubes. Iran. J. Sci. Technol. Civ. Eng. 2022, 46, 4111–4130. [Google Scholar] [CrossRef]
  39. Nguyen, T.-A.; Trinh, S.H.; Nguyen, M.H.; Ly, H.-B. Novel ensemble approach to predict the ultimate axial load of cfst columns with different cross-sections. Structures 2023, 47, 1–14. [Google Scholar] [CrossRef]
  40. Khan, S.; Khan, M.A.; Zafar, A.; Javed, M.F.; Aslam, F.; Musarat, M.A.; Vatin, N.I. Predicting the ultimate axial capacity of uniaxially loaded cfst columns using multiphysics artificial intelligence. Materials 2021, 15, 39. [Google Scholar] [CrossRef] [PubMed]
  41. Lee, S.; Vo, T.P.; Thai, H.-T.; Lee, J.; Patel, V. Strength prediction of concrete-filled steel tubular columns using categorical gradient boosting algorithm. Eng. Struct. 2021, 238, 112109. [Google Scholar] [CrossRef]
  42. Sebastiani, F.; Sperduti, A.; Valdambrini, N. An improved boosting algorithm and its application to text categorization. In Proceedings of the 2000 ACM CIKM International Conference on Information and Knowledge Management, McLean, VA, USA, 6–11 November 2000. [Google Scholar] [CrossRef]
  43. Tran, V.-L.; Thai, D.-K.; Kim, S.-E. Efficient framework for ultimate strength prediction and production-based CO2 emission optimization of cfst columns using categorical boosting algorithm and moth flame optimization. Compos. Struct. 2024, 333, 117943. [Google Scholar] [CrossRef]
  44. Chen, T.; Guestrin, C. Xgboost: A scalable tree boosting system. In Proceedings of the 22nd Acm Sigkdd International Conference on Knowledge Discovery and Data Mining, San Francisco, CA, USA, 13–17 August 2016; pp. 785–794. [Google Scholar]
  45. Cakiroglu, C.; Islam, K.; Bekdaş, G.; Isikdag, U.; Mangalathu, S. Explainable machine learning models for predicting the axial compression capacity of concrete filled steel tubular columns. Constr. Build. Mater. 2022, 356, 129227. [Google Scholar] [CrossRef]
  46. Zhou, X.-G.; Hou, C.; Peng, J.; Yao, G.-H.; Fang, Z. Structural mechanism-based intelligent capacity prediction methods for concrete-encased cfst columns. J. Constr. Steel Res. 2023, 202, 107769. [Google Scholar] [CrossRef]
  47. Momeni, M.; Hadianfard, M.A.; Bedon, C.; Baghlani, A. Damage evaluation of H-section steel columns under impulsive blast loads via gene expression programming. Eng. Struct. 2020, 219, 110909. [Google Scholar] [CrossRef]
  48. Franke, B.; Jean-François, P.; Ribana, R.; Annie, L.; Cathal, S.; Armin, H.; Fuqi, C.; Einat, G.; Alexander, S.; Alessandro, S.; et al. Statistical inference, learning and models in big data. Int. Stat. Rev. 2016, 84, 371–389. [Google Scholar] [CrossRef]
  49. Lundberg, S.M.; Lee, S.-I. A unified approach to interpreting model predictions. In Proceedings of the Conference on Advances in Neural Information Processing Systems 30, Long Beach, CA, USA, 4–9 December 2017. [Google Scholar]
  50. Bambach, M.R. Geometric optimisation and compression design of natural fibre composite structural channel sections. Compos. Struct. 2018, 185, 549–560. [Google Scholar] [CrossRef]
  51. Wang, H.; Jiang, L.; Xiang, P. Priority design parameters of industrialized optical fiber sensors in civil engineering. Opt. Laser Technol. 2018, 100, 119–128. [Google Scholar] [CrossRef]
Figure 1. Finite element meshes on C3D8R brick elements and boundary conditions.
Buildings 14 01040 g001
Figure 2. Mander’s [20] stress–strain model for confined concrete adopted in the NLFEA models of circular CFDST columns.
Buildings 14 01040 g002
Figure 3. Torsional behavior comparison between NLFEA predictions (dotted red lines) and experimental data (solid blue lines) for six CFDST columns. Subfigure (a) represents column CO11, (b) column CO12, (c) column CO21, (d) column CO22, (e) column CO31, and (f) column CO32, as investigated by Huang et al. [7].
Buildings 14 01040 g003
Figure 4. Probability density function (PDF) and histogram of T N L F E A values. The histogram represents the distribution of T N L F E A across computed models, while the PDF line (in red) indicates the probability density of these values. Key statistical metrics are marked: the minimum value (Min) in blue, the first quartile (Q25) in green, the median (Q50) in black, the third quartile (Q75) in purple, and the maximum value (Max) in orange.
Buildings 14 01040 g004
Figure 5. Spearman-Pearson correlation coefficient heat map between any two parameters of the database.
Buildings 14 01040 g005
Figure 6. Histogram representation for geometric parameters: (a) D o ; (b) t o ; (c) D i (d) t i and material parameters: (e) f y o ; (f) f y i ; and (g) f c u .
Buildings 14 01040 g006
Figure 7. General architecture of (a) Decision Tree: structure with decision nodes leading to leaf nodes, where the final decision is made. (b) Random Forest: an ensemble of decision trees T i ( X ; a i ) each trained on a bootstrapped sample of the training dataset X, with the collective output F ( X ) being the average of individual trees’ predictions. and (c) Boosting Algorithms (GBM, CatBoost & XGBoost): iterative process where each tree is trained on a bootstrap sample from the training dataset and contributes a weighted prediction Y i to the final model prediction Y which is the average of all individual predictions.
Buildings 14 01040 g007
Figure 8. Comparison of actual vs. estimated results for (a) Decision Tree, (b) Random Forest, (c) Gradient Boosting Machine, (d) CatBoost, (e) XGBoost ML models for the training, testing, and validation sets.
Buildings 14 01040 g008
Figure 9. Performance comparison among the different 5 ML models using (a) R 2 ; (b) RMSE; (c) MAE; and (d) MAPE.
Buildings 14 01040 g009
Figure 10. Comparison between the empirical-based equations of (a) Huang et al. [7] and (b) Lu et al. [4] and the two best performing ML models, that is (c) XGBoost and (d) CatBoost, using the entire dataset.
Buildings 14 01040 g010
Figure 11. Feature importance of the four different models based on mean absolute SHAP value.
Buildings 14 01040 g011
Figure 12. SHAP summary plot of the CatBoost model.
Buildings 14 01040 g012
Figure 13. SHAP dependency scatter interaction plots for (a) D o agsisnt f c u , (b) t o agsisnt f y o , (c) D i agsisnt f c u , (d) t i agsisnt f y o , (e) f y o agsisnt f c u , and (f) f y i agsisnt D i in the CatBoost model using the testing dataset.
Buildings 14 01040 g013
Figure 14. GUI representation of Python code for CatBoost algorithm for ease of use by lame engineers.
Buildings 14 01040 g014
Table 1. Material and geometrical parameters of the CFDST columns of Huang et al. [7].
D o t o D i t i f y o f y i f c u T u , e x p t T u , N L F E A T u , e x p t / T u , N L F E A
S/N(mm)(mm)(mm)(mm)(MPa)(MPa)(MPa)(kNm)(kNm)(-)
CO1I11653423260326.65024.625.520.96
CO1I21653755260355.45033.234.160.97
CO2I11654423286.4326.65032.331.641.02
CO2I21654755286.4355.45042.140.281.05
CO3I11654.6423355.4326.45048.842.51.15
CO3I21654.6755365.6355.45054.347.831.14
Mean 1.05
CoV 0.08
Table 2. Summary of equations for confined-concrete stress–strain relationships in CFDST columns.
DescriptionReference
σ c = f c c λ ε c ε c c λ 1.0 + ε c ε c c λ Mander et al. [20]
λ = E c E c f c c ε c c Mander et al. [20]
E c = 3320 γ c f c + 6900 MPa ACI 318 [24]
γ c = 1.85 D c 0.135 Liang [25]
f c c = γ c f c + k f r p Mander et al. [20]
ε c c = ε c 1 + 5 k f r p γ c f c c Mander et al. [20]
ε c = 0.002 for γ c f c 28 MPa 0.002 + γ c f c 28 54000 for 28 < γ c f c 82 MPa 0.003 for γ c f c > 82 MPa Liang and Fragomani [26]
f r p , s s = 0.7 ( ν e ν s ) 2 t e D o 2 t e σ 0.2 for D / t e 47 ( 0.006241 0.0000357 D t e ) σ 0.2 for 47 < D / t e 150 Hu et al. [27] and Tang et al. [28]
ν e = 0.2312 + 0.3582 ν e 0.1524 f c f s y + 4.843 ν e f c f s y 9.169 f c f s y 2 Tang et al. [28]
ν e = 0.881 × 10 6 ( D / t ) 3 2.58 × 10 4 ( D / t ) 2 + 1.953 × 10 2 ( D / t ) + 0.4011 Tang et al. [28]
σ c = β c f c c + ε c u ε c ε c u ε c c ( f c c β c f c c ) for ε c c < ε c ε c u β c f c c for ε c > ε c u Liang and Fragomani [26] and Hu et al. [27]
β c = 1.0 for D / t e 40 0.0000339 ( D / t e ) 2 0.0102285 ( D / t e ) + 1.3491 for 40 < D / t e 150 Hu et al. [27] and Tang et al. [28]
Table 3. Summary of parameters for the generation of 800 NLFEA models via parametric analysis.
D o [mm] t o [mm] D i [mm] t i (mm) f y o (MPa) f y i (MPa) f c u (MPa)n
1653423[200, 1000]326.65033
1653423260[200, 1000]5033
1653423260326.6[20, 200]37
1653755[200, 1000]326.65033
1653755260[200, 1000]5033
1653755260326.6[20, 200]37
1654423[200, 1000]326.65033
1654423260[200, 1000]5033
1654423260326.6[20, 200]37
1654755[200, 1000]326.65033
1654755260[200, 1000]5033
1654755260326.6[20, 200]37
1654.6423[200, 1000]326.65033
1654.6423260[200, 1000]5033
1654.6423260326.6[20, 200]37
1654.6755[200, 1000]326.65033
1654.6755260[200, 1000]5033
1654.6755260326.6[20, 200]37
400[3, 12]1913.183453456020
4009.3191[3, 12]3453456020
275[2, 12]1913.183453456020
2756.5191[2, 12]3453456020
2003503300460[20, 180]36
2003503300[200, 1000]4033
2003503[200, 1000]460-33
Total =800
Note: n = number of CFDST members.
Table 4. Summary of data collected from 6 tests conducted by Huang et al. [7] plus 800 NLFEA models in this work.
ParameterUnitMin. Q 25 Q 50 Q 75 Max.MeanStdCoV
D o mm114.00165.00165.00165.00400.00179.8843.980.24
t o mm2.003.004.004.6017.503.971.350.34
D i mm42.0042.0075.0075.00191.0068.3132.870.48
t i mm2.003.003.185.008.004.001.140.29
f y o MPa200.00260.00281.00375.001000.00376.56194.910.52
f y i MPa200.00326.60326.60345.001000.00393.38171.060.43
f c u MPa20.0050.0050.0060.00200.0065.8040.250.61
T N L F E A kNm15.0346.5488.49233.931050.00157.24155.990.99
Note: Min. = minimum; Q 25 = 25th percentile; Q 50 = 50th percentile; Q 75 = 75th percentile. Max. = maximum; Std = Standard deviation; CoV = coefficient of variation.
Table 5. Optimal hyperparameter setting for five ML models.
ML ModelHyperparametersDomainOptimal Value
DTmin_samples_split[1, 8]5
min_samples_leaf[1, 8]1
RFn_estimators[100, 500]150
min_samples_split[1, 8]2
min_samples_leaf[1, 4]1
max_features[sqrt, log2]log2
max_depth[10, 25]15
GBMn_estimators[100, 500]500
learning_rate[0.01, 0.4]0.05
min_samples_split[1, 4]2
min_samples_leaf[1, 4]1
CatBoostl2_leaf_reg[0.1, 1]1
learning_rate[0.01, 0.1]0.1
verbosebinary0
iterations[100, 500]300
depth[1, 10]4
XGBoostn_estimators[50, 300]150
learning_rate[0.01, 0.2]0.1
min_child_weight[0.1, 0.5]0.1
max_depth[1, 5]3
random_state[20, 30]20
reg_alpha[0.1, 1]0.1
reg_lambda[0.1, 1]0.5
Table 6. Performance metrics of the ML models.
ModelTraining SetTesting Set
R2MSERMSEMAER2MSERMSEMAE
CatBoost0.9987.034.916.830.97723.1410.9912.69
XGBoost0.99510.807.8911.330.97623.7313.14117.29
GBM0.9987.706.437.720.97225.4312.0014.87
RF0.9969.543.873.910.97225.6110.5310.06
DT0.99411.685.514.370.96727.8216.2412.91
Table 7. Summary of the currently available analytical formulas for predicting the torque–capacity of CFDST columns in pure torsion.
ReferenceTorque–Capacity
Huang et al. [7] T u c 2 = γ t W s c t τ s c y + W s i τ y i
T u = T s o + T c + T s i
τ s c y = ( 0.422 + 0.313 α n 2.33 ) ξ 0.134 f s c y
f s c y = C 1 χ 2 f y o + C 2 ( 1.14 + 1.02 ξ ) f c k
τ y i = 1 3 f y i
γ t = ( 0.22 χ + 0.273 ) ln ( ξ ) 0.133 χ + 1.29
C 1 = α 1 + α
C 2 = 1 + α n 1 + α
ξ = α n f y o f c k
α = A s o A c
W s c t = π ( D 4 d 4 ) 16 D
W s i = π ( d 4 ( d 2 t s i ) 4 ) 16 d
Lu et al. [4] T u = T s o + T c + T s i
T s o = 2 A s o , 0 t o τ s o
A s o , 0 = π ( D t o ) 2 4
τ s o = 1 α 2 3 f y o
α = 0.0928 χ 0.0272 / ξ 3 + 0.3356
χ = d D 2 t o
ξ 3 = f c A c f y o A s o + f y i A s i
T s i = 2 A s i , 0 t i τ s i
A s i , 0 = π ( d t i ) 2 4
τ s i = 1 β 2 3 f y i
β = 0.4982 χ + 0.0524 ξ 3 + 0.4012
T c = W p c τ c
W p c = π ( ( D 2 t o ) 3 d 3 ) 12
τ c = f t 1 + f c f t · σ c f c 1 0.8233 σ c f c 4.5
f c = 0.67 f c u
f t = 0.395 f c u 0.55
σ c / f c = α f y o A s o + β f y i A s i f c A c
A c = π ( D 2 t o ) 2 4 π d 2 4
Table 8. Comparison between analytical formulas and best two ML models.
Source R 2 MSERMSEMAE
Huang et al. [7]0.6724671157.0793.81
Lu et al. [4]0.7524897157.7995.86
XGBoost0.97297.0017.233.98
CatBoost0.98929.6230.4913.71
Table 9. Material and geometrical parameters of the CFDST case examples to check the extrapolation capabilities of CatBoost ML model.
D o t o D i t i f y o f y i f c u T u , N L F E A T u , C a t b o o s t T u , N L F E A /
T u , C a t b o o s t
S/N(mm)(mm)(mm)(mm)(MPa)(MPa)(MPa)(kNm)(kNm)(-)
15002025010120012002505992.0856781.055
25502530010120012002505753.7855671.034
360030250151200120025012,130.911,8981.020
465020300101200120025010,625.29856.81.078
570025350201200120025014,683.813,5671.082
675030450301200120025015,884.814,9801.060
Mean 1.055
CoV 0.021
Disclaimer/Publisher’s Note: The statements, opinions and data contained in all publications are solely those of the individual author(s) and contributor(s) and not of MDPI and/or the editor(s). MDPI and/or the editor(s) disclaim responsibility for any injury to people or property resulting from any ideas, methods, instructions or products referred to in the content.

