Article

Transmission Mechanism of Influencing Factors in the Promotion and Application of Whole-Process Engineering Consulting

1
China Construction Fifth Engineering Division Corp. Ltd., Changsha 410019, China
2
College of Systems Engineering, National University of Defense Technology, Changsha 410073, China
*
Author to whom correspondence should be addressed.
Buildings 2024, 14(6), 1570; https://doi.org/10.3390/buildings14061570
Submission received: 22 April 2024 / Revised: 19 May 2024 / Accepted: 23 May 2024 / Published: 28 May 2024
(This article belongs to the Section Construction Management, and Computers & Digitization)

Abstract

:
As a project construction organization model, whole-process engineering consulting (WPEC) is currently being promoted in China’s engineering consulting industry. However, various factors create numerous obstacles that hinder this model’s effective promotion and application. One essential task is to deeply analyze the transmission mechanism of the influencing factors in the promotion and application of WPEC, and explore effective pathways for promoting and applying this model. This paper systematically organizes and summarizes 10 primary influencing factors and 38 secondary influencing factors for promoting WPEC. Using the complex network analysis method, a network of influencing factors for promoting WPEC, a network structure, and motif analyses are conducted. The results show that the influencing factors have a complex transmission mechanism, and complex network analysis can reveal the laws of their construction and their causes. This paper provides a systematic basis and theoretical support for the effective formulation of policies related to the promotion and application of WPEC.

1. Introduction

The construction industry is a vital sector supporting national economic development. In the current downturn of the construction market, competition among construction engineering companies has intensified. This has led to a challenging balance between project construction quality and efficiency, resulting in increased risks for construction projects. Additionally, with the diversification and sophistication of client demands, traditional engineering consulting service models, characterized by fragmentation and discontinuity, can no longer meet these demands, leading to growing contradictions that have hindered the healthy and sustainable development of the engineering consulting industry [1]. In response to these challenges, the Chinese government has begun to implement the whole-process engineering consulting model in the construction sector, drawing on international practices.
The whole-process engineering consulting (WPEC) model, as a new construction organization model, differs from the traditional engineering consulting service model. WPEC refers to intellectual service activities in which consultants comprehensively apply multidisciplinary knowledge, practical engineering experience, modern science and technology, and economic management to provide partial or overall solutions for clients in investment decision-making, construction, and even the operation and maintenance stages of engineering projects. WPEC includes comprehensive investment decision consulting, whole-process construction consulting, project operation, and maintenance consulting, and cross-stage consulting service combinations, or different types of consulting service combinations within the same stage, to meet diverse market demands [2]. At the inception of the WPEC model, there were varied interpretations among government departments, construction units, and consulting firms, which led to obstacles in its implementation. Addressing practical issues, the government has continuously introduced policies to improve WPEC service standards. To promote and implement WPEC, the government has employed various approaches such as pilot areas, enterprises, and projects. However, due to inadequate policy and regulatory support, and insufficient understanding from tendering supervision organizations and construction units, there are significant obstacles to fully implementing WPEC. There is an urgent need to analyze the influencing factors in the promotion and application of WPEC and to explore effective paths for construction and consulting units to adopt this model.
The impact factors of promoting the application of WPEC have primarily been discussed qualitatively, based on experience in both the engineering and academic fields. For instance, Huang et al. [3] qualitatively discussed the problems and shortcomings in developing and promoting WPEC based on policy analysis and multi-project statistics. Similarly, Zhang [4] and Zhou et al. [5] provided improvement suggestions after qualitatively analyzing the obstacles in implementing the WPEC model. Moreover, analyses have been conducted on the problems and challenges faced by PPP (public–private partnership, a project financing model in public infrastructure where the government introduces private capital to participate in the investment and operation of urban infrastructure and other public welfare undertakings through pre-established profit-sharing rules such as franchise rights, reasonable pricing, and financial subsidies; this model, characterized by shared benefits and risks, improves the quality and efficiency of public products or services, facilitates the transformation of government functions, reduces fiscal burdens, and promotes the diversification of investment entities) project management [6], power grid projects, and construction projects [7,8] in carrying out WPEC. Although qualitative analysis at the experiential level offers an understanding of the factors affecting the application of the WPEC model, it falls short of scientifically and effectively uncovering the underlying complex correlations.
Therefore, there is a need for quantitative analysis models to deeply explore the influencing factors and their interrelationships in the application of the WPEC model. To date, only a few studies have conducted in-depth analyses using quantitative methods. For example, Xie [9] used the DEMATEL method (decision-making trial and evaluation laboratory, a method that uses graph theory and matrix tools for systematic element analysis; this method can use matrix operations to determine the causal relationships and impact strengths between factors; by visualizing these causal relationships, it reveals the key influencing factors and their degrees of influence in complex problems; however, this method cannot effectively identify the hierarchical structure of factors within the system) to study 16 factors affecting the application of WPEC. The results showed that the lack of practical experience with new consulting models, the immaturity of new consulting models, and a poor ability in terms of learning new technologies and knowledge are key factors limiting the application of WPEC in the construction industry. Xu et al. [10] applied the ISM method (interpretative structural modeling, a method that decomposes complex systems into several subsystems (factors or elements) and analyzes their direct binary relationships; it constructs multi-level hierarchical directed topology graphs based on Boolean algebra operations; however, this method cannot determine the degree of influence of the elements on the system) to analyze 22 obstructive factors in implementing the WPEC model. The results showed that unclear division of responsibilities and powers, inaccurate corporate positioning, and low owner recognition are the most direct obstacles, while government and industry factors have profound hindering effects on the development of WPEC. Hu et al. [11] combined the DEMATEL and ISM methods to analyze the influencing factors of WPEC’s application. Their results indicated that insufficient policy support and the scarcity of compound talents are fundamental causes, while unclear user demands, immature new consulting models, and insufficient capability of enterprises to provide integrated engineering consulting services are transitional causes. Uncertain commissioning methods and service types and scopes, imperfect contract templates, and technical standards, unclear consulting service remuneration calculation methods, and the lack of consulting process supervision and resulting evaluation systems are superficial causes. These studies mainly used the DEMATEL and ISM methods as quantitative analysis tools to examine the factors affecting the application of the WPEC model, providing a theoretical basis for a deeper understanding of these factors. However, they lack research on the transmission mechanism of the influencing factors in the widespread application of WPEC. Understanding the transmission mechanism of these influencing factors can reveal their interrelations and transmission laws, offering a systematic basis for formulating effective policies and strategies for their promotion and application. Therefore, there is an urgent need to study the transmission mechanism of factors influencing the popularization and application of WPEC.
The complex network analysis method falls within the scope of network science and is an effective tool for studying complex systems theory, as well as forming the basis for current graph neural networks. It characterizes complex systems through their network topology and the attributes of nodes and edges, studying their structural features and dynamical laws to deeply reveal the internal and external relationships and evolutionary rules among the various elements of complex systems. For example, Bürger et al. [12] viewed the collaborative knowledge production of Wikipedia as a complex system and used complex network analysis methods to study its dynamic conflict issues. Völker et al. [13] employed complex network analysis to investigate changes in social networks during the COVID-19 crisis in the Netherlands and their relationship with perceived loneliness among young and older groups. Aerne et al. [14] applied complex network analysis to study prestige issues in social dilemmas arising from cooperation among art institutions in Bogotá. Zhang et al. [15] explored the relationship between network capital, developmental innovation, and exploratory innovation from the perspective of network dynamics. Given the complexity of the interrelationships between the influencing factors of WPEC promotion and application, they can be viewed as a system interconnected through relationships and influence propagation, contributing to the system’s complexity. Based on this, Huang et al. [16] conducted a study on the factors influencing the promotion and application of WPEC, using complex network analysis methods to explore the influencing factors and their transmission mechanisms. However, the study on transmission mechanisms was overly simplistic and lacked in-depth analysis at the rule level. This made it difficult to theoretically enhance the understanding of the complex transmission mechanisms among the influencing factors and to support the effective formulation of policies for the promotion of WPEC.
Therefore, to promote the application of the WPEC model and to provide systematic evidence and theoretical support for the effective formulation of relevant promotion policies, this paper addresses the current research deficiencies on influencing factors and transmission mechanisms. Based on the data from Huang et al. [16], this paper uses the complex network analysis method to deeply investigate and analyze the transmission mechanisms among the factors influencing the promotion and application of WPEC. It should be noted that Huang et al. [16] studied only the node characteristics, network centrality, and block models of the influencing factors using the complex network analysis method. The main innovations and contributions of this paper, in contrast to Huang’s work, include:
(1) Key concepts such as influence flow, influence magnitude, potential differences in influence, influence output sources, and influence receptors are proposed. Using complex network analysis methods, a network of factors influencing the promotion and application of WPEC is constructed, and based on the extent of influence, it is transformed into three binary networks.
(2) For the binary networks of factors influencing the promotion and application of WPEC, analyses are conducted on node in-degree and out-degree and their differences, correlations of node degree values, and motif analysis.
(3) The transmission mechanisms and their causes for the factors influencing the promotion and application of WPEC are explored from the level of network’s construction law.

2. Methodology

2.1. Research Framework

To address the transmission mechanism issue of influencing factors for the promotion of WPEC, this paper first establishes a classification framework for these factors. Based on this framework, the influencing factors for the promotion and application of WPEC are identified. Subsequently, an influencing factor network for the promotion and application of WPEC is constructed and converted into three binary networks based on edge weights. Using complex network analysis methods, this paper conducts node in-degree and out-degree difference analysis, node degree correlation analysis, and motif analysis to reveal the transmission mechanisms and the causes of these influencing factors, and proposes strategies for policy formulation for the promotion of and application of WPEC. The research framework of this paper is shown in Figure 1.

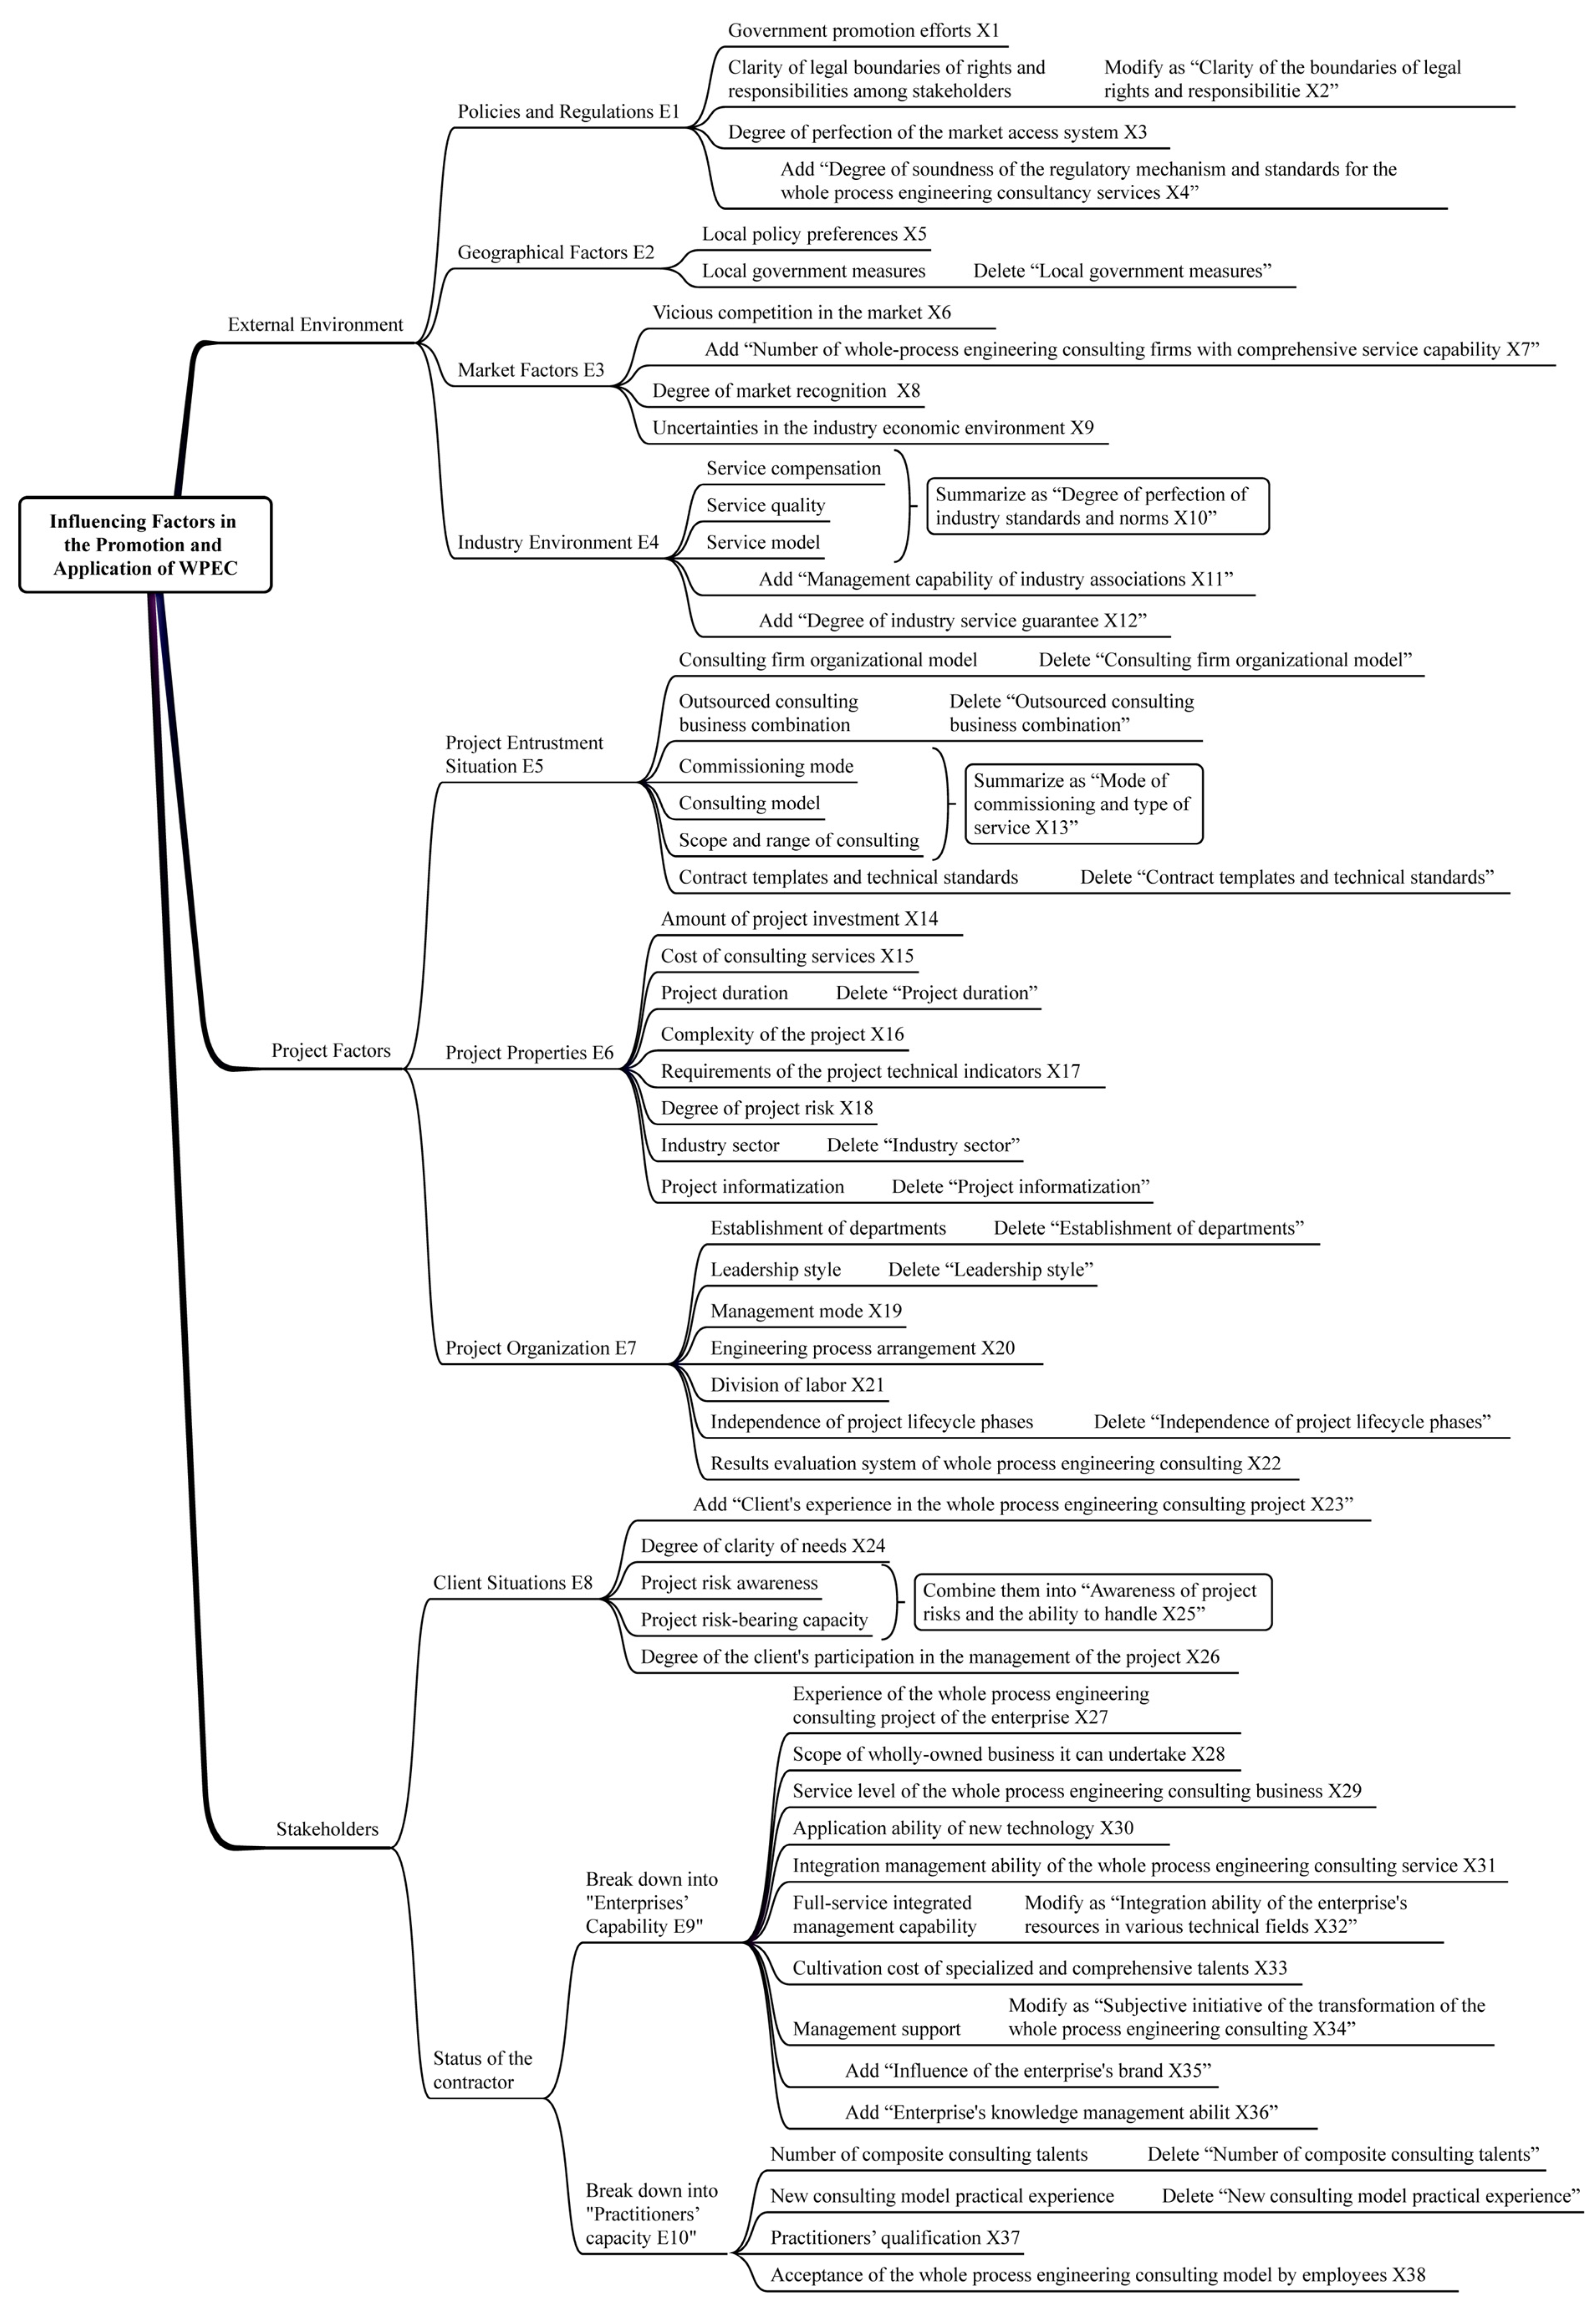
2.2. Identification of Influencing Factors in the Promotion and Application of WPEC

To appropriately identify the factors influencing the application and promotion of WPEC, based on the results of the literature research [9,10,11] and the needs of the study, this paper has established a classification framework for the factors influencing the application and promotion of WPEC, namely the “External Environment-Project Factors-Stakeholders” framework. Using this framework, this paper preliminarily identified the influencing factors of WPEC, which include 11 external environmental factors, 21 project factors, and 16 stakeholder factors.
The rationality of the factors, identified in the preliminary screening, needs to be assessed. For this purpose, ten experts in the field of WPEC were invited to evaluate the rationality of these initially selected factors using the Delphi method and revisions were made based on their feedback. The revised factors for WPEC include 12 external environmental factors, 10 project factors, and 16 stakeholder factors, as shown in Figure 2.
Regarding the revised factors influencing WPEC, 120 survey questionnaires were further distributed to industry experts in the consulting sector (Refer to Appendix A). The primary objectives were twofold. On the one hand, to assess whether the revised factors influencing the promotion and application of WPEC are recognized by peers in the industry; on the other hand, to gather insights from industry experts on the relationships between these influencing factors and their intensities, which are crucial for constructing the network of factors influencing the promotion and application of WPEC.
It is important to note that, in the survey questionnaires distributed to industry experts, this paper employed a Likert five-point scale to assess the degree of agreement with the factors influencing the promotion and application of WPEC. This paper further required the industry experts to evaluate the degree of interrelation among various influencing factors, including no influence, weak influence, moderate influence, and strong influence. Based on this, this paper analyzed the validity of the survey data using SPSS (version 10.0) software. The results showed that among the 120 questionnaires distributed, the industry experts reached a level of “comparative agreement” with the identified factors influencing WPEC. For more detailed information on the identification and validation process of these factors, please refer to the literature [16].

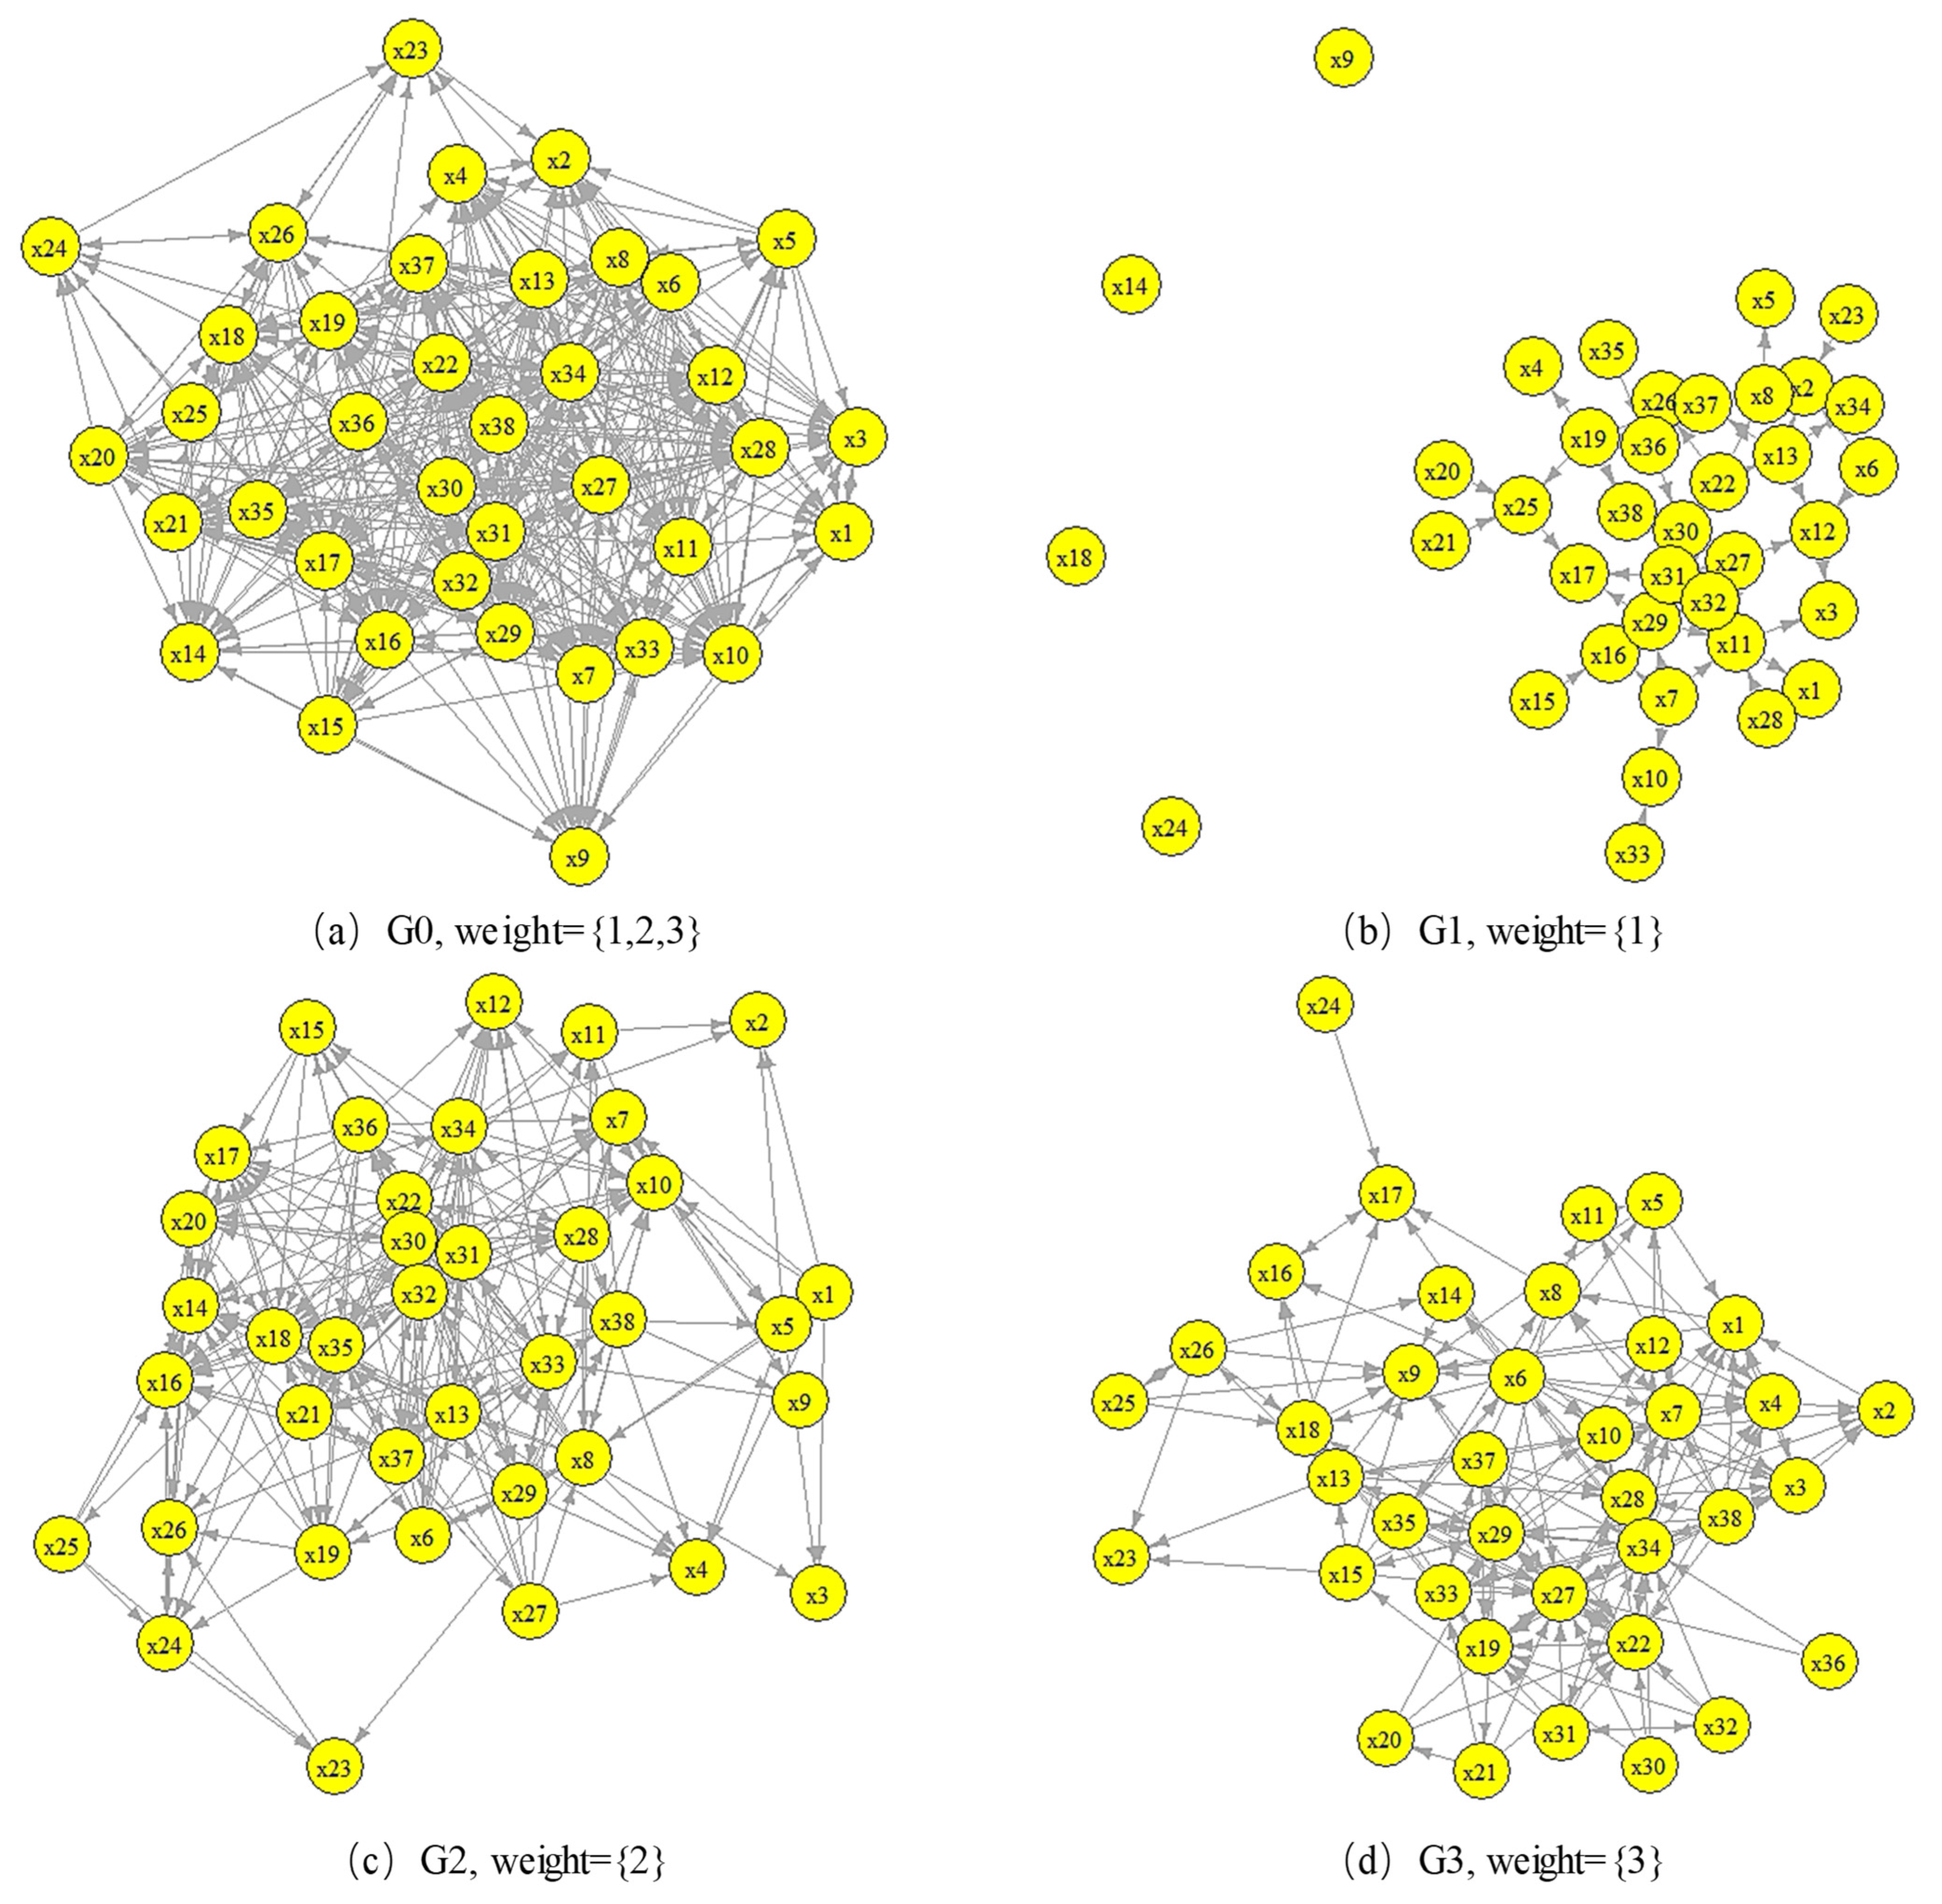
2.3. Network Construction

(1) Complex network and adjacency matrix
A complex network consists of nodes and edges, generally represented as G ( V , E ) . Here, V = { v 1 , v 2 , , v N } is the set of nodes and E = { e 1 , e 2 , , e M } is the set of edges. The edges can be either directed or undirected, and they may or may not have weights. The set of edge weights is denoted by W . For computational convenience, complex networks are commonly represented by an adjacency matrix A = ( a i j ) N × N , which is an N order square matrix. The elements of this matrix are defined as a i j :
a i j = w i j ,   i f   nodes   i   and   j   have   connected   edges   between   them   with   weights   w i j 0 ,   otherwise
In the case of a weighted network, the weights need to be defined according to the subject of study. Moreover, the network can be converted into an unweighted network through binarization, where the elements of the adjacency matrix include only 0 and 1, with 1 indicating the presence of an edge between two nodes and 0 indicating the absence of an edge.
(2) Influencing factor network for the promotion and application of WPEC
Due to the mutual influence among the factors affecting the promotion and application of WPEC, these factors were modeled as a complex network to study their interrelationships and the transmission of influence. Based on the influencing factors identified, this paper used the results of the association degree evaluation between the influencing factors from the survey questionnaire in Section 2.2 as the data to construct an influencing factor network for the promotion and application of WPEC. These data formed an adjacency matrix, where the matrix elements represent the edge weights between the influencing factors, with four possible values: no influence (0), weak influence (1), moderate influence (2), and strong influence (3), indicating different degrees of influence among the factors in the promotion and application of WPEC.
From this adjacency matrix, a directed weighted influencing factor network for the promotion and application of WPEC was constructed. For the analysis of this adjacency matrix and the overall structure of the network can be referred to in the literature [16]. Unlike the literature [16], the focus of this paper is to divide the influencing factor network for the promotion and application of WPEC into three sub-networks according to the differences in the weights of the connecting edges, to provide a more in-depth analysis of the transmission mechanism of the influencing factors in the promotion and application of WPEC. In this network, the edges between nodes are defined as influence flows, the direction of the edges as the direction of the influence flow, and the edge weight as the degree of influence. The difference in strength between two nodes is defined as the influence potential difference. Influence transmission between factors manifests as a flow driven by the influence potential difference, moving through the influencing factor network, with a transmission strength measured by the degree of influence. Moreover, if a node in a network has a higher out-degree than in-degree, it is defined as an influence output source; conversely, if a node’s in-degree exceeds its out-degree, it is defined as an influence receiver.
To further reveal the transmission mechanism of influencing factors in the promotion and application of WPEC with different weights (degrees of influence), the directed weighted network will binarized into 0-1 binary networks based on different weights, resulting in three binary networks of factors influencing WPEC promotion and application. The G1 network corresponds to a weight of 1 (weak influence), the G2 network to a weight of 2 (moderate influence), and the G3 network to a weight of 3 (strong influence), as shown in Figure 3.

2.4. Network Structure Analysis

(1) Degree
In directed networks, node degrees are classified into three types: k i a l l , k i i n , and k i o u t . k i a l l representing the total number of edges connected to the network node i , which is expressed as k i a l l = j N , j i A i j + j N , j i A j i . The in-degree is the scenario, where a node serves as a receiver of network flow, is defined as the number of edges directed towards that node, meaning the sum of the elements in column G equals the in-degree of node i , noted as v i . The out-degree indicates the situation where a node acts as a source, sending out network flow, defined as the number of edges from that node to other nodes in the network, so the sum of the elements in row k i i n = j N , j i A j i equals the out-degree of node v i , noted as k i o u t = j N , j i A i j . It is important to define the network flow based on the research subject.
(2) Motifs
Motifs are small-scale subgraphs in complex networks characterized by high-frequency features, reflecting the micro-level operational patterns on which network formation and evolution depend [17]. Figure 4 shows the form and numbering of a directed subgraph composed of three nodes, which represent three-node motifs. The forms and numbering of four-node motifs and higher-order motifs can be found in the literature [18].
Motif discovery primarily involves three steps: random network modeling, subgraph search, and motif evaluation [18]. Random network modeling mainly consists of generating random networks corresponding to the real network to determine if subgraphs in the real network are motifs. Subgraph search involves searching for subgraphs of specific sizes and connection patterns in both the real and corresponding random networks and merging them into isomorphic subgraphs. Motif evaluation is about determining the significance of subgraphs as motifs, typically by comparing them with random networks to calculate the subgraph’s Z value, thereby conducting a statistical significance analysis, which is:
Z i = ( N r e a l i N r a n d i ) / s t d ( σ r a n d i )
In this context, N r e a l i represents the number of times subgraph i appears in the real network, while N r a n d i and s t d ( σ r a n d i ) , respectively, denote the average number of occurrences and standard deviation of subgraph i in random networks.
For the significance evaluation of the subgraph value Z , there are three standards [18]:
➀ The probability that subgraph i appears more frequently in random networks than in the real network is very small, such as less than a certain threshold P = 0.01 ;
➁ The number of times the subgraph appears in the real network as an independent subgraph with no node or edge overlap— N r e a l i should not be less than a certain lower limit, like U = 3 ;
➂ The number of occurrences of the subgraph in the real network— N r e a l i should be significantly higher than its occurrences in random networks N r a n d i , for instance, greater than ( N r e a l i N r a n d i ) > 0.1 N r a n d i .
To identify the modes of influence transmission under weak, moderate, and strong influence levels, and to determine if there are significant differences in the frequency of these transmission modes across the various factors influencing the promotion and application of WPEC, this paper conducted a motif analysis of the G1, G2, and G3 networks using FANMOD [19], which is a tool for network motif detection that implements a novel algorithm called RAND-ESU to enumerate and sample subgraphs.

3. Results

Based on the method of network’s construction described in Section 2.2, this paper constructed the influencing factor network for the promotion and application of WPEC and three binary networks, as shown in Figure 3. The following sections will explain the results of the node in-degree and out-degree difference analysis, node degree correlation analysis, and motif analysis of these networks using complex network analysis methods.

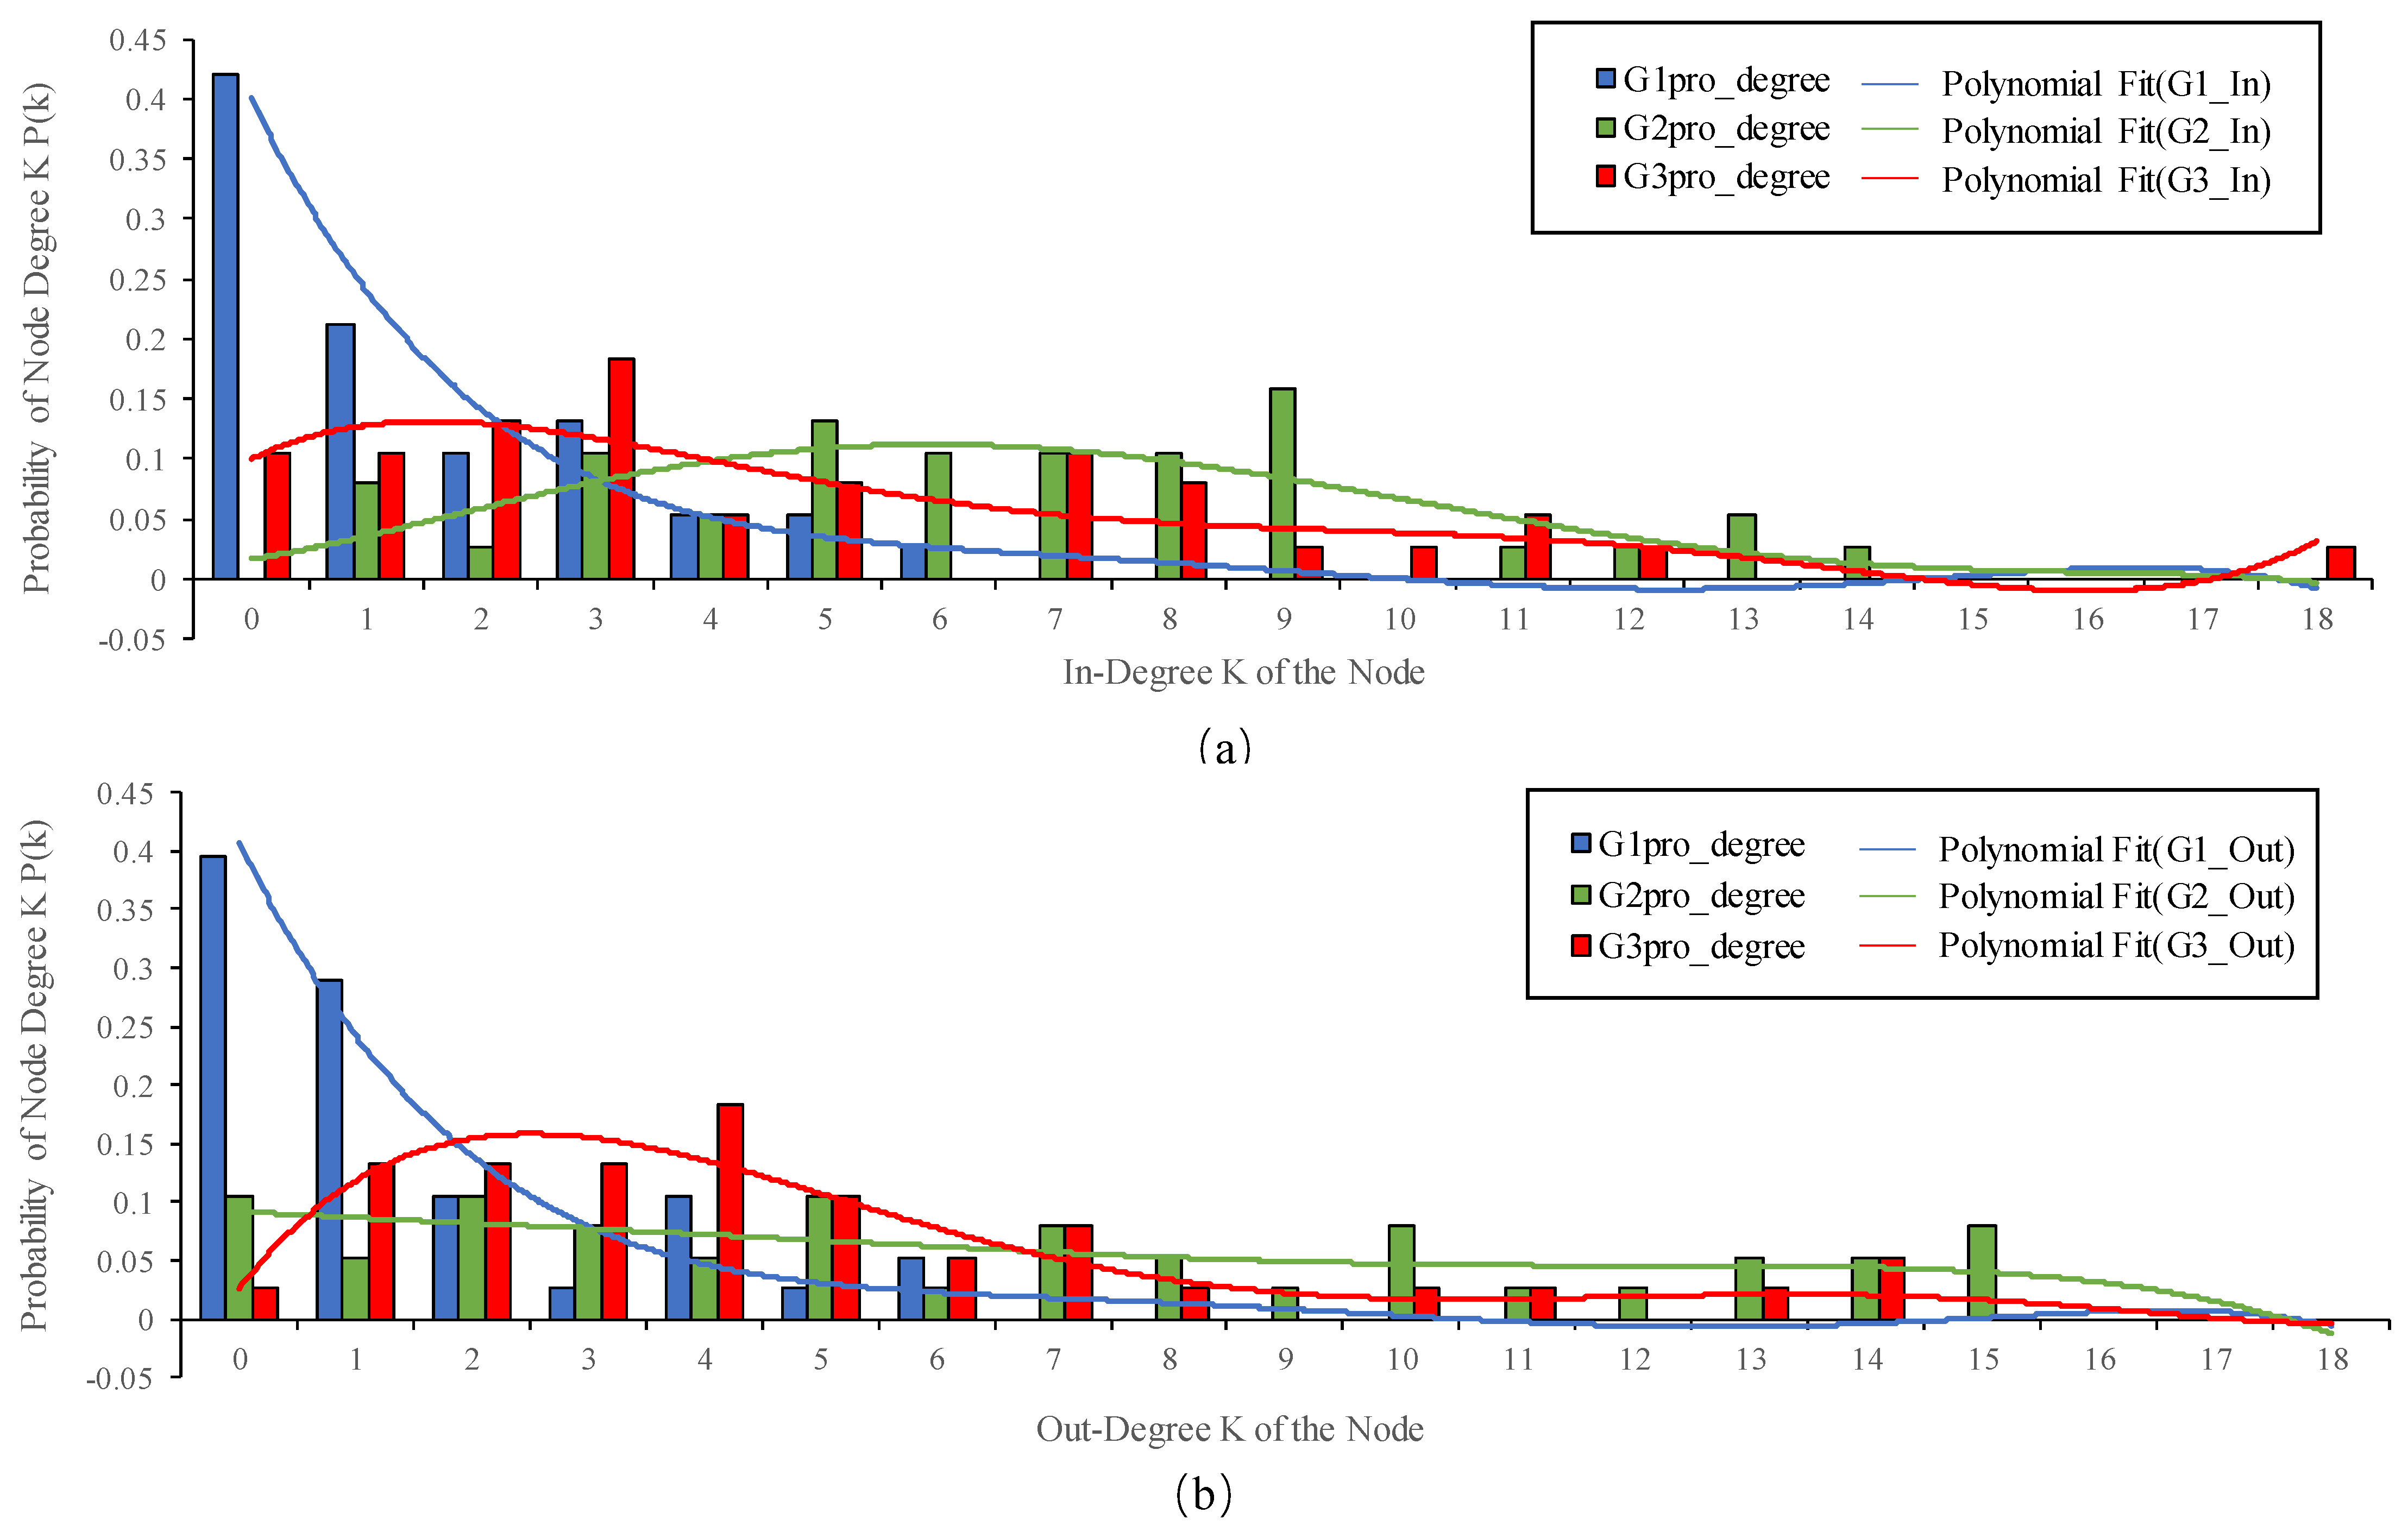
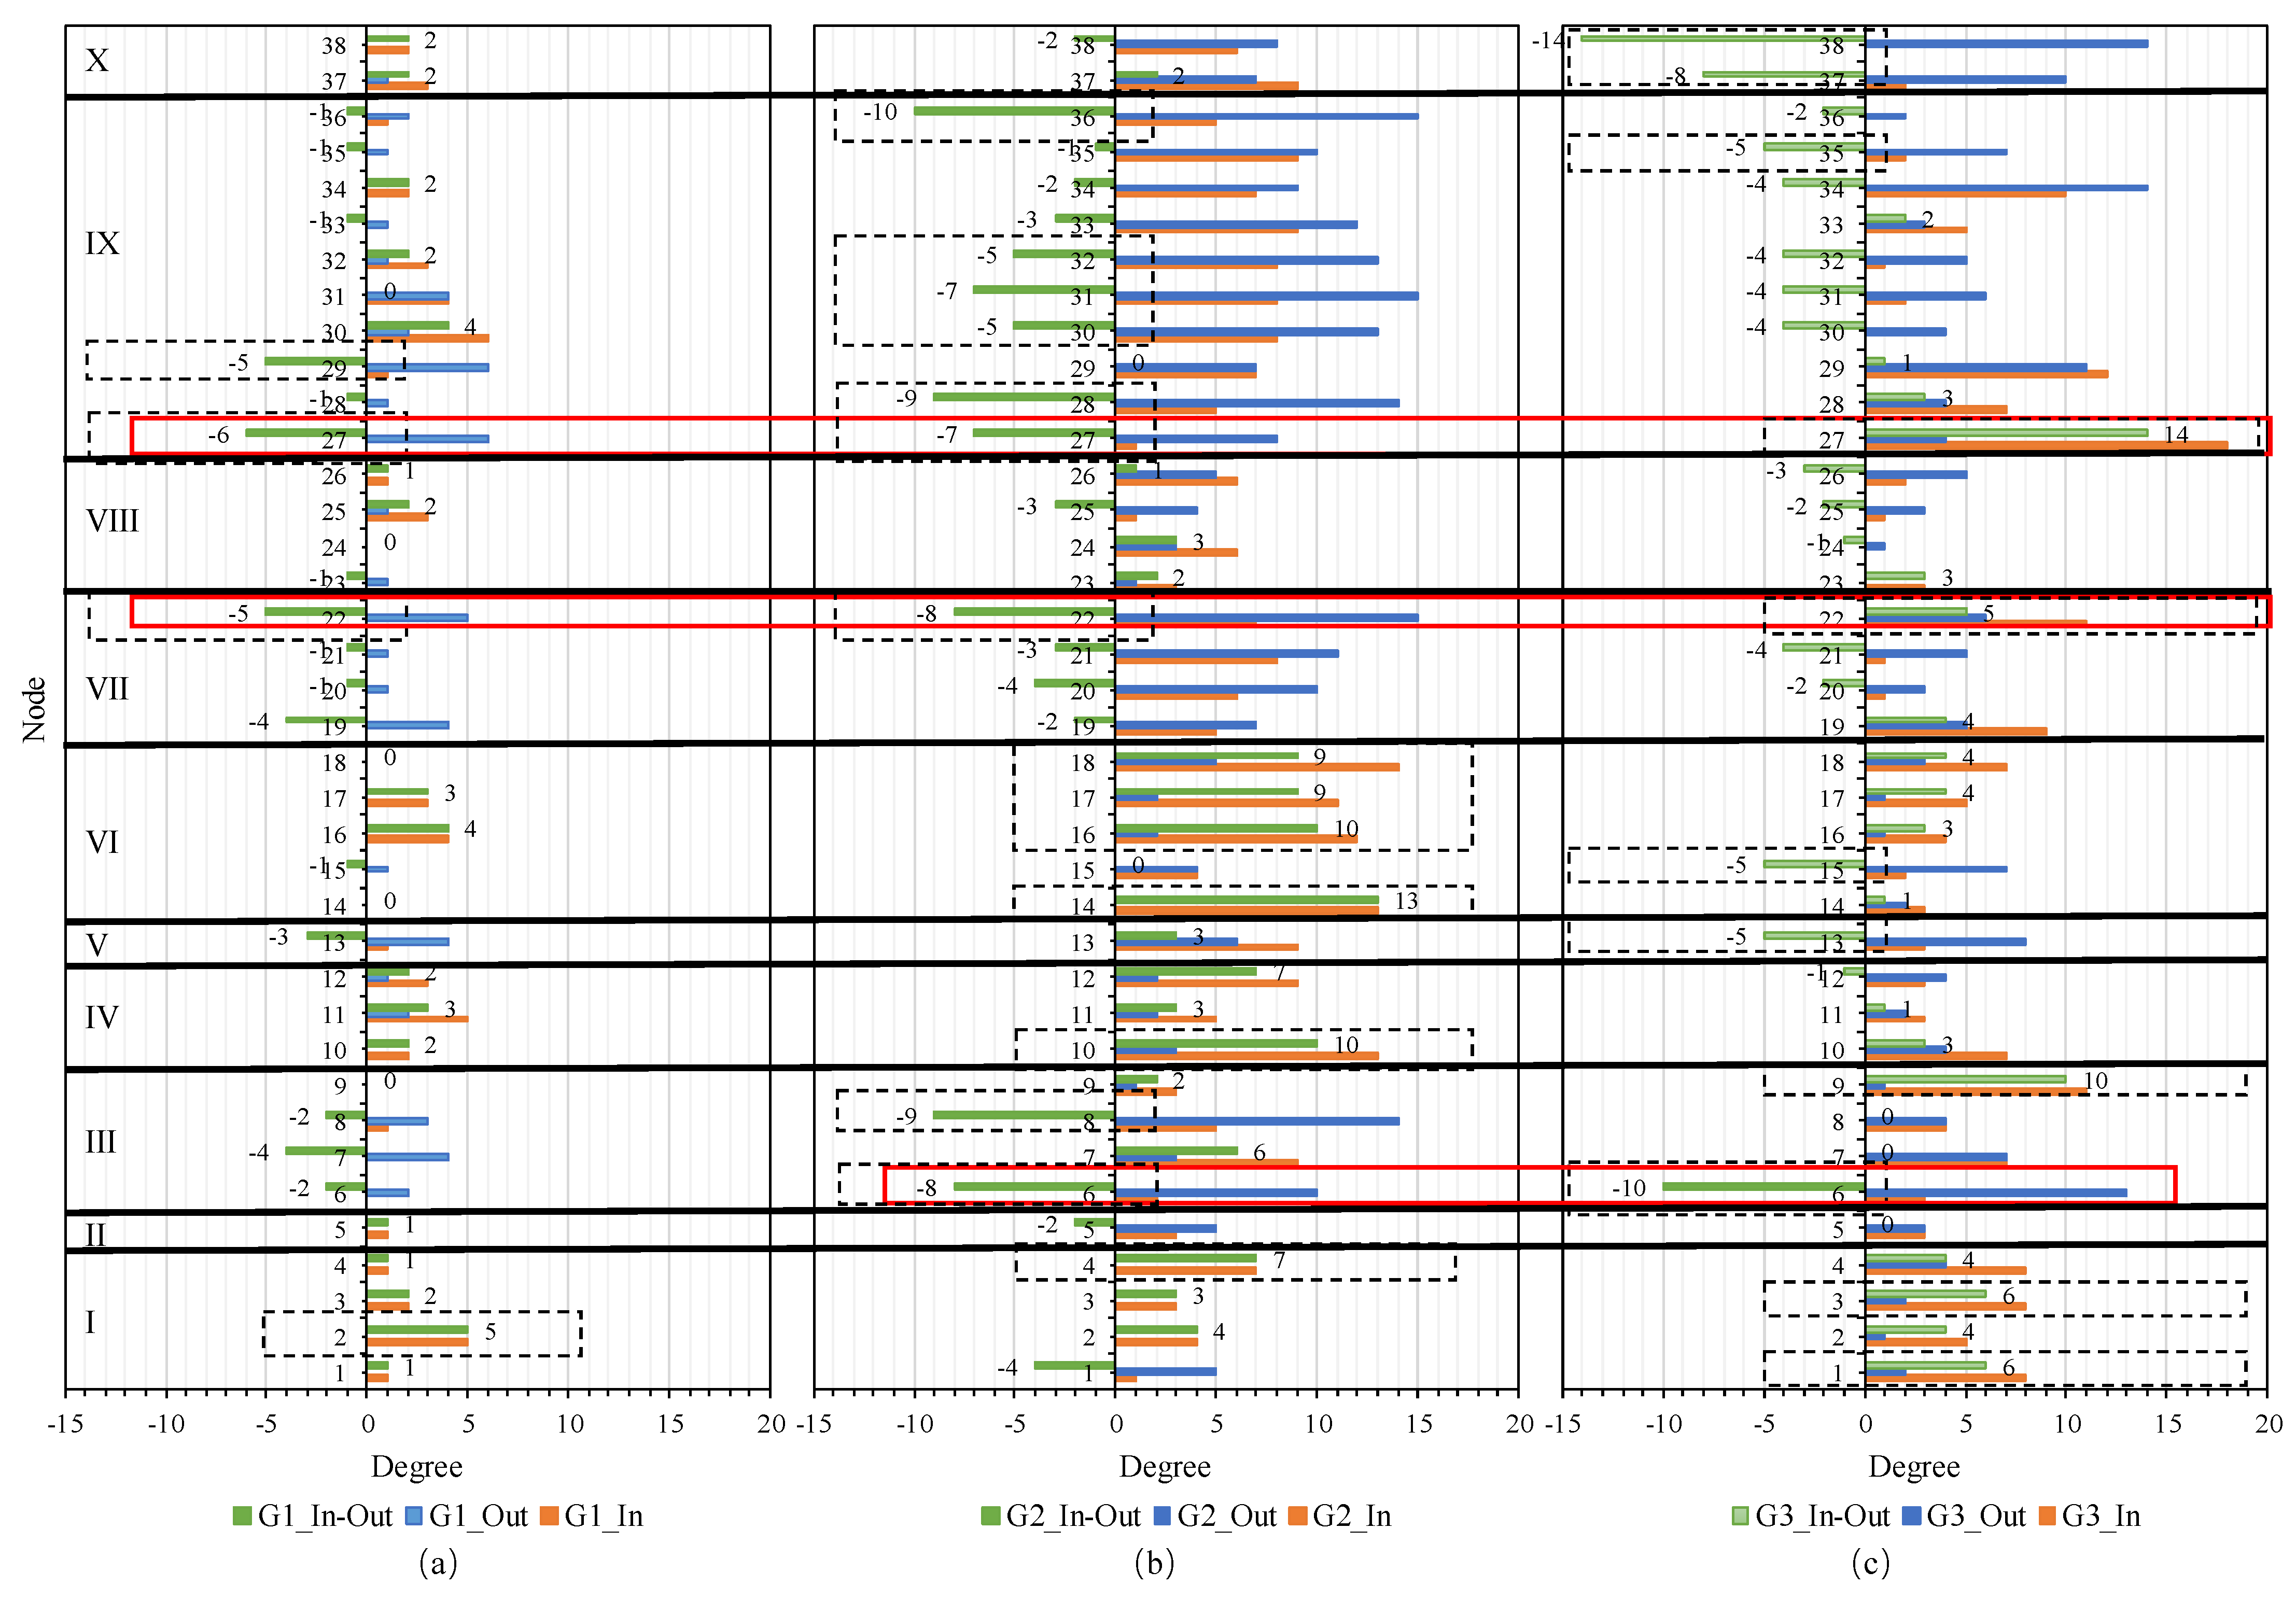
3.1. Node In-Degree, Out-Degree, and Difference Analysis

Based on the binary network, the first step was to analyze the distribution of in-degrees and out-degrees of nodes in the three networks of influencing factors for the promotion and application of WPEC, as shown in Figure 5.
It is evident that, for both in-degrees and out-degrees, there are significant differences in the influence flows between the various influencing factors in the promotion and application of WPEC at different levels of influence. In the G1 network, the degree distribution mainly concentrates in the lower degree area, indicating that at a weak influence level, the influence flows between the various influencing factors in the promotion and application of WPEC are not active, and the interconnections between different factors are relatively low. In contrast, the degree distributions in the G2 and G3 networks are primarily in the higher degree area, suggesting that at moderate and strong influence levels, the influence flows among the factors are more active, and the degree of interconnection between the different factors is higher. This indicates a positive correlation between the influence flows among the influencing factors and their degree values, meaning that the larger the node’s degree value, the greater its degree of influence. Therefore, degree value can be correlated with influence degree, considering nodes with larger degree values as having significant influence transmission capabilities. By controlling these nodes, strategies and recommendations for the promotion and application of WPEC can be formulated.
To analyze the influence of each factor in the promotion and application of WPEC in greater detail, this paper compared the in-degree, out-degree, and their differences for each node in the three binary networks, as shown in Figure 5. Using a difference of five as a threshold: for the G1 network, the set of influencing factors with the largest difference between in-degree and out-degree is {x2, x22, x27, x29}; for the G2 network, it is {x4, x6, x8, x10, x14, x16, x17, x18, x22, x27, x28, x30, x31, x32, x36}; and for the G3 network, it is {x1, x3, x6, x9, x13, x15, x22, x27, x35, x37, x38}.
The influencing factors are divided according to the primary influencing factors as shown in Figure 2, where x1 to x4 are in Area I, x5 in Area II, x6 to x9 in Area III, x10 to x12 in Area IV, x13 in Area V, x14 to x18 in Area VI, x19 to x22 in Area VII, x23 to x26 in Area VIII, x27 to x36 in Area IX, and x37 to x38 in Area X. From the distribution of influencing factors with the largest difference in in-degree and out-degree, the G1, G2, and G3 networks show complementary regional characteristics, as indicated by the dashed lines in Figure 5. Additionally, three influencing factors overlap across the G1, G2, and G3 networks. It is important to note that the overlapping factors with the largest differences in in-degree and out-degree are significant, as they exhibit prominent differences in the binary networks corresponding to different weights. For example, x22 and x27 are part of the set of factors with the largest difference in both in-degree and out-degree across all three networks, acting as influence receivers under weak and moderate influence levels, and as influence sources under strong influence. Meanwhile, x6 appears in both the G2 and G3 networks as part of the set with the largest difference, acting as an influence receiver under both moderate and strong influence levels.
From the complementary and overlapping regions in Figure 6, it is evident that the roles of different influencing factors as influence sources and receivers vary with the level of influence, and there is a phenomenon of cross-regional influence flow. For weak influence, factors in Area I primarily act as influence receivers, while those in Areas VII and IX mainly serve as influence sources, with influence flows predominantly moving from Areas VII and IX to Area I. For moderate influence, factors in Areas I, IV, and VI mainly serve as influence receivers, while those in Areas III, VII, and IX act as influence sources, with flows mainly moving from Areas III, VII, and IX to Areas I, IV, and VI. In terms of strong influence, factors in Areas I and VII act as influence receivers, while those in Areas V, VI, and X serve as influence sources, with Areas III and IX having factors that serve as both sources and receivers, directing influence flows mainly from Areas V, VI, X, and Area III’s x6 and Area IX’s x35 to Areas I, VII, and Area III’s x9 and Area IX’s x27. Furthermore, Areas II and VIII do not have factors with the largest differences in in-degree and out-degree, indicating that the influencing factors in these areas do not play a significant role in influence transmission.

3.2. Node Degree Value Correlation Analysis
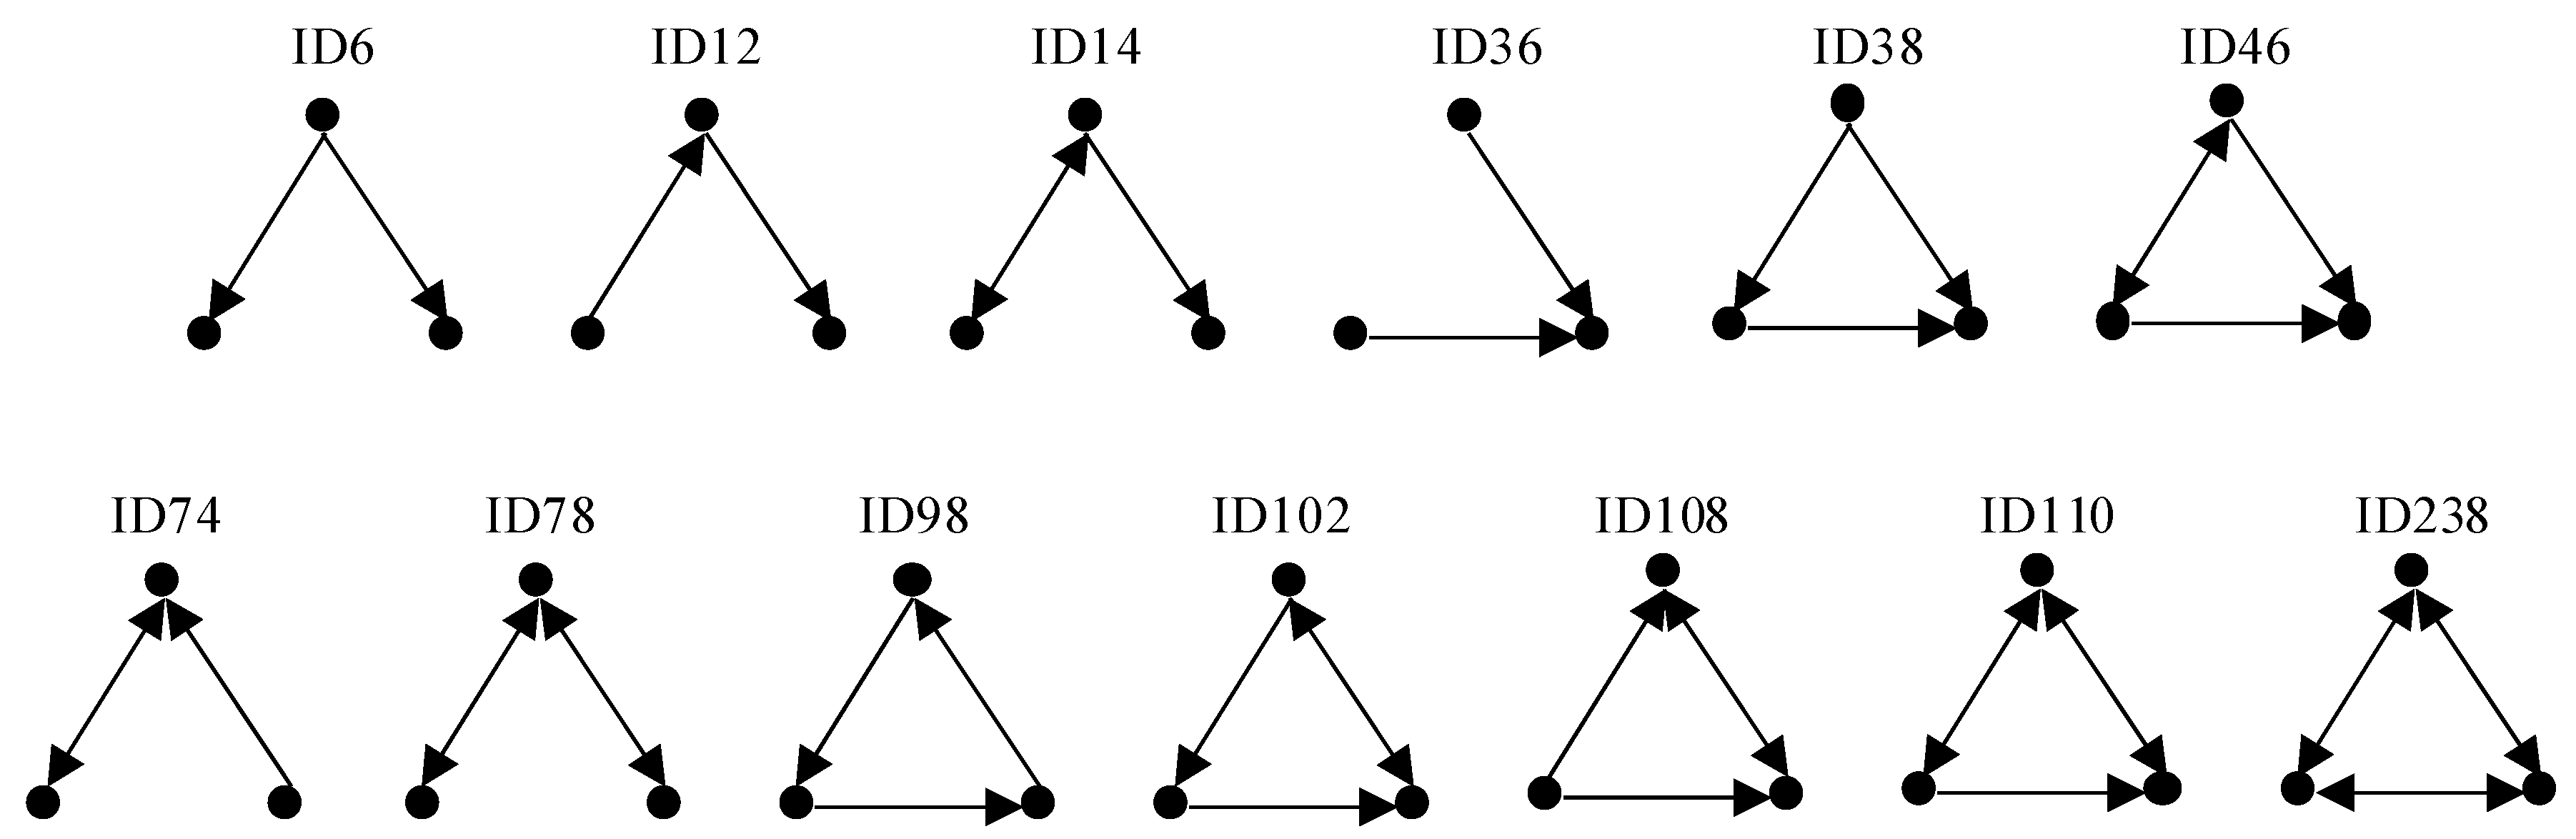
To further analyze the correlation of node degree values in the influencing factor network for the promotion and application of WPEC, this paper conducted a Pearson correlation analysis and then clustered the nodes based on the results of this analysis, as illustrated in Figure 7. The cluster results above the heatmaps in Figure 7a–c are based on the out-degree correlations for clustering the nodes, while the clusters on the left side are based on in-degrees. Figure 7d shows the clustering results for the G1, G2, and G3 networks.
In Figure 7d, the node clustering results based on out-degree are differentiated by color for different intensities of influence. This color differentiation is based on comparing the out-degree-based node clustering results with the in-degree-based clustering results. If a category of nodes appears in both clustering results, they are color-coded, and if nodes of the same category in the out-degree-based clustering belong to different categories in the in-degree-based clustering, they are differentiated by various colors. From Figure 7d, it is evident that although the clustering results of influencing factors under different influence strengths vary, the color coding shows that many nodes, whether clustered by out-degree or in-degree, have a tight degree of correlation, indicating strong relationships between these influencing factors.
Therefore, based on the significant influence transmission capabilities identified in Figure 7, these highly correlated influencing factors can be considered as batch factors for collective control measures in developing strategies and recommendations for the promotion and application of WPEC. By mitigating the negative interactions between influencing factors and enhancing their positive impacts, the effectiveness of promoting and applying WPEC can be significantly improved.

3.3. Motif Analysis

To determine the transmission patterns of influences under weak, moderate, and strong influence states, and whether there are significant differences in the number of these transmission patterns at various influencing factors for the promotion of WPEC, this paper conducts motif analysis on the influencing factor network for the promotion and application of WPEC. The results are presented in Table 1.
According to the definition of motifs, the three-node subgraphs and four-node subgraphs shown in Table 1 appear more frequently than in random networks ( Z > 0 ), hence they are statistically significant 3-motifs and 4-motifs ( p < 0.01 ). These motifs form the fundamental components of the influencing factor network for the promotion and application of WPEC. Specifically, for the weak influence state, the G1 network does not have statistically significant 3-motifs; for the moderate influence state, the G2 network has 3-motifs numbered 38 and 46; for the strong influence state, the G3 network contains 3-motifs numbered 38, 46, 166, and 12. The structures of 3-motifs numbered 38, 46, and 166 show that they have one more edge compared to 3-motif number 12, with motif 166 having two convergence points, while motifs 38 and 46 have only one. Moreover, motifs 166 and 46 both contain a bidirectional edge. Therefore, compared to the basic transmission mechanism of “two-node single convergence point + bidirectional edge” and “two-node single convergence point + unidirectional edge” in the moderate influence state, the network of influencing factors for WPEC under strong influence possesses a more complex basic structure, characterized by “two-node double convergence points + bidirectional edge”, “two-node single convergence point + bidirectional edge”, “two-node single convergence point + unidirectional edge”, and “unidirectional transmission” as its fundamental influence transmission mechanisms.
For the 4-motif structure, the G1 network only has 590 types of 4-motif, while the G2 network has 27 types of 4-motif, and the G3 network has 18 types. Additionally, the G3 network shares the same 590 types of 4-motif with the G1 network and has 2270, 2758, 2134, and 2076 types of 4-motifs in common with the G2 network. It is noteworthy that motifs appearing across different levels of influence hold more significant analytical value as they adapt to various influence states and exhibit strong stability, being considered as the fundamental mechanisms of influence transmission. According to Table 1, apart from the 2076 4-motifs having a structure of “two-node convergence point + unidirectional edge”, the 590 4-motif has “two-node double convergence points + bidirectional edge”, the 2270 4-motif has “three-node convergence point + two-node convergence point + bidirectional edge”, the 2758 4-motif has “two-node triple convergence points + bidirectional edge”, and the 2134 4-motif has “two-node convergence point + bidirectional edge”. Thus, “two-node double convergence points + bidirectional edge” is the fundamental transmission mechanism of the influence network for the promotion and application of WPEC under weak influence as well as under strong influence. Meanwhile, “two-node convergence point + unidirectional edge”, “two-node convergence point + bidirectional edge”, “two-node triple convergence points + bidirectional edge”, and “three-node convergence point + two-node convergence point + bidirectional edge” are the basic mechanisms under both moderate and strong influence states.

4. Discussions

“Complexity arises from simplicity”, a phenomenon prevalent in nature and human society alike. Bejan’s “Constructal Law” elucidates the flow of energy and matter in physical and biological networks [20], highlighting a natural tendency in flow systems to evolve more accessible pathways for the flow, enhancing the system’s vitality by increasing and activating the flow.
Due to the interconnected nature of the influencing factors for the promotion and application of WPEC and the transmission of these influences, this paper considers it a complex system constituted by people and their activities and studies it using the complex network method. Additionally, motifs are small-scale subgraphs with high-frequency characteristics in complex networks, reflecting the micro-level interaction patterns that underlie the formation and evolution of networks [18], i.e., the local structural characteristics of the network. Some researchers believe that motifs in biological networks are fundamental structures based on biological evolution with specific functions. However, a few researchers argue that in other large networks, motifs are not functional units but by-products of the network generation process [21]. This paper believes that, in the influencing factor network for the promotion and application of WPEC, motifs, although not functional units for processing information, represent the adaptive behaviors of entities such as governments, markets, enterprises, and owners, etc. These adaptive behaviors lead to the formation and evolution of the influencing factor network for the promotion and application of WPEC. Thus, by constructing the influencing factor network as a complex network, this paper reveals the local structural characteristics of this network through motif analysis and considers the transmission mechanism of influencing factors as the construction laws of its network structure. These laws mainly include:
(1) Greater intensity of influencing factors leads to more diverse modes of influence transmission;
(2) Differences in intensity between influencing factors create a potential for influence, which is widespread;
(3) Potential for influence drives the transmission of influence, with the mode of transmission dependent on the potential difference among influencing factors.
In the influencing factor network for the promotion and application of WPEC, although motifs are not the functional units for information processing, they represent the adaptive behaviors of the influencing factors in the promotion and application of WPEC. Through surveys and interviews with stakeholders in WPEC, the main reasons for the formation of the basic influence transmission mechanisms reflected in the network’s fundamental patterns were identified, including:
(1) The drive from policies, the market, and the industry environment as external factors, with encouraging and restrictive policies setting the boundaries for WPEC adoption, while the market and industry environment provide group leadership and exemplary roles, converging influence;
(2) Constraints from the nature of the project and project organization management, with factors like project investment, fee calculation methods, risk levels, and evaluation systems determining the cost–benefit analysis of adopting WPEC, guiding the potential for influence towards equilibrium;
(3) Limitations of company and employee capabilities, being central in stakeholder factors, with the capacity of WPEC firms and employees acting as bottlenecks for adoption, forming the basis for WPEC promotion and application, and structurally embedding limitations on the path of influence transmission.

5. Conclusions

WPEC is a new consulting model that China has introduced, based on engineering consulting service models from other countries, to address risks in the construction industry and engineering projects. To promote the promotion and application of the WPEC model, this paper studied the transmission mechanism of influencing factors for its promotion of WPEC. Based on motif analysis, the construction laws of the influencing factor network were proposed and the causes of the transmission mechanisms of these influencing factors were explained. The results indicate:
(1) For different levels of influence, the roles of various influencing factors in the promotion and application of WPEC, as sources and receivers of influence, differ, and there is cross-regional transmission of influence flows.
(2) The greater the strength of the influencing factors, the more diverse the modes of influence transmission. Differences in strength among influencing factors create influence potential differences, which are prevalent. These potential differences drive the transmission of influence, and the mode of transmission depends on the influence potential differences between factors.
(3) There are significant differences in the influence flows of various influencing factors for the promotion and application of WPEC, regardless of node in-degree or out-degree, under different levels of influence. Degree values can be associated with levels of influence, considering high-degree nodes as having significant influence transmission capabilities. By controlling these nodes, strategic recommendations for the promotion and application of WPEC can be formulated.
(4) Influencing factors with strong correlations can be treated as batch influencing factors. Therefore, strategies for the promotion of WPEC can be formulated based on the control of these sets, weakening negative interactions between influencing factors and strengthening positive interactions, to effectively enhance the promotion and application of WPEC.
Although this paper used the complex network analysis method to construct the influencing factor network for the promotion and application of WPEC and revealed its transmission mechanisms, there are currently few real-world cases of its adoption and application. Thus, the research results of this paper cannot yet be compared with large-scale real-world cases. As the WPEC model will be widely promoted in China in the future, further multi-case analyses and statistical data analyses can be conducted on the influencing factors for its promotion. These studies can be compared and validated against our findings. Future research will deepen the understanding of the complex relationships among influencing factors for the promotion and application of WPEC and provide important theoretical and case foundations for effectively formulating promotion policies.

Author Contributions

Conceptualization, Q.H.; data curation, W.Z. (Wenbin Zhou) and F.L.; formal analysis, Q.H. and W.Z. (Wen Zhou); funding acquisition, Q.H.; investigation, W.Z. (Wenbin Zhou), P.Y. and F.L.; methodology, W.Z. (Wen Zhou); project administration, Q.H.; resources, Q.H. and W.Z. (Wenbin Zhou); software, X.H. and W.Z. (Wen Zhou); supervision, Q.H.; validation, X.H., P.Y. and F.L.; visualization, W.Z. (Wenbin Zhou) and P.Y.; writing—original draft, X.H. and W.Z. (Wen Zhou); writing—review and editing, X.H. and W.Z. (Wen Zhou) All authors have read and agreed to the published version of the manuscript.

Funding

This research was funded by the Science and Technology R&D Project of China Construction Fifth Engineering Division Corp. Ltd. (cscec5b-2023-02).

Data Availability Statement

The data presented in this study are available on request from the corresponding author.

Conflicts of Interest

Authors Xu Huang, Qingbo Hu, Wenbin Zhou, Peng Yang and Fangru Liu were employed by the company China Construction Fifth Engineering Division Corp. Ltd. The remaining authors declare that the research was conducted in the absence of any commercial or financial relationships that could be construed as a potential conflict of interest. The authors declare that this study received funding from the Science and Technology R&D Project of China Construction Fifth Engineering Division Corp. Ltd. The funder was not involved in the study design, collection, analysis, interpretation of data, the writing of this article or the decision to submit it for publication.

Appendix A. Survey on Influencing Factors for the Promotion and Application of Whole-Process Engineering Consulting

Dear Sir/Madam,
Thank you very much for taking the time out of your busy schedule to fill out this survey. This is a questionnaire on the influencing factors for the promotion and application of Whole Process Engineering Consulting, aiming to understand the influencing factors and their mutual influence. This questionnaire is anonymous, and your answers will not be disclosed to anyone or any organization other than yourself. Your answers will only be used for academic research. Please answer according to your actual situation.
Thank you for your cooperation. I wish you success in your work and all the best!
  • Part One: Basic Information
  • Date of Birth: ____Year___Month___Day
  • Current City of Employment: ________
  • Gender: □ Male □ Female
  • Years of Work Experience: □ Less than 1 year □ 1–3 years □ 4–6 years □ 7–9 years □ 10 years and above
  • Job Category: □ General Staff □ Junior Management □ Middle Management □ Senior Management □ Professional Technical Staff
  • Nature of Your Organization: □ State-owned Enterprise □ Private Enterprise □ Foreign-funded Enterprise □ Public Institution □ Others
  • Your Understanding of Whole-Process Engineering Consulting: □ Not Familiar □ Somewhat Familiar □ Basically Familiar □ Very Familiar
  • Part Two: Evaluation of Agreement on Influencing Factors for the Promotion and Application of Whole-Process Engineering Consulting
Based on literature review and field research, focusing on the essence and characteristics of the promotion and application of Whole Process Engineering Consulting, we have reclassified the influencing factors according to the “External environment-Project factors-Stakeholders” framework. On this basis, we solicited business experts’ opinions on the classification of influencing factors for the promotion and application, and after revisions, we identified 38 factors influencing the promotion and application of Whole Process Engineering Consulting. To further ensure the rationality of these influencing factors, please evaluate each of the following influencing factors.
1.
External Environment, including:
(1) Policies and Regulations: ➀ Government’s promotion efforts ➁ Clarity of the boundaries of legal rights and responsibilities ➂ Degree of perfection of the market access system ➃ Degree of soundness of the regulatory mechanism and standards for the whole-process engineering consultancy services
□ Strongly Disagree □ Disagree □ Neutral □ Agree □ Strongly Agree
If you disagree, please provide your suggestions:
______________________________________________________
(2) Regional Factors: ➀ Local policy preference
□ Strongly Disagree □ Disagree □ Neutral □ Agree □ Strongly Agree
If you disagree, please provide your suggestions:
______________________________________________________
(3) Market Factors: ➀ Vicious competition in the market ➁ Number of whole-process engineering consulting firms with comprehensive service capability ➂ Degree of market recognition ➃ Uncertainties in the industry economic environment
□ Strongly Disagree □ Disagree □ Neutral □ Agree □ Strongly Agree
If you disagree, please provide your suggestions:
______________________________________________________
(4) Industry Environment: ➀ Degree of perfection of industry standards and norms ➁ Management capability of industry associations ➂ Degree of industry service guarantee
□ Strongly Disagree □ Disagree □ Neutral □ Agree □ Strongly Agree
If you disagree, please provide your suggestions:
______________________________________________________
2.
Project Factors, including:
(1) Project Commissioning Situation: ➀ Mode of commissioning and type of service
□ Strongly Disagree □ Disagree □ Neutral □ Agree □ Strongly Agree
If you disagree, please provide your suggestions:
______________________________________________________
(2) Project Nature: ➀ Amount of project investment ➁ Cost of consulting services ➂ Complexity of the project ➃ Requirements of the project technical indicators ➄ Degree of project risk
□ Strongly Disagree □ Disagree □ Neutral □ Agree □ Strongly Agree
If you disagree, please provide your suggestions:
______________________________________________________
(3) Project Organization Situation: ➀ Management mode ➁ Engineering process arrangement ➂ Division of labor ➃ Results evaluation system of whole process engineering consulting
□ Strongly Disagree □ Disagree □ Neutral □ Agree □ Strongly Agree
If you disagree, please provide your suggestions:
______________________________________________________
3.
Stakeholders, including the situation of the commissioning party and the undertaking party.
(1) Situation of the Commissioning Party, including: ➀ Client’s experience in the whole process engineering consulting project ➁ Degree of clarity of needs ➂ Awareness of project risks and the ability to handle ➃ Degree of the client’s participation in the management of the project
□ Strongly Disagree □ Disagree □ Neutral □ Agree □ Strongly Agree
If you disagree, please provide your suggestions:
______________________________________________________
(2) Situation of the Undertaking Party, including enterprise capabilities and personnel capabilities.
(2.1) Enterprise Capabilities, including: ➀ Experience of the whole process engineering consulting project of the enterprise ➁ Scope of wholly-owned business it can undertake ➂ Service level of the whole process engineering consulting business ➃ Application ability of new technology ➄ Integration management ability of the whole process engineering consulting service ➅ Integration ability of the enterprise’s resources in various technical fields ➆ Cultivation cost of specialized and comprehensive talents ➇ Subjective initiative of the transformation of the whole process engineering consulting ➈ Influence of the enterprise’s brand ➉ Enterprise’s knowledge management ability
□ Strongly Disagree □ Disagree □ Neutral □ Agree □ Strongly Agree
If you disagree, please provide your suggestions:
______________________________________________________
(2.2) Personnel Capabilities, including: ➀ Practitioners’ qualification ➁ Acceptance of the whole process engineering consulting model by employees
□ Strongly Disagree □ Disagree □ Neutral □ Agree □ Strongly Agree
If you disagree, please provide your suggestions:
______________________________________________________
  • Part Three: Evaluation of the Degree of Association Among Influencing Factors for the Promotion and Application of Whole-Process Engineering Consulting
Based on the above influencing factors for the promotion and application of Whole Process Engineering Consulting, please evaluate the degree of association between each pair of influencing factors. To facilitate the filling process, we use symbols to represent the influencing factors, as follows:
X1:
Government’s promotion efforts
X2:
Clarity of the boundaries of legal rights and responsibilities
X3:
Degree of perfection of the market access system
X4:
Degree of soundness of the regulatory mechanism and standards for the whole process engineering consultancy services
X5:
Local policy preference
X6:
Vicious competition in the market
X7:
Number of whole-process engineering consulting firms with comprehensive service capability
X8:
Degree of market recognition
X9:
Uncertainties in the industry economic environment
X10:
Degree of perfection of industry standards and norms
X11:
Management capability of industry associations
X12:
Degree of industry service guarantee
X13:
Mode of commissioning and type of service
X14:
Amount of project investment
X15:
Cost of consulting services
X16:
Complexity of the project
X17:
Requirements of the project technical indicators
X18:
Degree of project risk
X19:
Management mode
X20:
Engineering process arrangement
X21:
Division of labor
X22:
Results evaluation system of whole process engineering consulting
X23:
Client’s experience in the whole process engineering consulting project
X24:
Degree of clarity of needs
X25:
Awareness of project risks and the ability to handle
X26:
Degree of the client’s participation in the management of the project
X27:
Experience of the whole process engineering consulting project of the enterprise
X28:
Scope of wholly-owned business it can undertake
X29:
Service level of the whole process engineering consulting business
X30:
Application ability of new technology
X31:
Integration management ability of the whole process engineering consulting service
X32:
Integration ability of the enterprise’s resources in various technical fields
X33:
Cultivation cost of specialized and comprehensive talents
X34:
Subjective initiative of the transformation of the whole process engineering consulting
X35:
Influence of the enterprise’s brand
X36:
Enterprise’s knowledge management ability
X37:
Practitioners’ qualification
X38:
Acceptance of the whole-process engineering consulting model by employees
It should be noted that the degree of association between each pair of influencing factors is mutual. Therefore, each pair only needs to be evaluated once. The evaluation is divided into four levels: No Influence = 0, Weak Influence = 1, Moderate Influence = 2, Strong Influence = 3. Please fill in the appropriate values in the following table to reflect the degree of association between the influencing factors for the promotion and application of Whole-Process Engineering Consulting.
This concludes the questionnaire. Please check for any missing items. Thank you again for your strong support.
Table A1. Table for Evaluating the Degree of Association Among Influencing Factors for the Promotion and Application of Whole-Process Engineering Consulting.
X1X2X3X4X5X6X7X8X9X10X11X12X13X14X15X16X17X18X19X20X21X22X23X24X25X26X27X28X29X30X31X32X33X34X35X36X37X38
X1
X2
X3
X4
X5
X6
X7
X8
X9
X10
X11
X12
X13
X14
X15
X16
X17
X18
X19
X20
X21
X22
X23
X24
X25
X26
X27
X28
X29
X30
X31
X32
X33
X34
X35
X36
X37
X38

References

  1. Shi, H.; Zhang, R.; Xie, P. Development status and trend of the whole process engineering consulting. For. Chem. Rev. 2022, 5, 1265–1270. [Google Scholar]
  2. Wang, Z.H. Expression of concepts and terms related to whole process engineering consulting. Eng. Constr. 2022, 36, 258–260. [Google Scholar]
  3. Huang, Y. Research on the Development of Whole Process Engineering Consulting Based on Policy Analysis and Multi Project Statistics. Constr. Econ. 2022, 43, 19–28. [Google Scholar]
  4. Zhang, S.; Sun, K. The whole process consulting integrated management analysis based on virtual value chain. J. Eng. Manag./Gongcheng Guanli Xuebao 2019, 33, 28–36. [Google Scholar]
  5. Zhuo, S.; Liang, B.; Wang, C.; Zhang, T. Analysis of social capital and the whole-process engineering consulting company’s behavior choices and government incentive mechanisms—Based on replication dynamic evolutionary game theory. Buildings 2023, 13, 1604. [Google Scholar] [CrossRef]
  6. Liao, Z. Application analysis of whole-process engineering consulting service in ppp project management. Munic. Engineering. 2022, 7, 31–38. [Google Scholar]
  7. Zhu, X.; Shen, S.; Liu, C. Path analysis of implementing whole process engineering consulting mode in power grid project. In Proceedings of the 2021 International Conference on Applications and Techniques in Cyber Intelligence: Applications and Techniques in Cyber Intelligence (ATCI 2021), Fuyang, China, 19–21 June 2021; Volume 2, pp. 79–85. [Google Scholar]
  8. Shen, Z.; Zhao, J.; Guo, M. Evaluating the engineering-procurement-construction approach and whole process engineering consulting mode in construction projects. Iran. J. Sci. Technol. Trans. Civ. Eng. 2023, 47, 2533–2547. [Google Scholar] [CrossRef]
  9. Xie, W. Analysis on Influencing Factors of the Implementation of Whole Process Engineering Consulting Based on DEMATEL Model. China Build. Decor. 2022, 32, 95–97. [Google Scholar]
  10. Xu, Y.; Wen, X.; Ma, S. Analysis on Barrier Factors of the Implementation of Whole Process Engineering Consulting Based on ISM Model. Constr. Econ. 2022, 43, 81–89. [Google Scholar]
  11. Hu, Q.G.; Tian, X.Z.; He, Z.M. Analysis of influencing factors consulting mode in promotion of whole-process engineering based on DEMATEL-ISM. J. Chang. Univ. Sci. Technol. 2021, 18, 40–48. [Google Scholar]
  12. Bürger, M.; Schlögl, S.; Schmid-Petri, H. Conflict dynamics in collaborative knowledge production. A study of network gatekeeping on Wikipedia. Soc. Netw. 2023, 72, 13–21. [Google Scholar] [CrossRef]
  13. Völker, B. Networks in lockdown: The consequences of COVID-19 for social relationships and feelings of loneliness. Soc. Netw. 2023, 72, 1–12. [Google Scholar] [CrossRef] [PubMed]
  14. Aerne, A. Prestige in social dilemmas: A network analytic approach to cooperation among Bogotá’s art organizations. Soc. Netw. 2020, 61, 196–209. [Google Scholar] [CrossRef]
  15. Zhang, Z.; Luo, T. Network capital, exploitative and exploratory innovations—From the perspective of network dynamics. Technol. Forecast. Soc. Change 2020, 152, 119910. [Google Scholar] [CrossRef]
  16. Huang, X.; Hu, Q.; Peng, Y.; Huang, K.; Liao, X.; Zhou, L. Influencing Factors and Transmission Mechanisms of the Application and Promotion of Whole-Process Engineering Consulting Based on Complex Networks. In Proceedings of the 2023 9th International Conference on Big Data and Information Analytics (BigDIA), Haikou, China, 15–17 December 2023; pp. 398–408. [Google Scholar]
  17. Zhou, W.; Chen, W.; Wang, Z.; Ma, Y. Generating Behavior in the University-Industry Collaboration Network: Based on the Configuration of Motifs. J. Syst. Sci. Inf. 2015, 3, 434–450. [Google Scholar] [CrossRef]
  18. Hu, B.R.; Pei, Z.M.; Luo, Z.K. Temporal network motif discovery method based on null model. J. Comput. Appl. 2023, 43, 2505–2510. [Google Scholar]
  19. Yu, S.; Feng, Y.; Zhang, D.; Bedru, H.D.; Xu, B.; Xia, F. Motif discovery in networks: A survey. Comput. Sci. Rev. 2020, 37, 100267. [Google Scholar] [CrossRef]
  20. Bejan, A.V.; Errera, M.R. Complexity, organization, evolution, and constructal law. J. Appl. Phys. 2016, 119, 074901. [Google Scholar] [CrossRef]
  21. Freire, L.O.; de Andrade, D.A. Constructal Law of Institutions within Social Organizations. Open J. Appl. Sci. 2018, 8, 103–125. [Google Scholar] [CrossRef]
Figure 1. Research framework.
Buildings 14 01570 g001
Figure 2. Identification of Influencing Factors in the Promotion and Application of WPEC.
Buildings 14 01570 g002
Figure 3. Network of Influencing Factors for the Promotion and Application of WPEC.
Buildings 14 01570 g003
Figure 4. Form and numbering of a 3-node subgraph motifs.
Buildings 14 01570 g004
Figure 5. Degree Distribution of Nodes in the Influencing Factor Network for the Promotion and Application of WPEC. Panel (a) shows the in-degree distribution for the three binary networks and panel (b) shows the out-degree distribution. The horizontal axis represents the degree value of the network, the vertical axis represents the number of degree values, the bar graph indicates the degree values, and the curve is the fitting curve.
Buildings 14 01570 g005
Figure 6. In-degree, out-degree, and their differences for nodes in the influencing factor network for the promotion and application of WPEC, where (a) shows the in-degree, out-degree, and their differences for the G1 network nodes, (b) for the G2 network nodes, and (c) for the G3 network nodes. The horizontal axis represents the degree value of the nodes, the vertical axis represents different nodes, and I to X denotes different regions to which the influencing factors belong. Dashed boxes indicate nodes in the network with a difference in in-degree and out-degree greater than 4, while solid boxes represent the overlap of nodes with prominent differences in in-degree and out-degree across the different networks.
Buildings 14 01570 g006
Figure 7. Heatmap of node correlation clustering for the network of influencing factors in the promotion and application of WPEC. Each cell color in the heatmap represents the numerical value of the correlation. The hierarchical clustering at the top and left side of the heatmap represents the clustering of all nodes based on their out-degree and in-degree. The color intensity is determined by the Pearson correlation results between various influencing factors. Colors trending towards red indicate stronger positive correlation, while colors trending towards blue indicate stronger negative correlation. (a) Represents the node correlation clustering for the G1 network, (b) for the G2 network, (c) for the G3 network, and (d) shows the community division based on node degree value correlation for the G1, G2, and G3 networks.
Buildings 14 01570 g007
Table 1. Results of the motif analysis of influencing factors in the promotion and application of WPEC.
Subgraph NumberSubgraph StructureSubgraph (Motif r = 1000, p < 0.01, Z > 0)Subgraph Types
Frequency [Original]Mean-Freq [Random]Standard-Dev [Random]Z-Scorep-Value
38Buildings 14 01570 i00112.274%9.875%0.0054.7990G2-3motif
10.357%8.095%0.0063.4940G3-3motif
46Buildings 14 01570 i0023.571%2.640%0.0033.6090G2-3motif
1.953%1.138%0.0033.2340.001G3-3motif
166Buildings 14 01570 i0032.971%1.318%0.0035.6470G3-3motif
12Buildings 14 01570 i00423.260%21.574%0.0062.7930G3-3motif
590Buildings 14 01570 i0052.213%0.435%0.0044.5170G1-4motif
1.004%0.498%0.0013.6010.001G3-4motif
4558Buildings 14 01570 i0060.121%0.022%0.0007.4800G2-4motif
2182Buildings 14 01570 i0071.273%0.723%0.0015.2120G2-4motif
2252Buildings 14 01570 i0080.802%0.463%0.0014.8750G2-4motif
972Buildings 14 01570 i0090.362%0.170%0.0004.8340G2-4motif
2190Buildings 14 01570 i0100.718%0.427%0.0014.7600G2-4motif
2270Buildings 14 01570 i0110.259%0.106%0.0004.6960G2-4motif
0.125%0.019%0.0006.3390G3-4motif
74Buildings 14 01570 i0129.044%7.380%0.0044.6220G2-4motif
2462Buildings 14 01570 i0130.278%0.115%0.0004.5620G2-4motif
17,356Buildings 14 01570 i0140.090%0.026%0.0004.5530.001G2-4motif
8908Buildings 14 01570 i0150.151%0.060%0.0004.1670G2-4motif
2458Buildings 14 01570 i0160.585%0.347%0.0014.1330G2-4motif
2254Buildings 14 01570 i0170.543%0.277%0.0014.1100.001G2-4motif
670Buildings 14 01570 i0180.452%0.242%0.0013.9770.001G2-4motif
19,102Buildings 14 01570 i0190.048%0.013%0.0003.9380.004G2-4motif
2118Buildings 14 01570 i0201.919%1.359%0.0013.8440.001G2-4motif
2140Buildings 14 01570 i0210.766%0.474%0.0013.8020G2-4motif
19,034Buildings 14 01570 i0220.139%0.052%0.0003.7450G2-4motif
924Buildings 14 01570 i0230.326%0.176%0.0003.5190.001G2-4motif
5070Buildings 14 01570 i0240.054%0.019%0.0003.3540.002G2-4motif
142Buildings 14 01570 i0253.873%3.349%0.0023.3390.001G2-4motif
2758Buildings 14 01570 i0260.181%0.087%0.0003.0340.004G2-4motif
0.183%0.058%0.0003.5610.005G3-4motif
2134Buildings 14 01570 i0270.555%0.345%0.0013.0070.004G2-4motif
0.411%0.143%0.0014.6450.001G3-4motif
222Buildings 14 01570 i0280.386%0.216%0.0012.9770.001G2-4motif
2142Buildings 14 01570 i0290.501%0.329%0.0012.9630.003G2-4motif
18,590Buildings 14 01570 i0300.103%0.048%0.0002.9450.003G2-4motif
604Buildings 14 01570 i0310.742%0.473%0.0012.8710.007G2-4motif
2076Buildings 14 01570 i0321.816%1.439%0.0012.6660.006G2-4motif
1.631%0.920%0.0024.3440G3-4motif
862Buildings 14 01570 i0330.319%0.007%0.00021.9120G3-4motif
27,342Buildings 14 01570 i0340.103%0.002%0.00018.4440G3-4motif
990Buildings 14 01570 i0350.068%0.002%0.00014.3380G3-4motif
18,636Buildings 14 01570 i0360.502%0.072%0.00010.0150G3-4motif
2766Buildings 14 01570 i0370.297%0.045%0.0009.1440G3-4motif
4958Buildings 14 01570 i0380.091%0.006%0.0007.1460G3-4motif
27,340Buildings 14 01570 i0390.125%0.009%0.0006.7310G3-4motif
390Buildings 14 01570 i0402.270%1.157%0.0026.0730G3-4motif
710Buildings 14 01570 i0411.255%0.483%0.0015.2800G3-4motif
6558Buildings 14 01570 i0420.137%0.033%0.0004.1370G3-4motif
536Buildings 14 01570 i0434.426%3.171%0.0033.8540.001G3-4motif
2398Buildings 14 01570 i0440.137%0.042%0.0003.7180G3-4motif
18,572Buildings 14 01570 i0451.483%0.883%0.0023.0100.002G3-4motif
Disclaimer/Publisher’s Note: The statements, opinions and data contained in all publications are solely those of the individual author(s) and contributor(s) and not of MDPI and/or the editor(s). MDPI and/or the editor(s) disclaim responsibility for any injury to people or property resulting from any ideas, methods, instructions or products referred to in the content.

