
Experimental Investigation of the Static and Dynamic Compression Characteristics of Limestone Based on Its Initial Damage

 ,
,
Abstract
:1. Introduction
2. The Definition of Initial Damage
3. Materials and Methods
3.1. Tested Materials
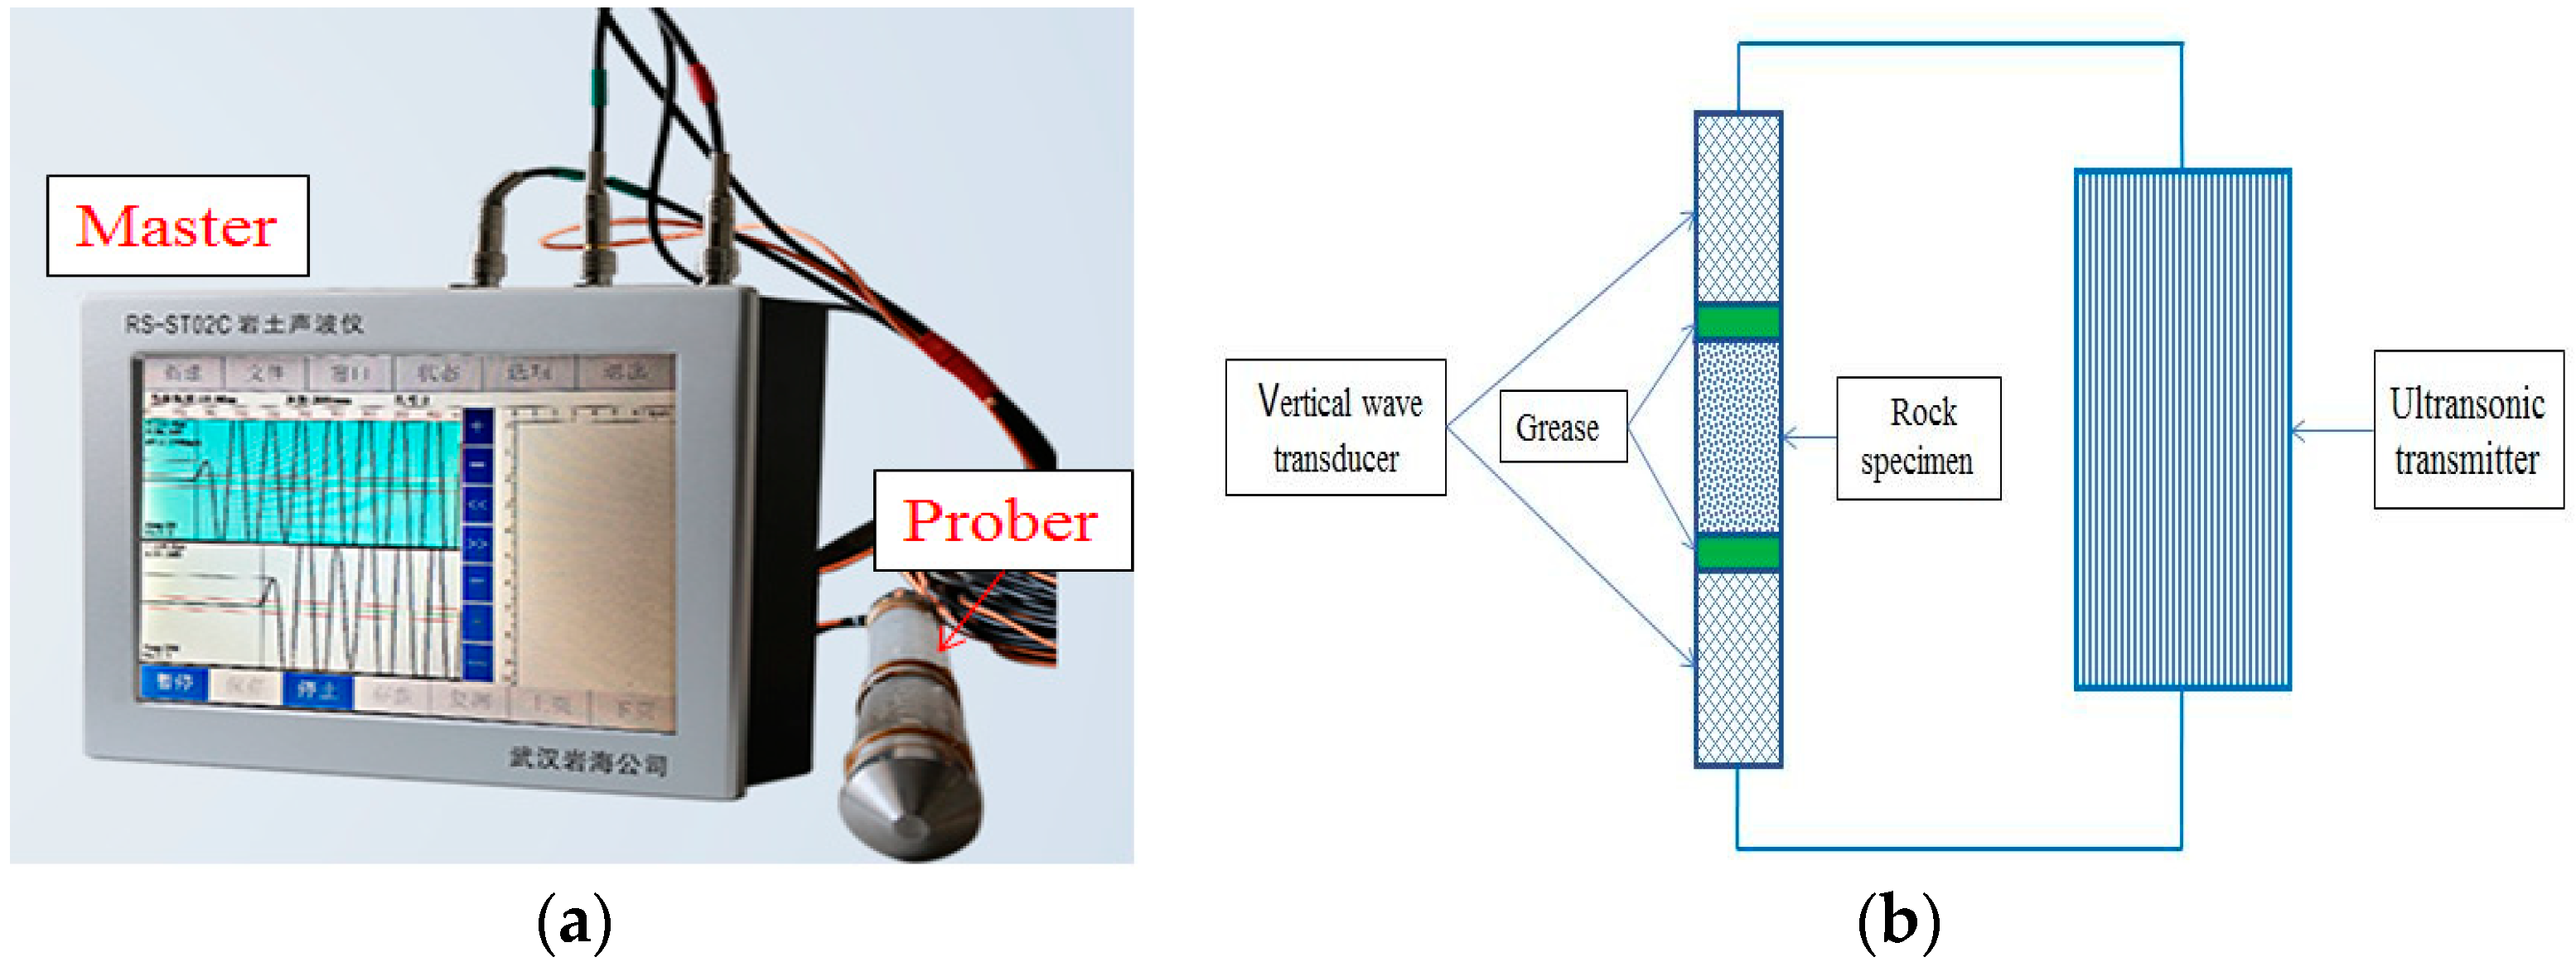
3.2. Rock Ultrasonic Testing
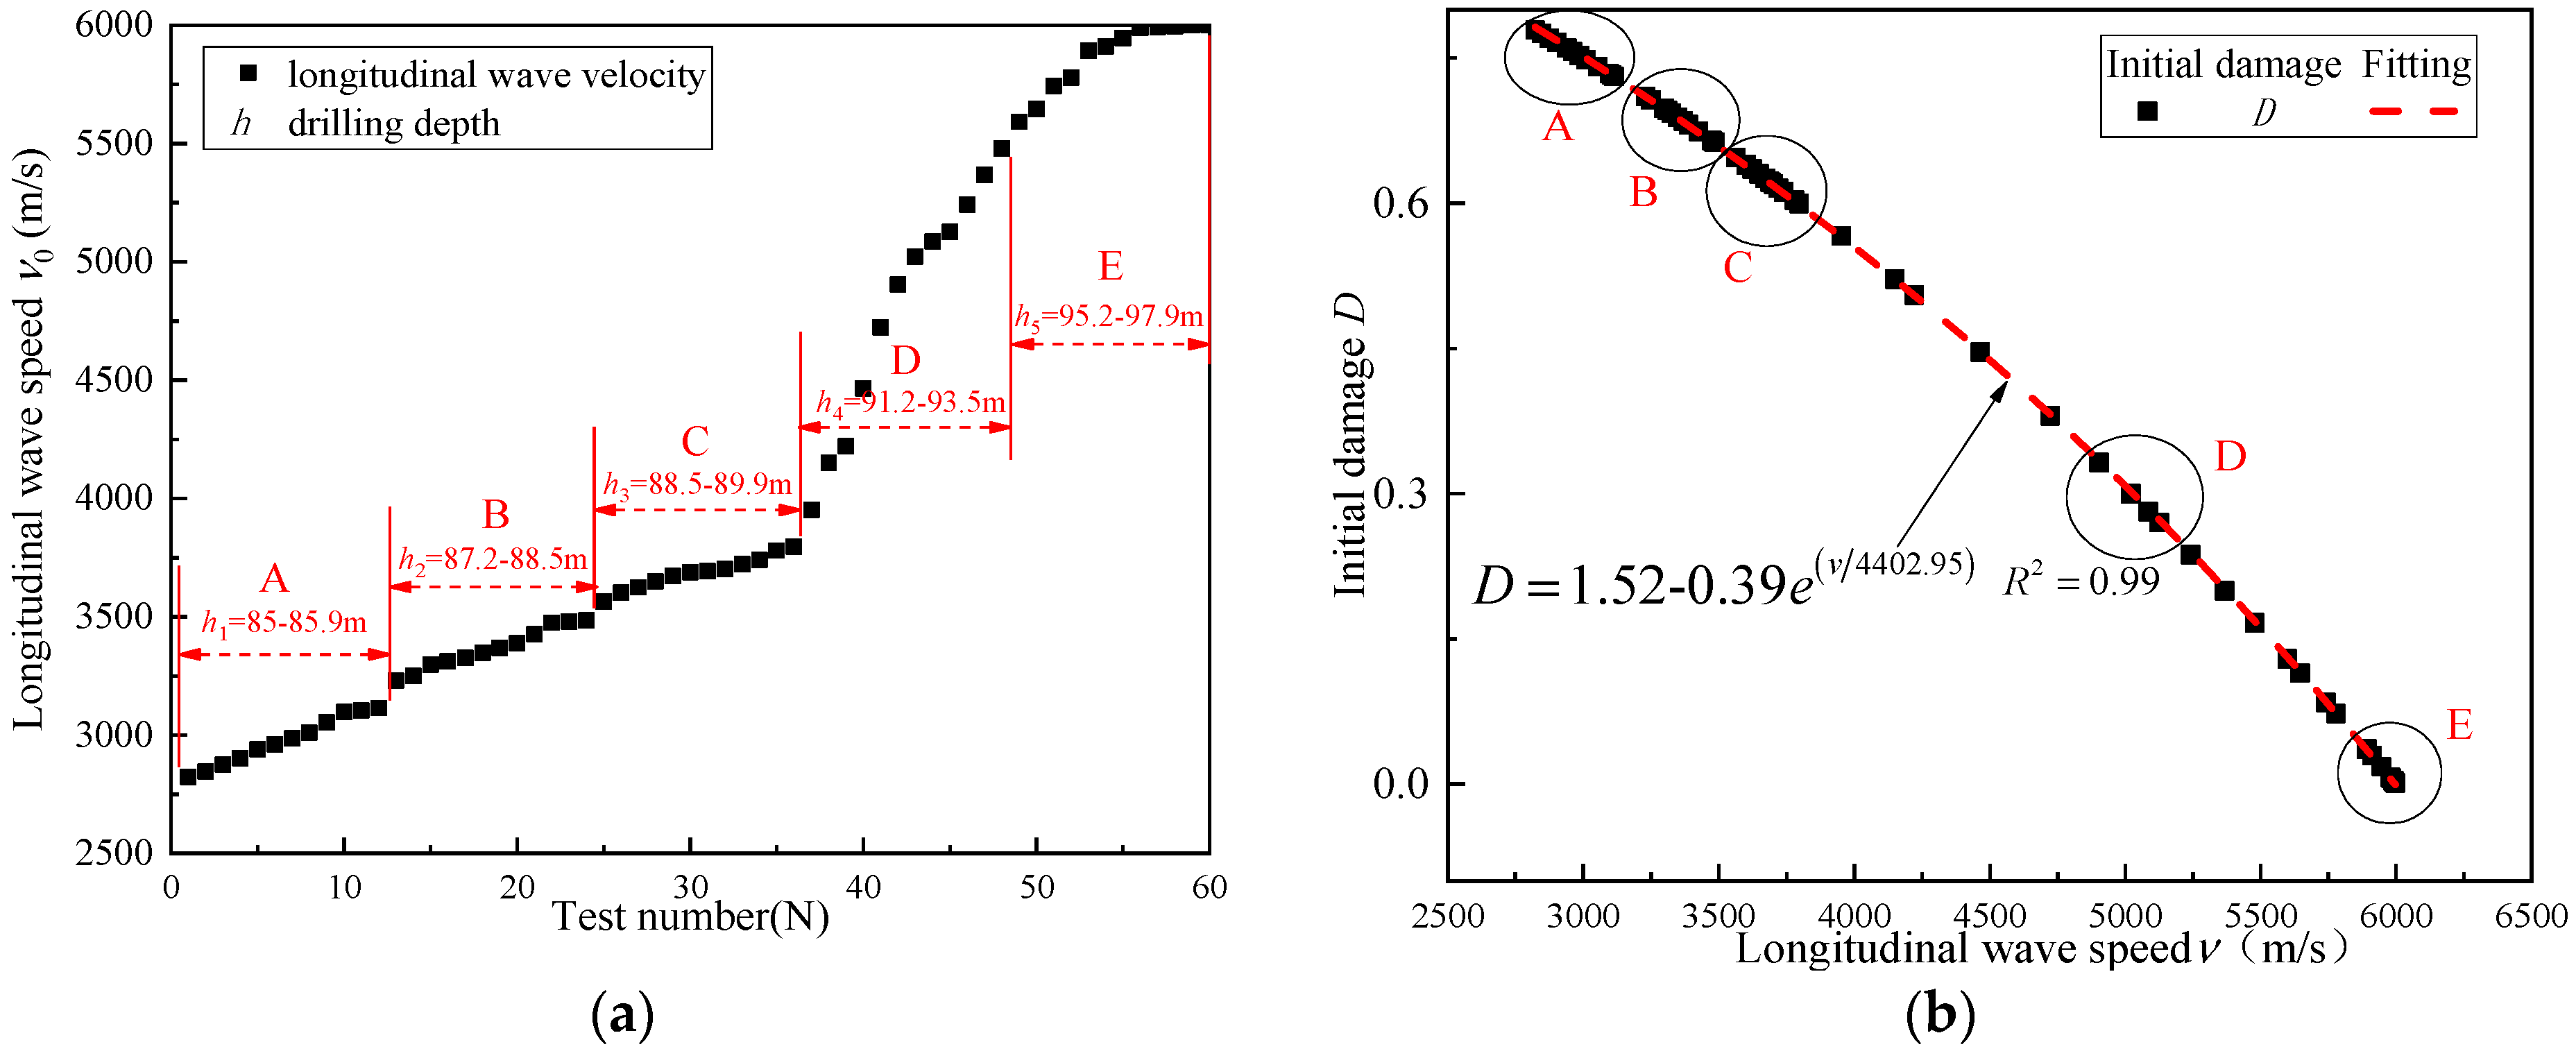
- The rock samples’ longitudinal wave velocities are similar at the same drilling locations, and there is a small longitudinal wave velocity change of rock samples at each drilling position, except point D.
- With an increasing drilling depth, the longitudinal wave velocity increases, and the maximum value is approximately 6000 m/s; the smaller the drilling depth, the greater the degree of damage disturbance, and the smaller the wave velocity.
- The initial damage varies non-linearly with respect to the longitudinal wave velocity of the five drilling locations.
3.3. Uniaxial, and Triaxial Compression Tests
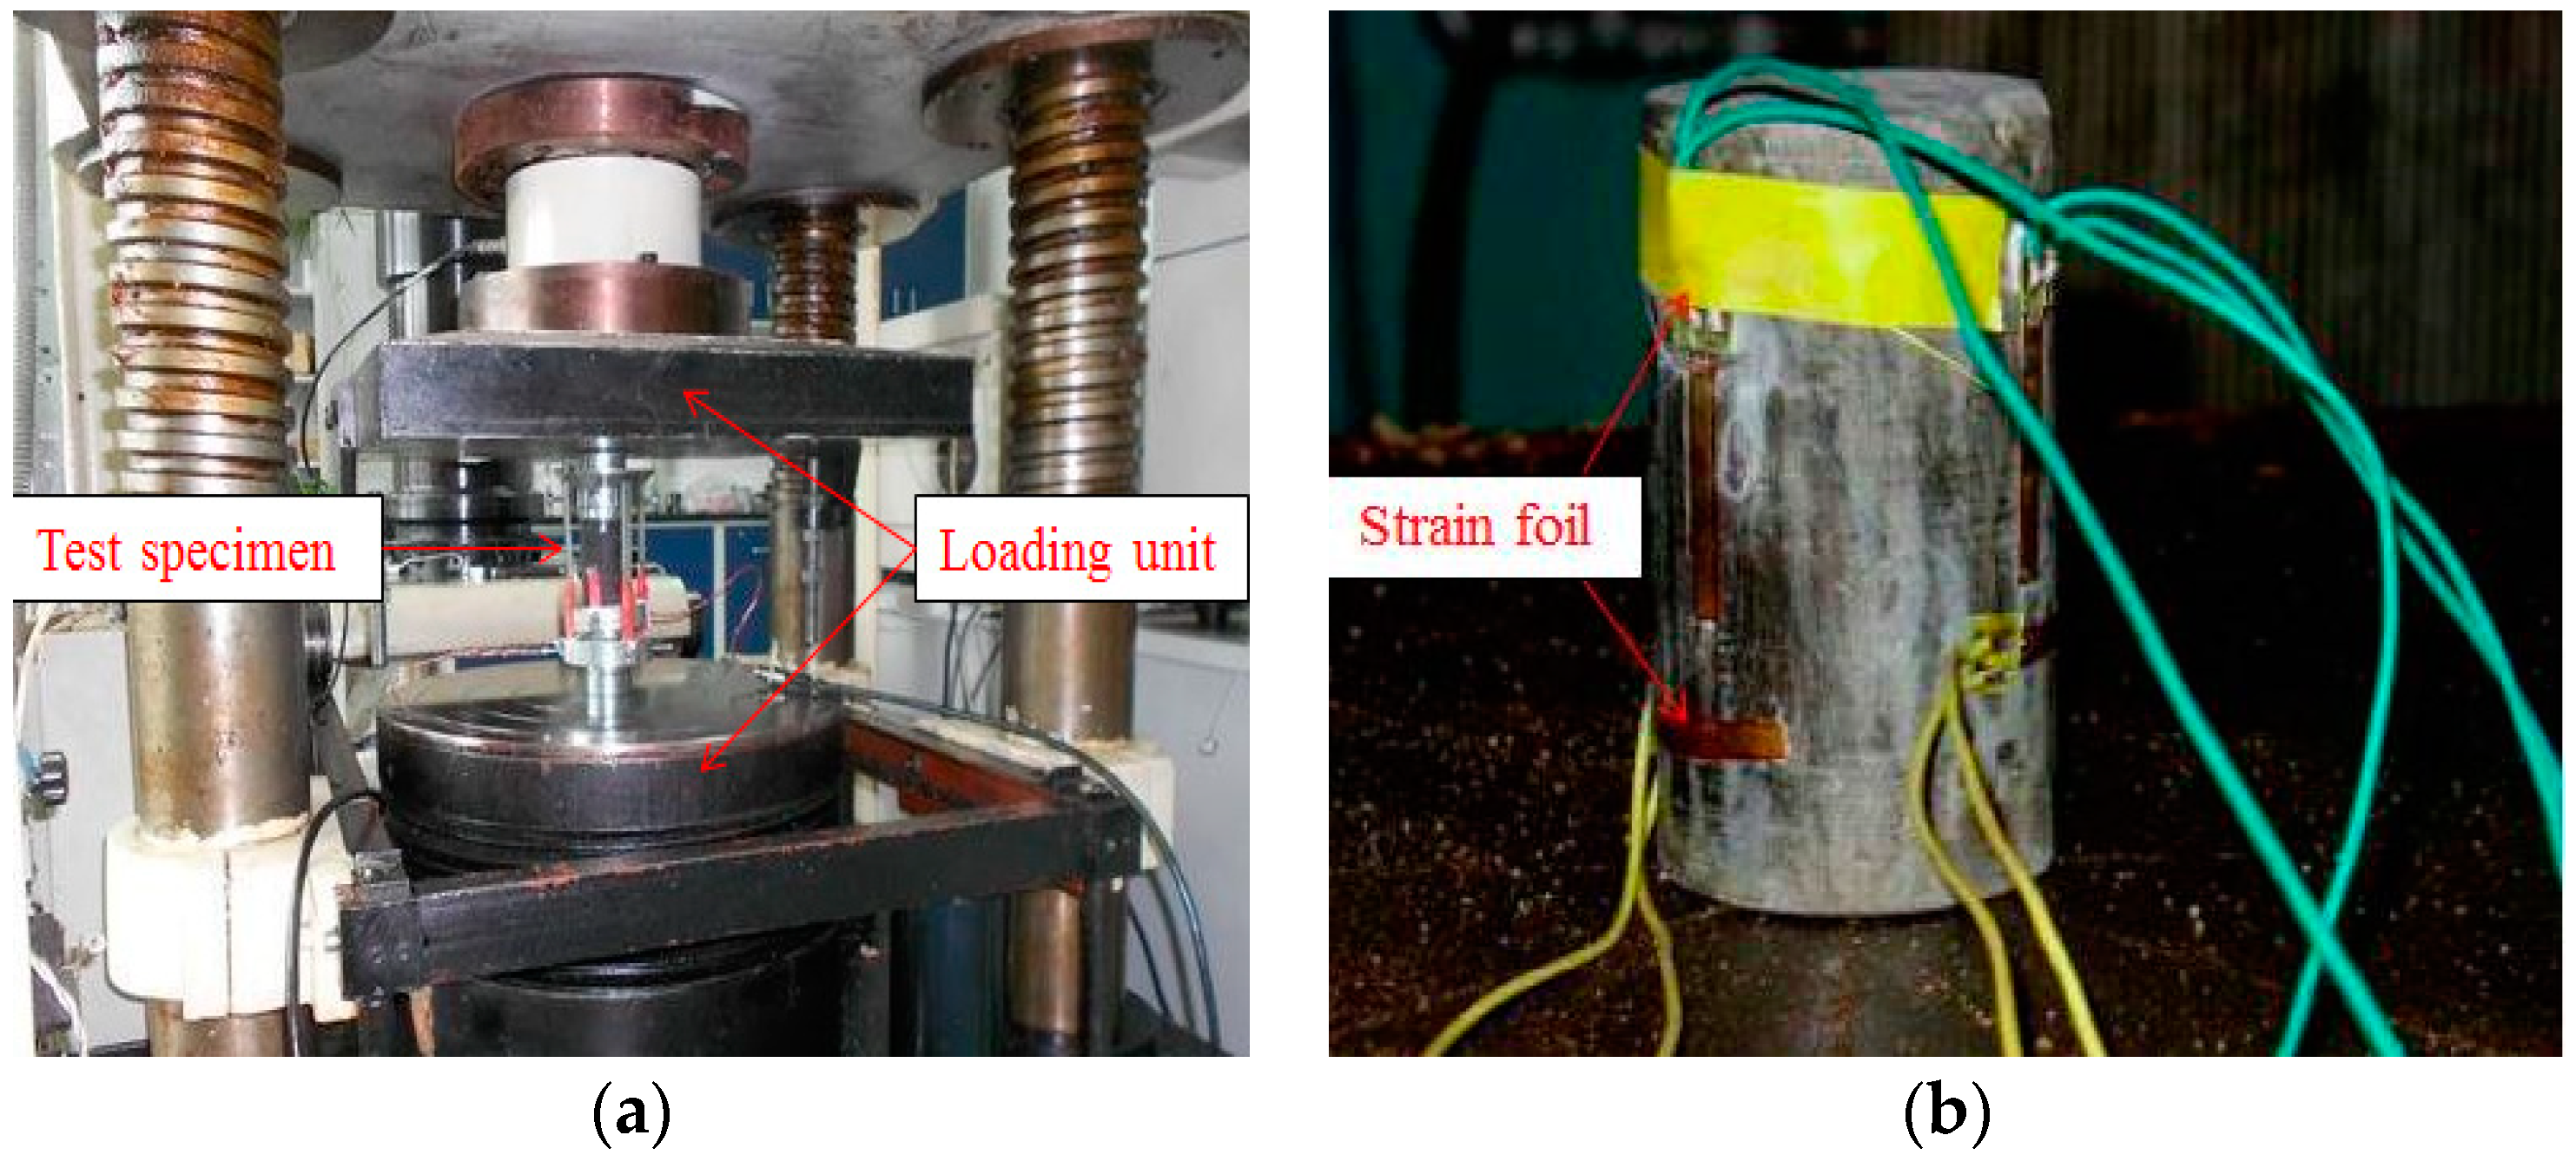
3.3.1. Static Compression Test at Low Strain Rates
3.3.2. Test Program
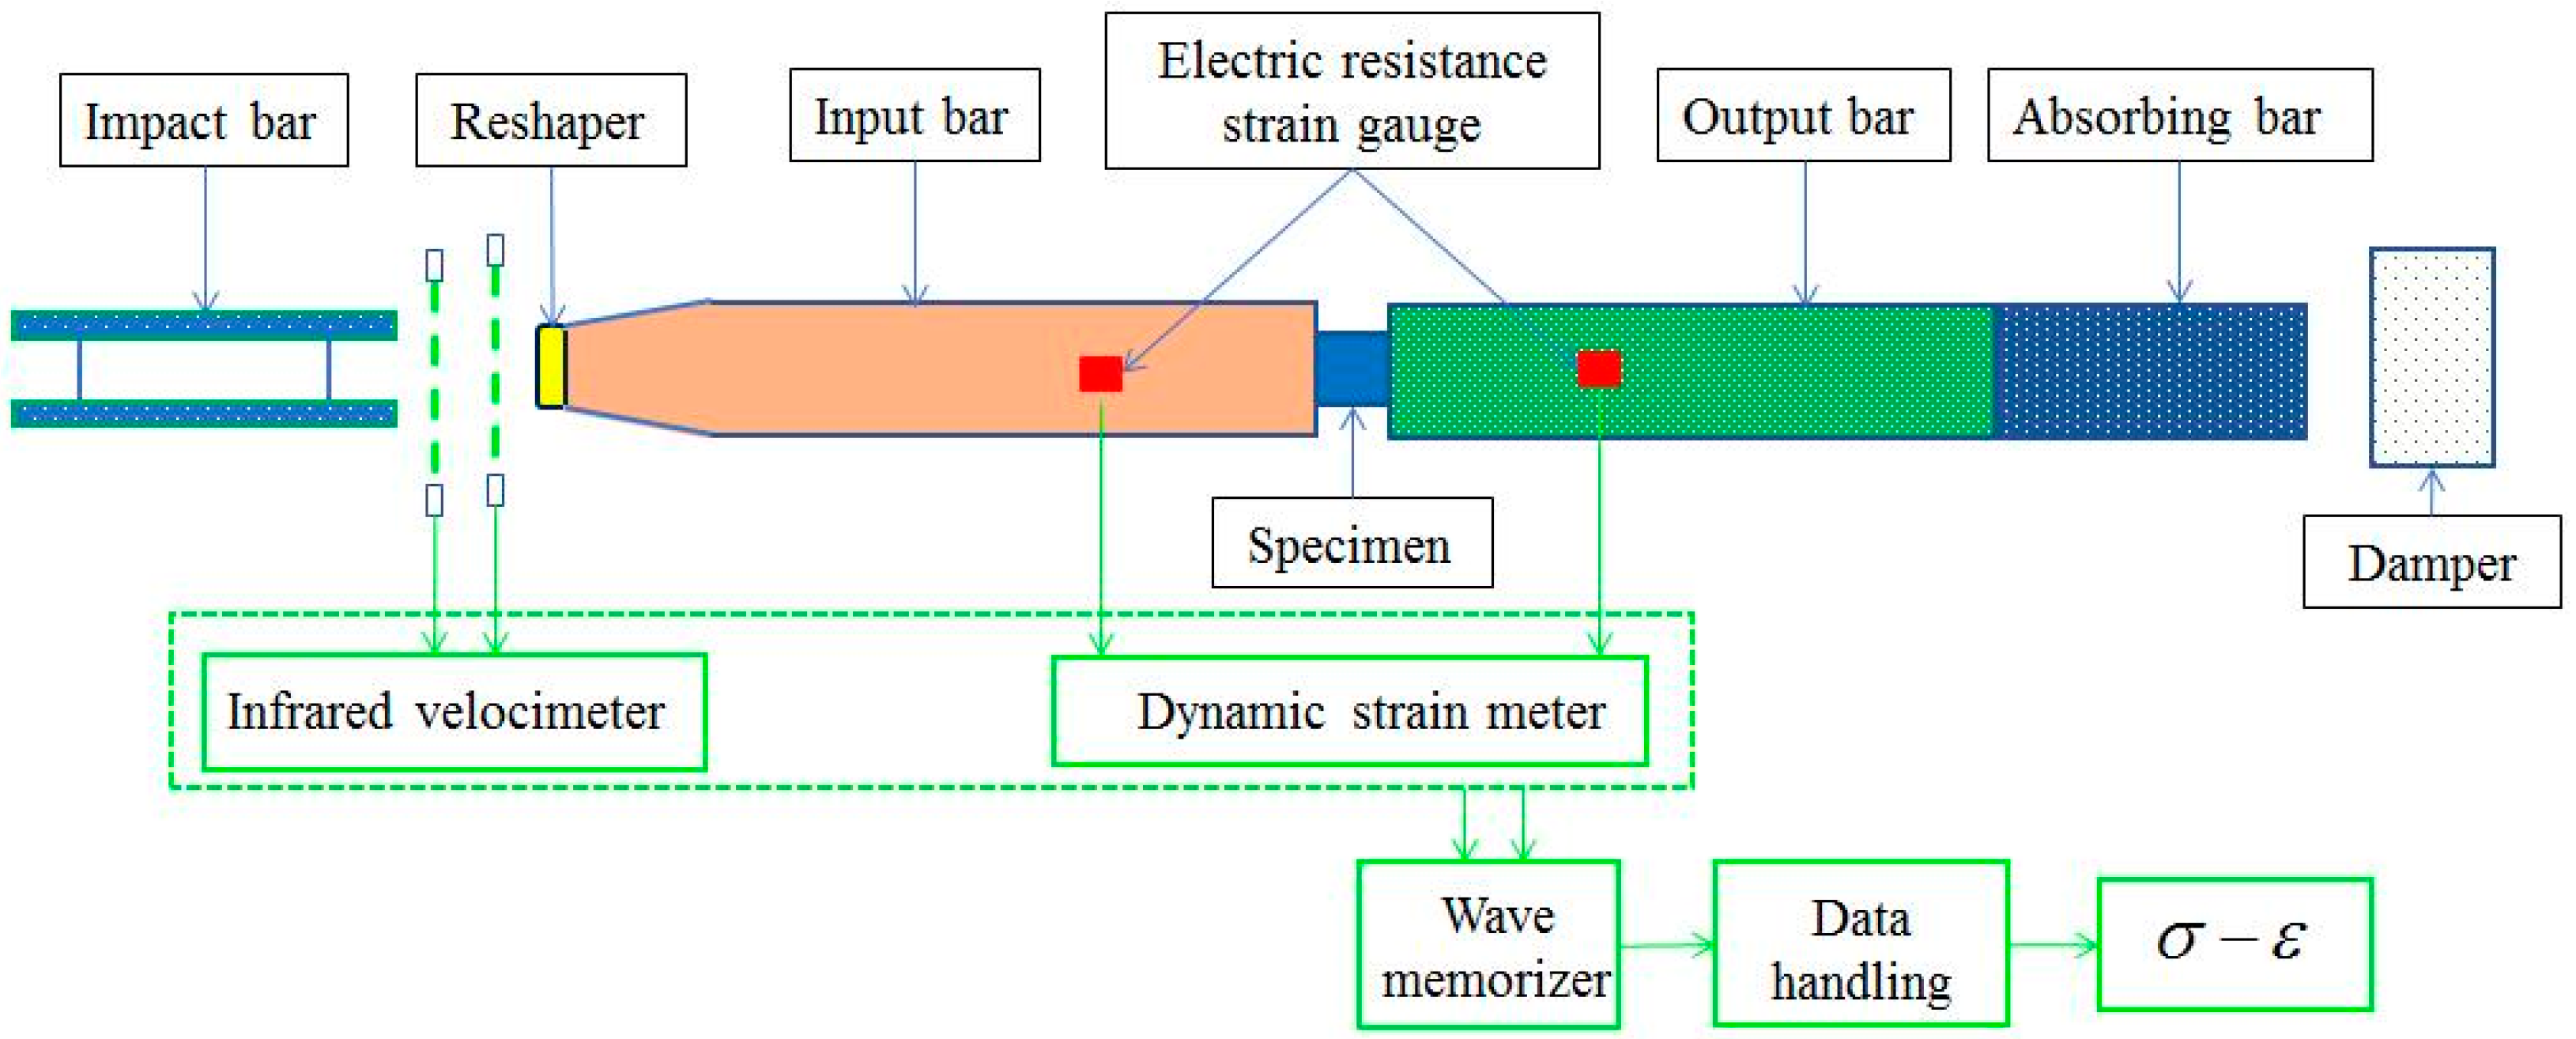
3.4. Dynamic Compression Test of High Strain Rates
4. Results
4.1. Crack Conditions at the Failure Stage
- The transverse cracks expand to varying degrees for crack 1 and crack 2, the degree of circumferential crack propagation is large, and the fracture surface is formed when entering the yield failure stage.
- New macroscopic cracks in the middle of the specimen are produced, indicating that the internal microcrack aggregation in the initial compression phase eventually exhibits macroscopic cracks, as shown in crack 3. This behavior is similar to the uniaxial compression loading test reported by Fakhimi [49], in which a progressive increase in the initial damage occurs with continued uniaxial compression.
4.1.1. The Uniaxial Compression Test with Low Strain Rates
- A rapid decline after the maximum peak stress was observed, corresponding to the failure state. The sharp decline of limestone strength after the failure state is due to the macroscopic cracks’ expansion and the strain softening of the residual strength.
- An interesting phenomenon is that the stress growth curve shows several peak spikes after the line elastic phase. Moreover, for curves 1, 2, and 3, the compression phase curve is approximated, while the linear elastic phase curve grows sharply as the strain rate decreases slowly. Similar behavior was observed by Hemami [50] for different kinds of rock under compression loading and the phenomenon was given a name by Perez [51].
- The difference in the maximum stress is due to the load strain rate and the initial damage. For D = 0.043, the difference in the maximum uniaxial compression becomes more apparent than that of D = 0.357, 0.625, and 0.754. The value of the maximum compression stress in the load strain rate = 2 × 10⁻⁴ s−1 is 176 Mpa, which is 11.4% and 15.0% higher than that in = 2 × 10⁻⁵ s−1 and = 2 × 10⁻⁶ s−1, respectively. The stress strength of the limestone depends upon the degree of development of crack pores in the rock. A greater initial damage means the cracks inside the rock are more complicated, leading to a destruction in the compression test.
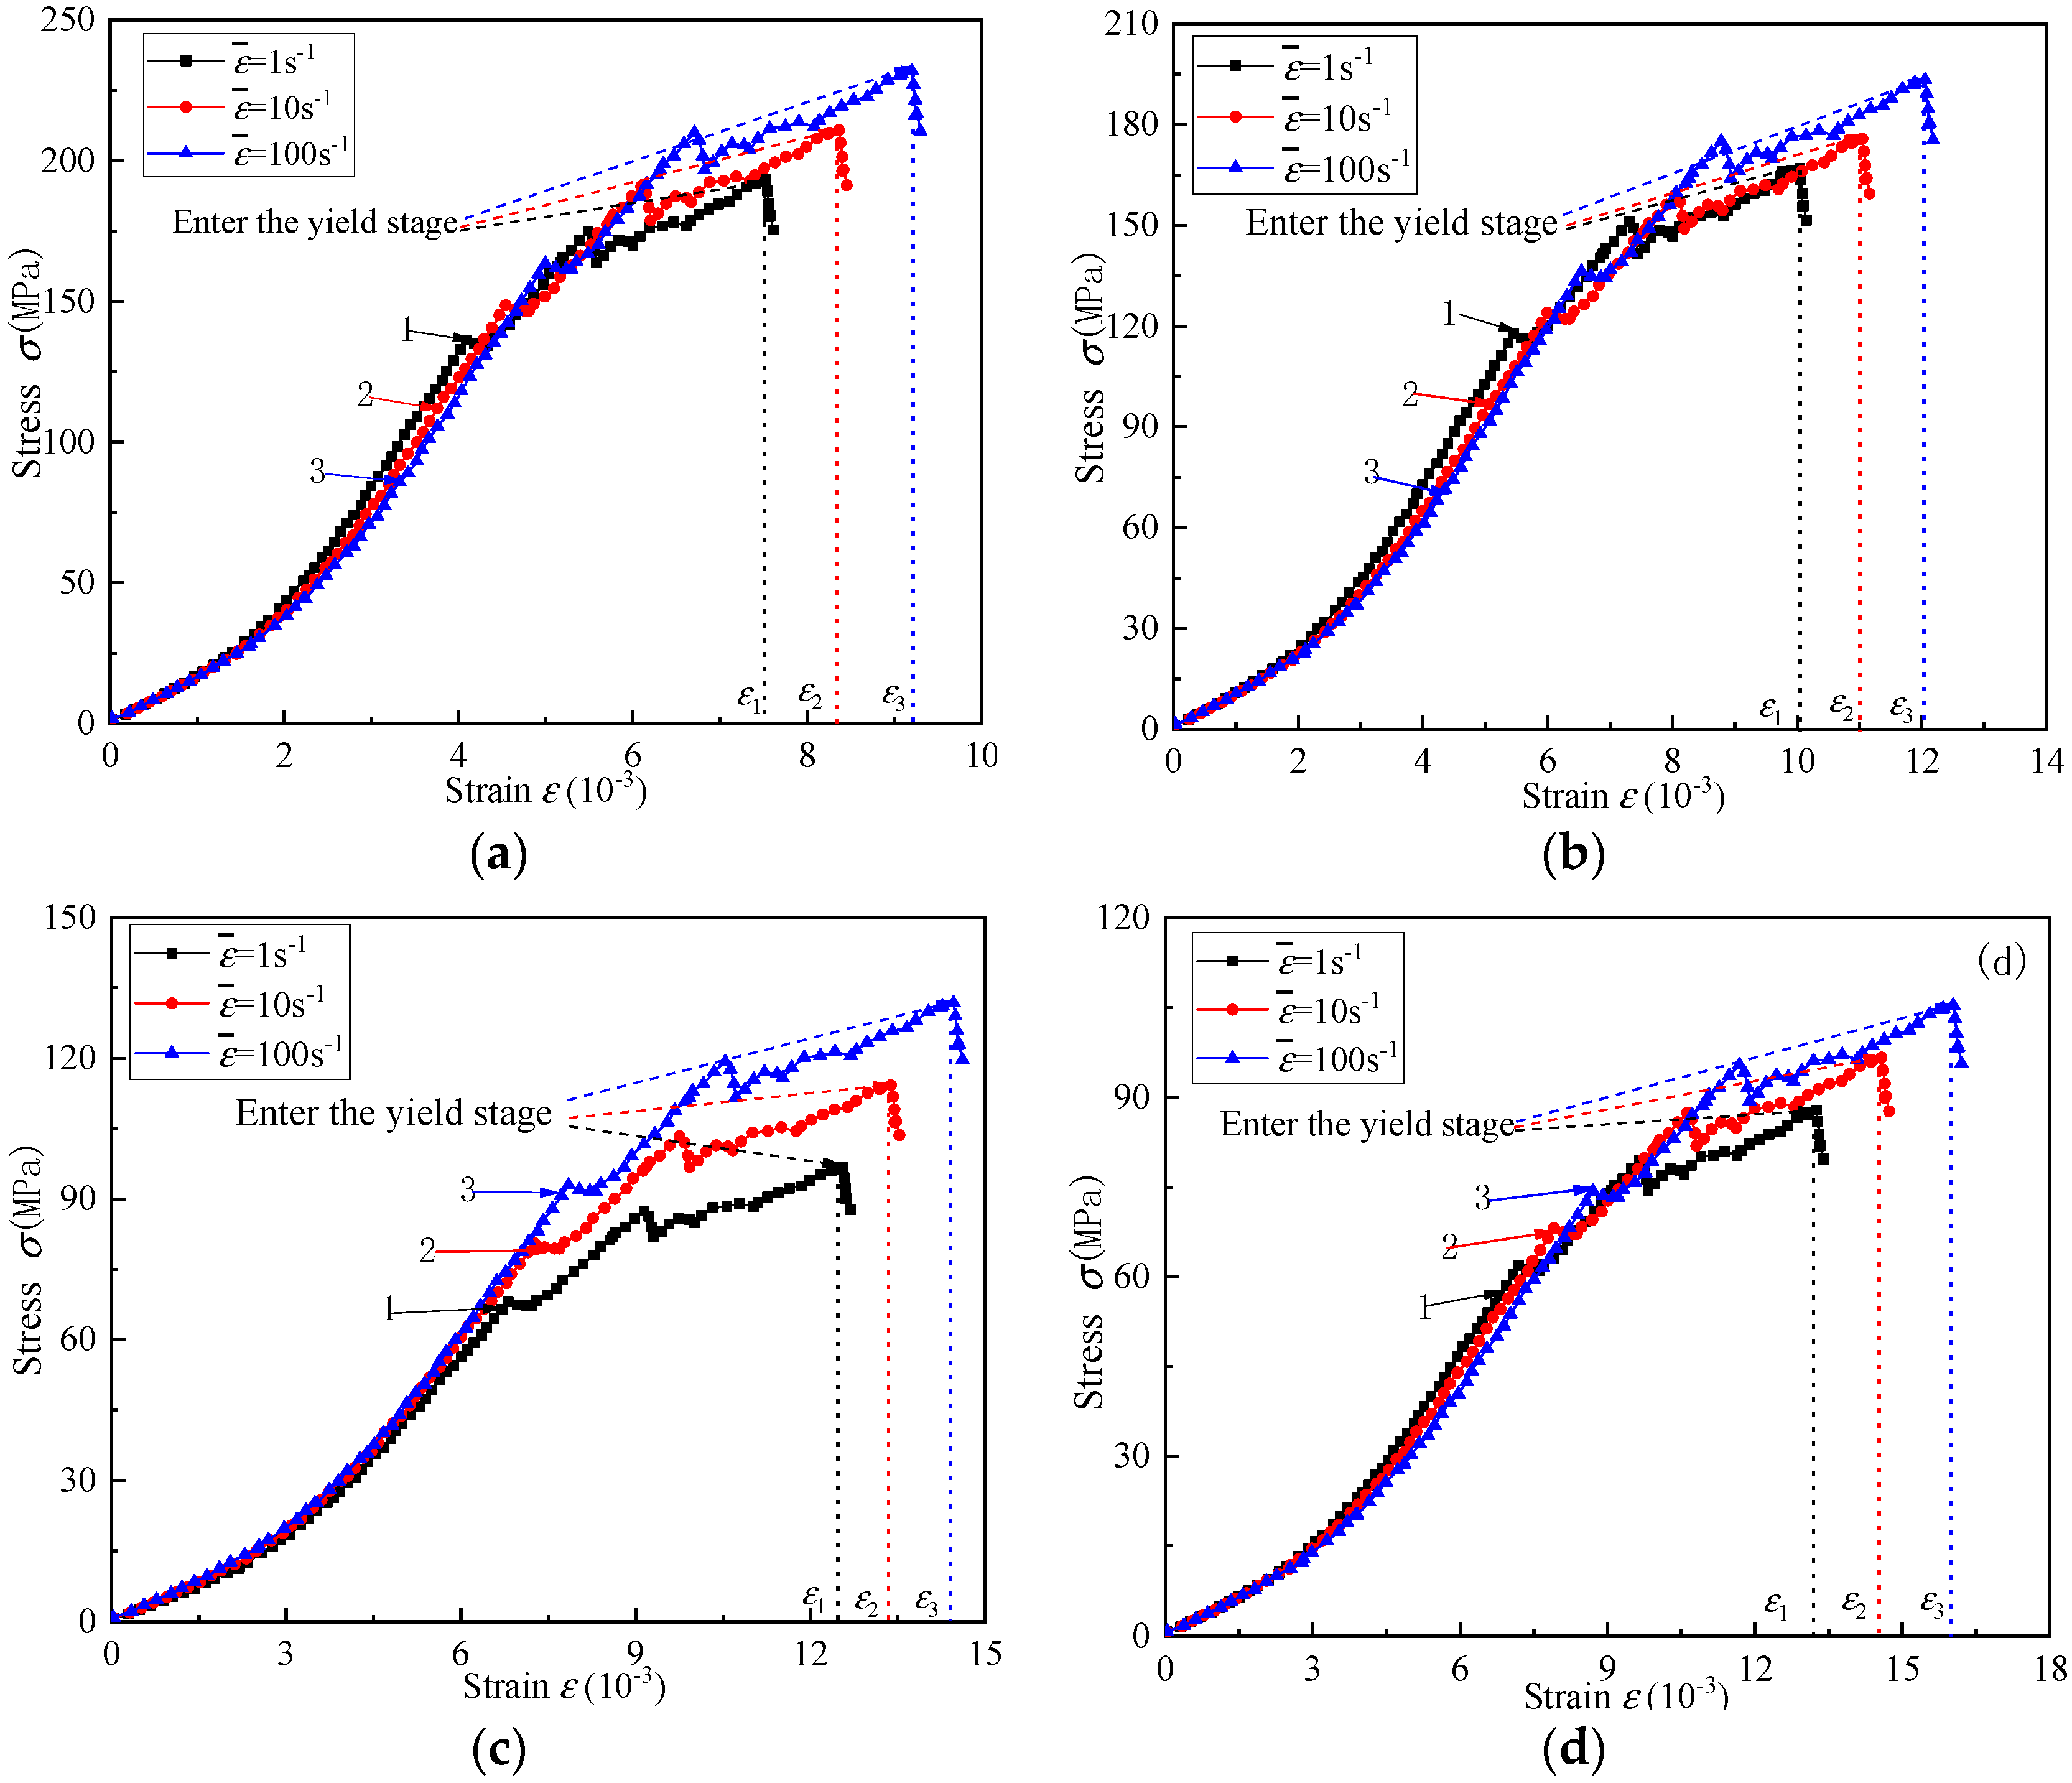
4.1.2. The SHPB Test with High Strain Rates
- The maximum stress in the three strain rates gradually decreases with a decrease in vertical wave velocities; thus, the damage variable and maximum strain increase. Furthermore, the differences in the maximum stress are due to the load strain rate. For D = 0.043, the differences in the maximum uniaxial compression becomes more obvious than for D = 0.357, 0.625, and 0.754.
- The value of the maximum compression stress in the load strain rate ε = 100 s−1 is 207 Mpa, which is 12.4%, and 15.6% higher than that in = 10 s−1 and 1 s−1, respectively. The strain strength of the maximum stress becomes greater for D = 0.754, and the value of the maximum strain in the load strain rate = 100 s−1 is 0.0117, which is 11.4% and 37.6% higher than that in = 10 s−1 and 1 s−1, respectively. The stress strength of limestone depends on the development of the microcracks and micropores in rock. The larger the initial damage degree is, the more complex the microcracks in the rock are, and the rock is more prone to failure under the same external load.
- The dynamic destructive stress at a low strain rate is less than the static destructive stress, while higher strain rates are greater than the static destructive stress. The dynamic destructive stress of the rock is much higher than the static destructive stress. The cracks are activated at low stress levels. In addition, the expansion and polymerization lead to the fracture of rock before the stress level extends to the other cracks.
4.2. Triaxial Compression Test
- The stress–strain curves can be divided into three stages: 1—the initial compression stage, 2—the line elasticity growth stage, and 3—the yield failure stage. The greater the surrounding pressure, the greater the peak stress and the strain corresponding to the peak stress.
- The principal stress increases with increasing confining pressure. For σ3 = 20 Mpa, the maximum principal stress is 214.685 Mpa of D = 0.043, which increases by 10.1%, 42.9%, and 57.1% for D = 0.357, 0.625, and 0.754, respectively. Moreover, for D = 0.043, the maximum principal stress is 154.573 Mpa of σ3 = 5 Mpa, which decreases by 10.0%, and 28.0% for σ3 = 10 Mpa and 20 Mpa, respectively. The confinement pressure inhibits the expansion of the microcracks in the limestone; thus, this affects the growth rate of the damage, which can delay the damage and strain softening of the rock. The side reinforcement behaviors of the confinement pressure are similar to the results reported by Palchik [52].
- The slope of the line elastic phase of σ3 = 5 Mpa is greater than that of σ3 = 10 Mpa, 20 Mpa and D = 0.043. The slopes of the line elastic phase for σ3 = 5 Mpa and σ3 = 10 Mpa are approximate. Furthermore, the differences in the slopes of the line elastic phase are due to the initial damage and are diminished with increases in the confinement pressure. In addition, for D = 0.625 and 0.754, the line elasticity growth stages of three confinement pressures are approximated, further indicating that the characteristics of the confinement pressure restrained microcrack expansion into the macroscopic crack. A significant initial damage means that the large defects of the internal cracks in the limestone lead to the decreased strength and damage generation within the triaxial compression test process.
5. Discussion
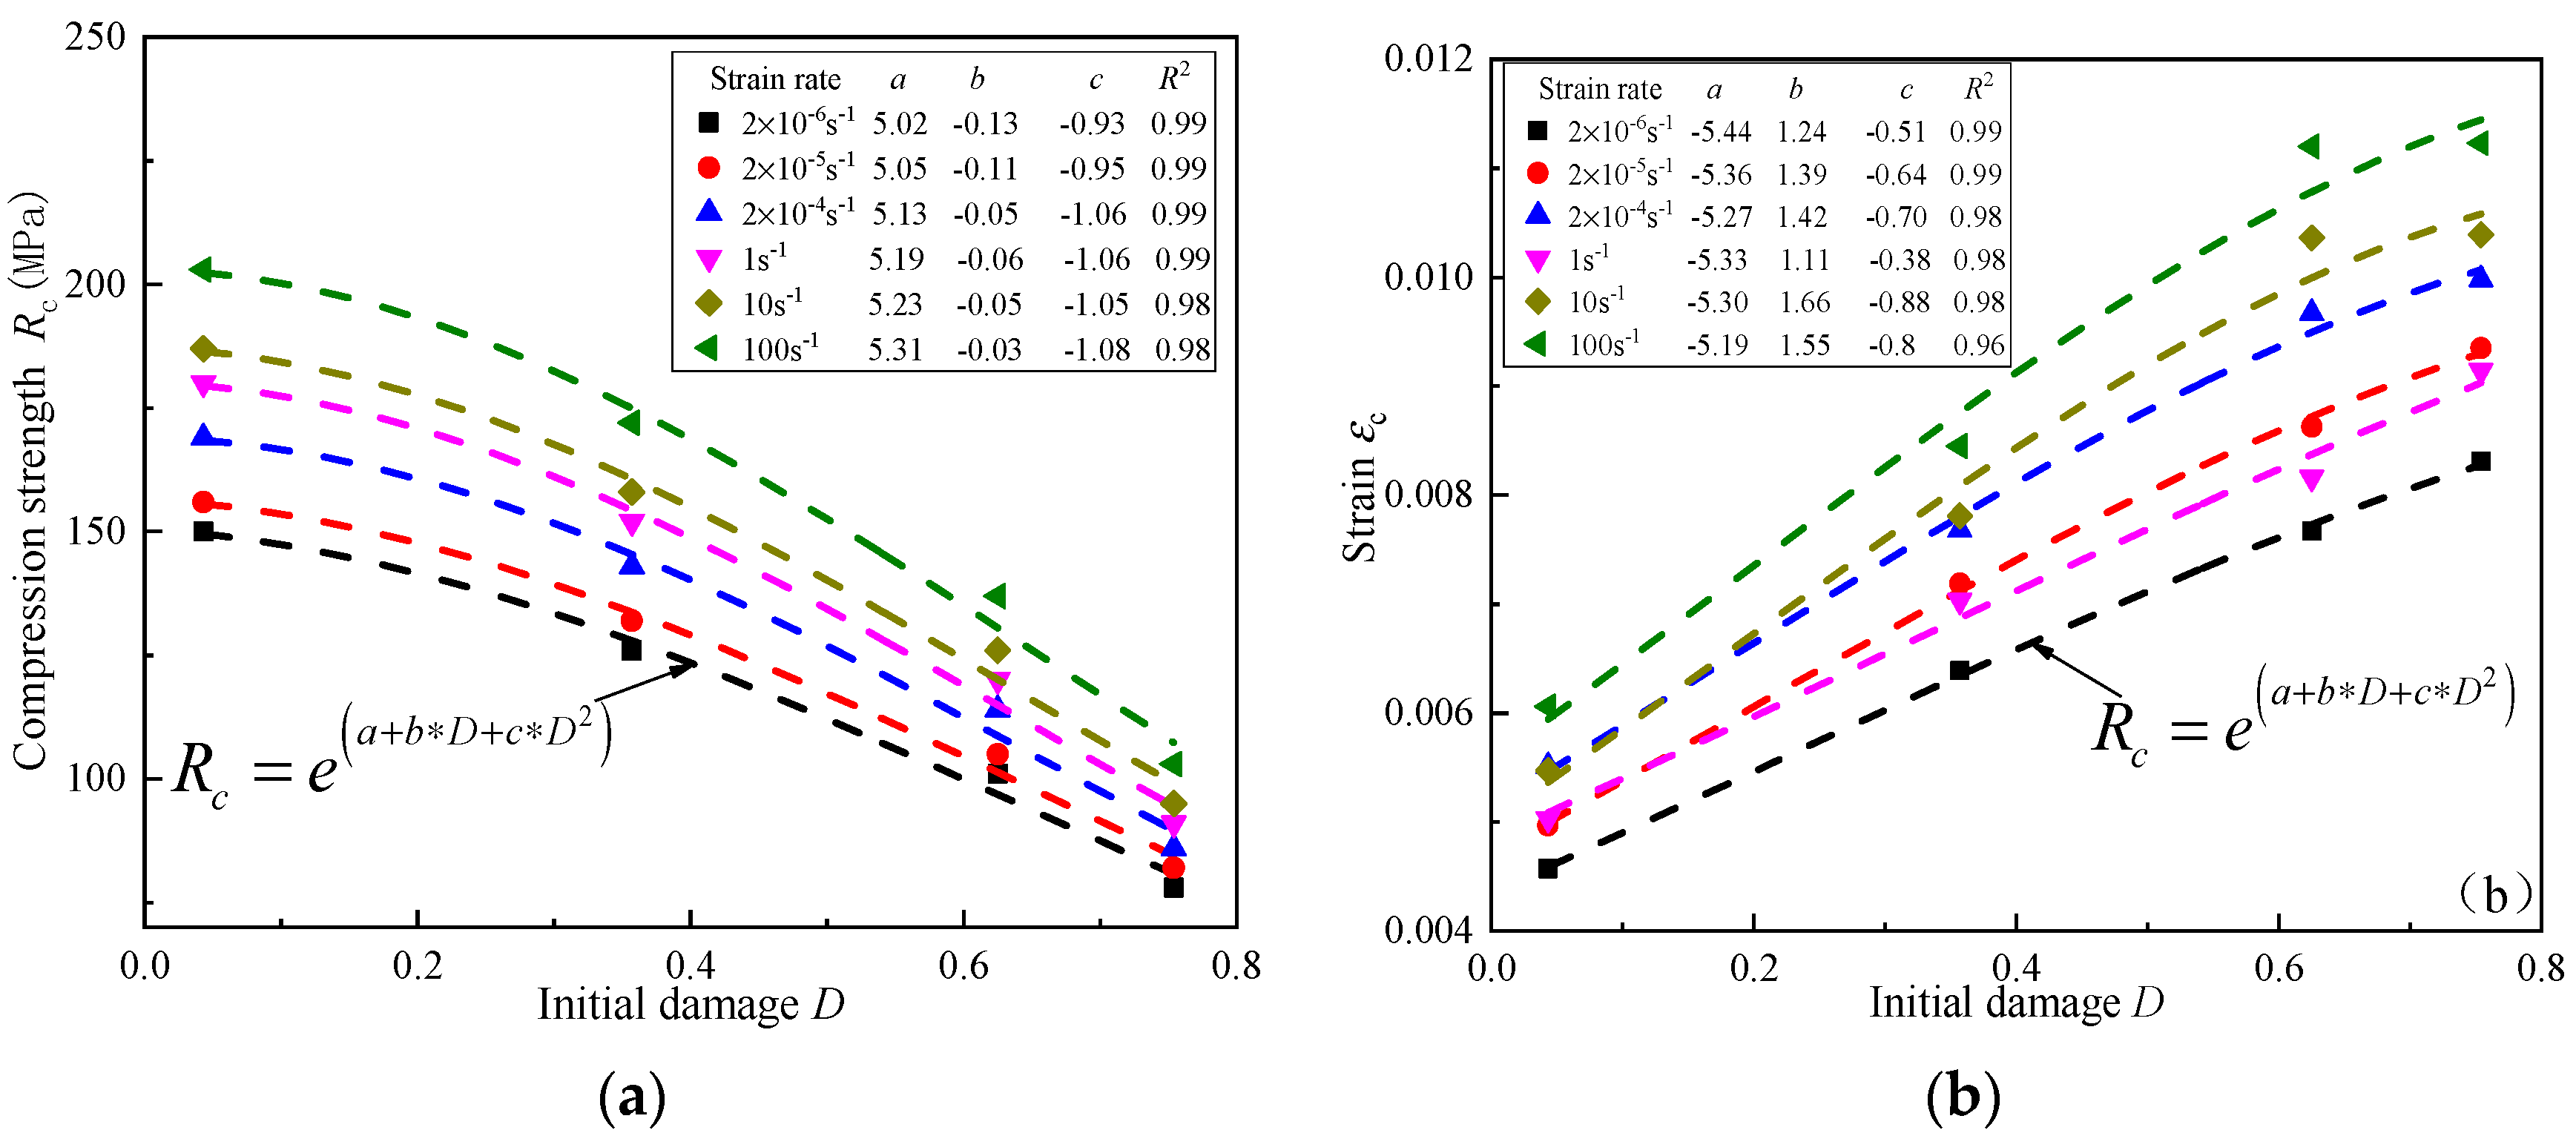
5.1. Compressive Strength and the Yield Strain
5.2. Modulus of Elasticity
5.3. Poisson’s Ratio
- The Poisson’s ratio decreases nonlinearly with respect to strain rate increases.
- The Poisson’s ratio is between 0.26 and 0.3, and the value of the maximum elastic modulus in D = 0.043 is 68 Gpa, which is 28.3%, 78.9%, and 195.7% higher than that in D = 0.357, 0.625, and 0.754, respectively. In addition, compared with the degree of the initial damage, the strain rate has little effect on the elastic modulus. In order to quantify the extent of the initial damage in the limestone compression behavior, a nonlinear relationship is applied and expressed as:
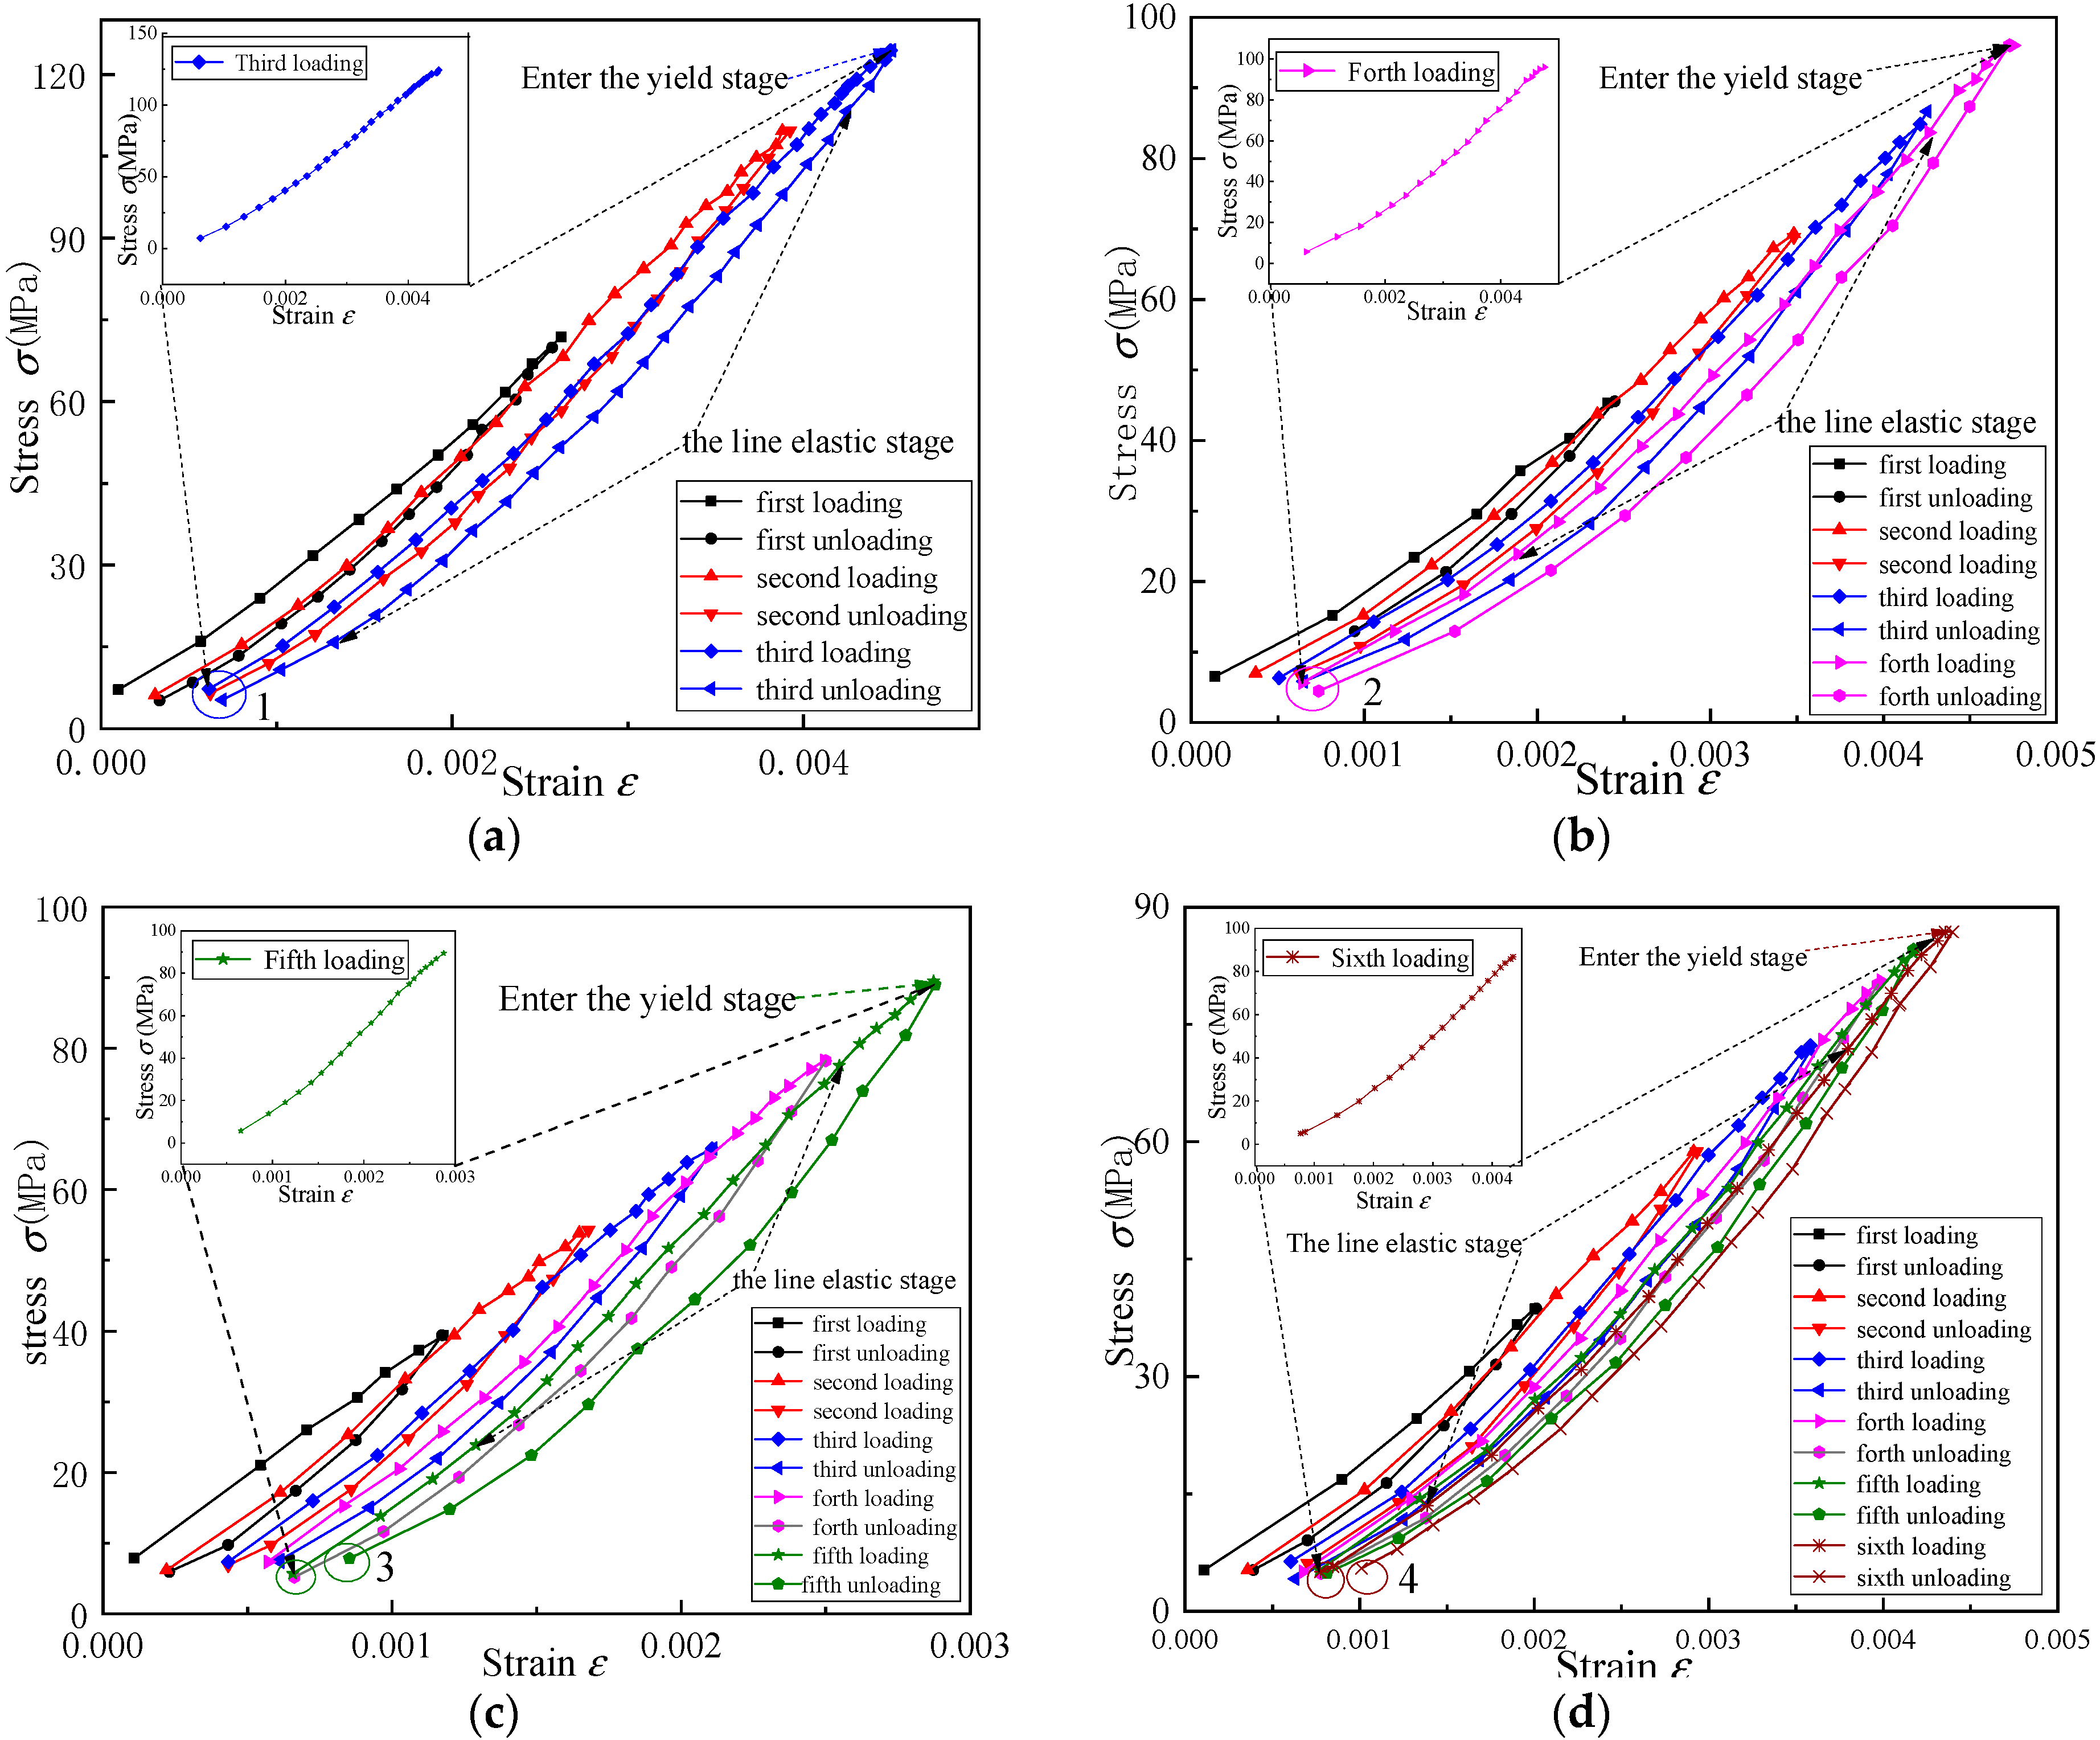
5.4. Comparison of the Two Initial Damage Determination Methods: Cyclic Loading-Unloading and Longitudinal Wave Speed
- The constant normal three, four, five, and six loading and unloading cycles were developed for four of the initial damaged rock samples. Herein, the difference between starting and ending strain values for the last loading is plastic strain εp, and the stress peak point strain in the yield phase is the total strain ε which were circled in the drawings 1–4. The final parameters and initial damage values are shown in Table 8. The initial damage calculated by the loading and unloading method is greater than that represented by the longitudinal wave velocity. The reason for this phenomenon is the plastic strain after unloading and is the total value of the original accumulated damage during loading, leading to a greater damage than that of the initial damage in the compression process.
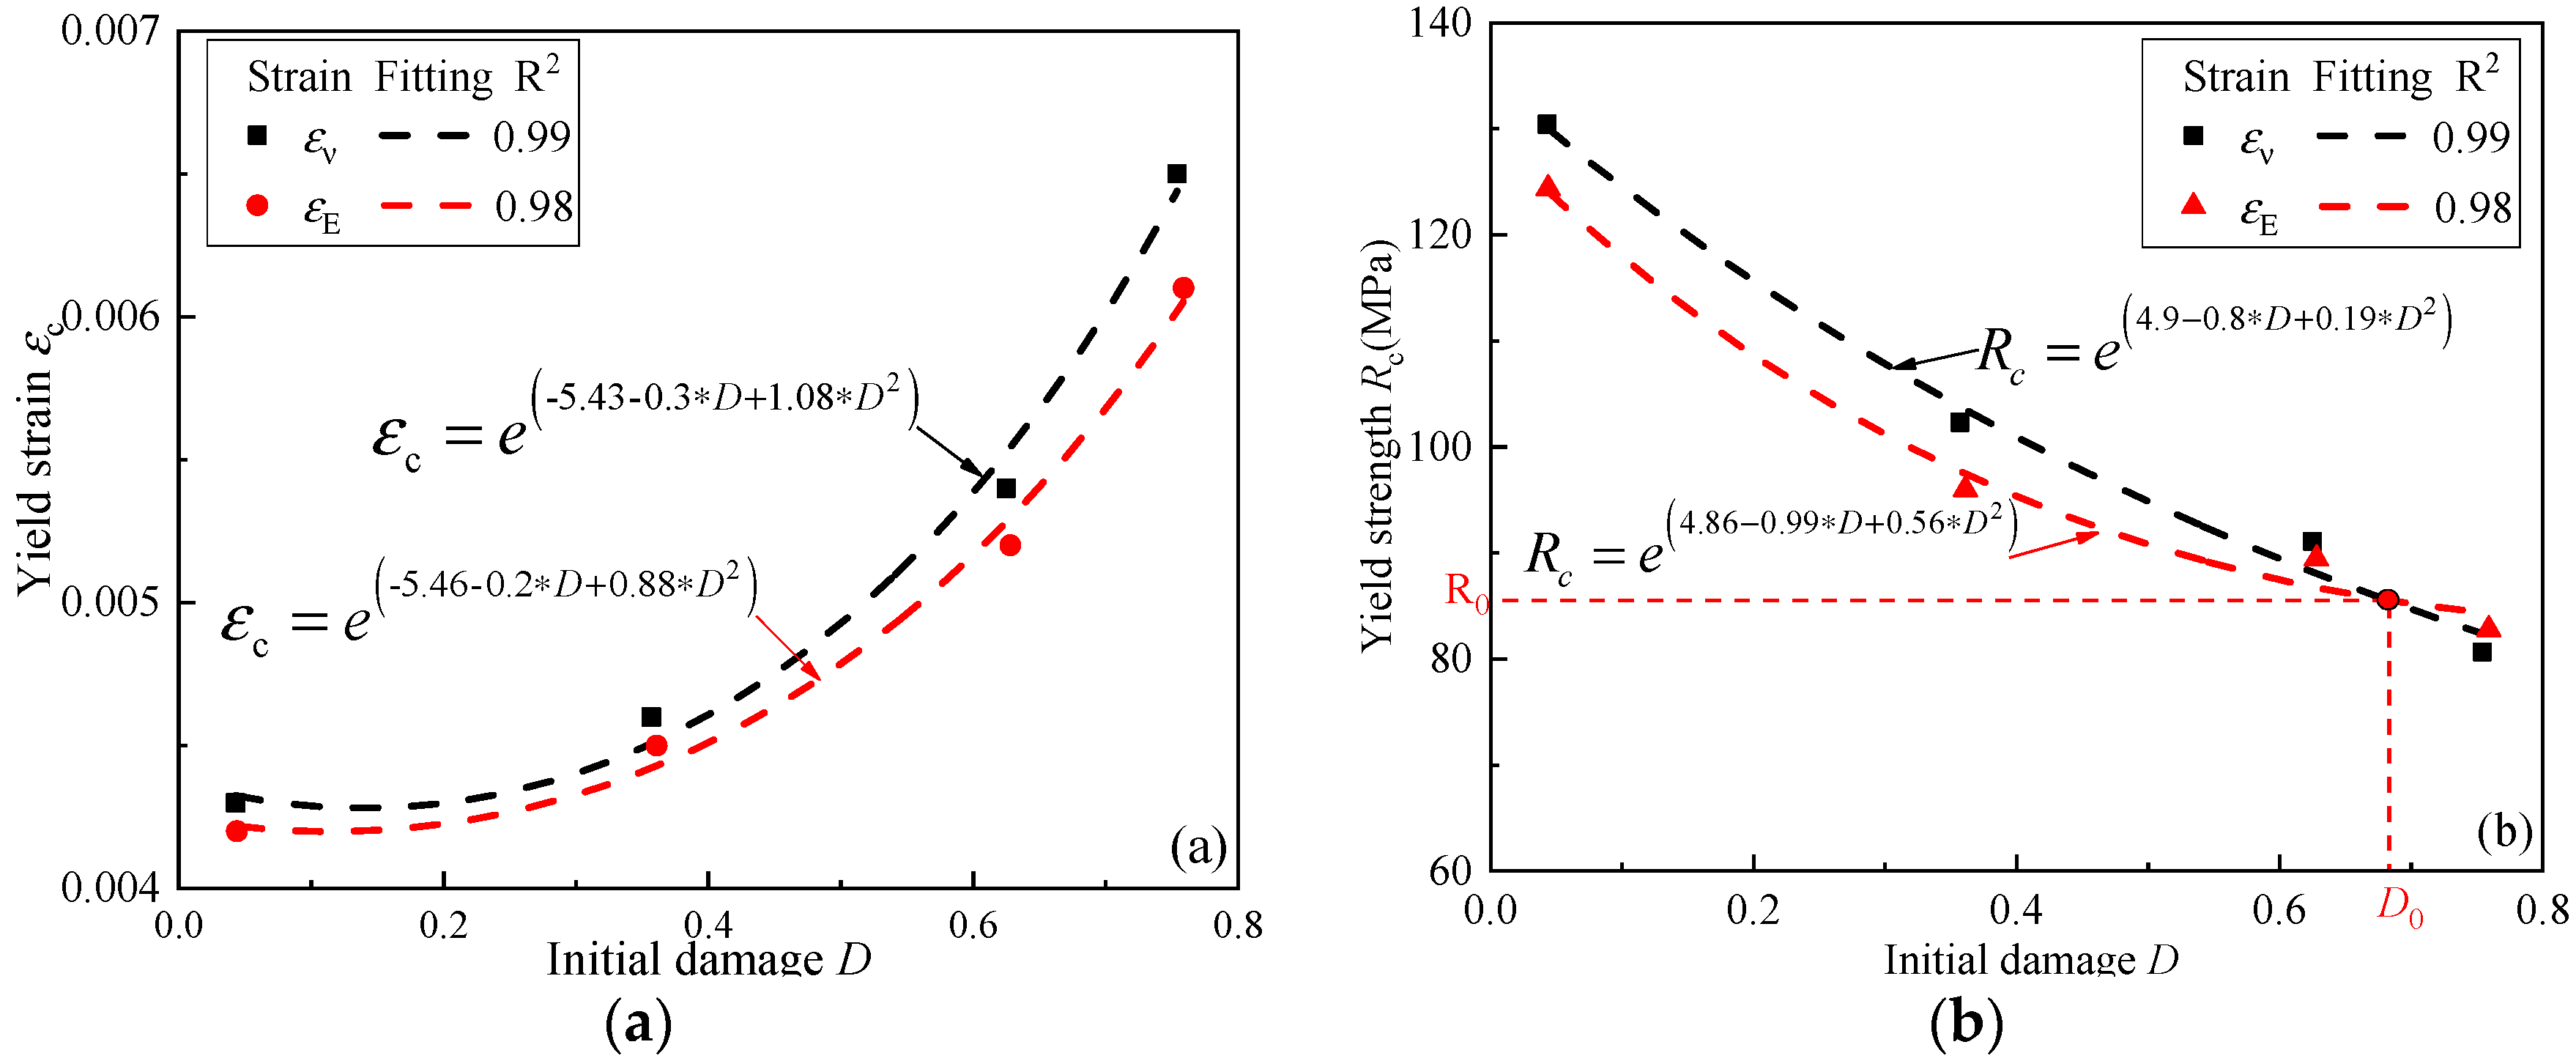
- The effects of two different initial damages on the compressive strength and destructive strain of limestone are illustrated. For = 2 × 10⁻⁶ s−1, the compressive strengths are 127.43 Mpa, 97.69 Mpa, 94.89 Mpa, and 82.56 Mpa for the initial damage D = 0.044, 0.361, 0.628, and 0.459, respectively. Additionally, the compressive strengths are 130.56 Mpa, 106.37 Mpa, 95.51 Mpa, and 81.23 MPa for the initial damages of 0.044, 0.361, 0.628, and 0.459, respectively.
- The difference of the corresponding compressive strengths of Dv and DE decreases as the degree of initial damage increases. When D enters the one initial damage D0, which is the initial damage boundary point, the two curves have an equal compressive strength of R0. In addition, the compressive strength obtained by the longitudinal wave velocity is larger than that obtained by the loading-unloading test.
- The yield-stage strain values of the four initial damage values in Figure 13a obtained by the longitudinal wave velocity method are on average 2% larger than those obtained from the loading-unloading method.
- The initial damage obtained by the loading-unloading method is lower than that obtained by the longitudinal wave velocity method. Based on the data analysis, two engineering practice suggestions for limestone have been given: (1) When the initial damage is less than the D0, the rock compressive strength value obtained by the loading-unloading method is relatively conservative. The results of the rock stability analysis obtained from this can be better combined with the stability analysis of underground excavation structures. (2) Conversely, when the initial damage is greater than D0, the compressive strength obtained by the longitudinal wave velocity method can be applied to the engineering practice.
5.5. Initial Damage Threshold Value of Different Strain Rates
- The peak compressive strength remains stable when the initial damage is minor. When the initial damage value reaches a particular value, the corresponding compressive strength begins to decrease dramatically, and the initial damage value reaches an inflection point, which is the initial damage threshold value, as shown by a red dotted line. The initial damage threshold values of the two loading strain rates ( = 100 s−1, 2 × 10⁻⁴ s−1) are and , and the values of and are 0.2 and 0.18, respectively.
- When the damage variable meets 0 < D < Dthr, the microcracks of the limestone expand stably, and the stress–strain curve is OB, which is shown in Figure 8. Furthermore, the compression peak stress point C is entered as the loading stress level increases. Moreover, when D > Dthr, the damage deterioration of the rock enters the macroscopic crack formation stage, which belongs to an unstable damage development stage.
5.6. Strain Softening Characteristics of Limestone
- The slopes of the four initial damages are −151, −130.2, −105.5, and −85.2, respectively. The decline rate of the stress peak curve slows down with an increase in the degree of initial damage. The complete rupture point and strain softening degree of rock is different under different initial damages. The strain softening degree and the brittleness of failure strain increases with an increasing of the softening modulus.
- With the increase in the initial damage the strain softening modulus of rock decreases, and the degree of strain softening increases. The failure ductility of the rock after peak stress is more apparent. Conversely, the smaller the initial damage degree is, the more pronounced the rock’s brittle failures are.
- For the rocks with four initial degrees of damage, the strain softening modulus is much larger than the corresponding initial damage elastic modulus, and the descending section of the stress–strain relationship curve is steeper than the ascending section. Therefore, the results obtained from the analysis of the strain softening properties reflect that the limestone in the experiment is a brittle failure rock. In order to quantify the extent of nonlinearity in the limestone compression behavior, a nonlinear relationship is applied and expressed as:
5.7. Application of Blasting Parameters Considering Initial Damage in Main Building Construction of Xi Luodu Hydropower Station
5.7.1. Field Measurements
5.7.2. Analysis of Single-Hole Blasting Damage Test Results
- The P-wave velocity at test points before and after presplitting blasting is shown in Figure 20. It can be seen that, with the increase in borehole depth, the longitudinal wave velocity increases nonlinearly, which is consistent with the above conclusion.
- The influence radius curve of single-hole blasting under different borehole longitudinal wave velocity as is shown in Figure 21a. The vibration accelerations in the vertical and horizontal directions under different longitudinal wave velocities are shown in Figure 21b. It can be seen that, with the increase in longitudinal wave velocity, the blasting influence radius and vibration acceleration decrease nonlinearly. The blasting influence radius is related to the rock strength. The larger the rock strength is, the smaller the blasting influence radius is under the same blasting condition, that is, the nonlinear relationship between rock strength and longitudinal wave velocity is proved.
6. Conclusions
- With the increasing degree of longitudinal wave speed, the initial damage decreases nonlinearly and remains constant when entering 6000 m/s, indicating the correlation between the initial damage degree of limestone and the location depth.
- The compression strength and modulus of elasticity decrease nonlinearly with increasing initial damage and increase nonlinearly with an increasing strain rate. Conversely, the failure strain increases nonlinearly with increasing initial damage and strain rate. The Poisson’s ratio changes slightly with the increase in initial damage and strain rates. Moreover, an empirical formula for describing the nonlinear relationship between initial damage and strength is presented and verified by an engineering example. The threshold of the damage variable of the limestone under the initial damage state is proposed, indicating that the initial damage value corresponds to the stress peak during the compression deformation of the nondestructive limestone. The initial strain threshold at a high strain rate of ε = 100 s−1 is approximately = 0.2, which is 0.02 higher than that at a low strain rate of ε = 2 × 10⁻⁴ s−1. When the threshold of initial damage of limestone is less than 0.18, the compressive strength of the limestone is found to meet the engineering requirements.
- As the initial damage increases, the strain softening modulus of the limestone decreases; thus, the fragility of the limestone decreases after the peak stress. With different initial degrees of damage of the rock, the strain softening modulus is much larger than the corresponding initial damage of the elastic modulus. The descending section of the stress–strain curve is steeper than the rising section, so the conclusions obtained by the strain softening analysis reflect the brittle characteristics of the rock.
- The initial damage modulus defined based on the longitudinal wave velocity can be applied to understand the compression strength properties of rock, and it also has a certain reference value for the study of damage constitutive theory. It should be noted that while the definition of initial damage proposed in this paper has provided useful insights for the construction of the rock damage constitutive model, the determination of damage degree requires accurate analysis and evaluation on the number, spacing, angle and other factors of cracks. The above conclusions are only valid for the qualitative analysis of initial damage, or simple semi-quantitative analysis, and without sufficient field verification. Further numerical model analysis is suggested to determine a more perfect initial damage model to reasonably determine the long-term damage characteristics of rock for engineering applications.
Author Contributions
Funding
Institutional Review Board Statement
Informed Consent Statement
Data Availability Statement
Acknowledgments
Conflicts of Interest
References
- Brantut, N.; Heap, M.; Meredith, P.; Baud, P. Time-dependent cracking and brittle creep in crustal rocks: A review. J. Struct. Geol. 2013, 52, 17–43. [Google Scholar] [CrossRef]
- Liu, C.; Yao, C.; Zhang, S.; Cheng, Y.; Nie, Q.; Liu, Z. Research status and Prospect of initial damage of rock mass in laboratory. IOP Conf. Ser. Earth Environ. Sci. 2021, 632, 022030. [Google Scholar] [CrossRef]
- Diederichs, M.S. The 2003 Canadian Geotechnical Colloquium: Mechanistic interpretation and practical application of damage and spalling prediction criteria for deep tunnelling. Can. Geotech. J. 2007, 44, 1082–1116. [Google Scholar] [CrossRef]
- Chandler, N.A. Quantifying long-term strength and rock damage properties from plots of shear strain versus volume strain. Int. J. Rock Mech. Min. Sci. 2013, 59, 105–110. [Google Scholar] [CrossRef]
- Perras, M.A.; Diederichs, M.S. Predicting excavation damage zone depths in brittle rocks. J. Rock Mech. Geotech. Eng. 2016, 8, 60–74. [Google Scholar] [CrossRef] [Green Version]
- Hudson, J.A. Design methodology for the safety of underground rock engineering. J. Rock Mech. Geotech. Eng. 2012, 4, 205–214. [Google Scholar] [CrossRef] [Green Version]
- Akdag, S.; Karakus, M.; Taheri, A.; Nguyen, G.; Manchao, H. Effects of thermal damage on dtrain burst mechanism for brittle rocks under true-triaxial loading conditions. Rock Mech. Rock Eng. 2018, 51, 1657–1682. [Google Scholar] [CrossRef]
- Kim, J.; Yi, J.; Kim, J.; Zi, G.; Kong, J.S. Fatigue life prediction methodology using entropy index of stress interaction and crack severity index of effective stress. Int. J. Damage Mech. 2013, 22, 375–392. [Google Scholar] [CrossRef]
- Diederichs, M.; Kaiser, P.; Eberhardt, E. Damage initiation and propagation in hard rock during tunnelling and the influence of near-face stress rotation. Int. J. Rock Mech. Min. Sci. 2004, 41, 785–812. [Google Scholar] [CrossRef]
- Recent Trends in Fracture and Damage Mechanics; Hütter, G.; Zybell, L. (Eds.) Springer Science and Business Media LLC.: Berlin, Germany, 2016. [Google Scholar]
- Kachanov, L.M.; Krajcinovic, D. Introduction to Continuum Damage Mechanics. J. Appl. Mech. 1987, 54, 481. [Google Scholar] [CrossRef] [Green Version]
- Lemaitre, J. How to use damage mechanics. Nucl. Eng. Des. 1984, 80, 233–245. [Google Scholar] [CrossRef]
- Jeon, S.; Kim, J.; Seo, Y.; Hong, C. Effect of a fault and weak plane on the stability of a tunnel in rock—a scaled model test and numerical analysis. Int. Rock Mech. Min. J. 2004, 41, 486. [Google Scholar] [CrossRef]
- Yavuz, H. Effect of freeze–thaw and thermal shock weathering on the physical and mechanical properties of an andesite stone. Bull. Int. Assoc. Eng. Geol. 2010, 70, 187–192. [Google Scholar] [CrossRef]
- Lim, S.S.; Martin, C.D.; Åkesson, U. In-situ stress and microcracking in granite cores with depth. Eng. Geol. 2012, 147, 1–13. [Google Scholar] [CrossRef]
- Sousa, L.M.O.; Suárez, D.; Río, L.M.; Calleja, L.; Ruiz, V.G.; Rey, A.R. Influence of microfractures and porosity on the physico-mechanical properties and weathering of ornamental granites. Eng. Geol. 2005, 77, 153–168. [Google Scholar] [CrossRef] [Green Version]
- Wang, Z.-L.; Li, Y.-C.; Wang, J. A damage-softening statistical constitutive model considering rock residual strength. Comput. Geosci. 2007, 33, 1–9. [Google Scholar] [CrossRef]
- Sufian, A.; Russell, A.R. Microstructural pore changes and energy dissipation in Gosford sandstone during pre-failure loading using X-ray CT. Int. J. Rock Mech. Min. Sci. 2013, 57, 119–131. [Google Scholar] [CrossRef]
- De Kock, T.; Boone, M.A.; Schryver, T.D.; Stappen, J.V.; Derluyn, H.; Masschaele., B.; Schutter, G.D.; Cnudde, V. A pore-scale study of fracture dynamics in rock using X-ray micro-CT under ambient freeze-thaw cycling. Environ. Sci. Technol. 2015, 49, 67–74. [Google Scholar] [CrossRef] [PubMed]
- Palchik, V. Mechanical Behavior of Carbonate Rocks at Crack Damage Stress Equal to Uniaxial Compressive Strength. Rock Mech. Rock Eng. 2009, 43, 497–503. [Google Scholar] [CrossRef]
- Saeedifar, M.; Zarouchas, D. Damage characterization of laminated composites using acoustic emission: A review. Compos. Part B Eng. 2020, 195, 108039. [Google Scholar] [CrossRef]
- Shkuratnik, V.L.; Filimonov, Y.L.; Kuchurin, S.V. Regularities of acoustic emission in coal samples under triaxial compression. J. Min. Ence. 2005, 41, 44–52. [Google Scholar] [CrossRef]
- Eberhardt, E.; Stead, D.; Stimpson, B. Quantifying progressive pre-peak brittle fracture damage in rock during uniaxial com-pression. Int. J. Rock Mech. Min. Sci. 1999, 36, 361–380. [Google Scholar] [CrossRef]
- Rudajev, V.; Vilhelm, J.; Lokajıček, T. Laboratory studies of acoustic emission prior to uniaxial compressive rock failure. Int. J. Rock Mech. Min. Sci. 2000, 37, 699–704. [Google Scholar] [CrossRef]
- Wasantha, P.; Ranjith, P.; Shao, S. Energy monitoring and analysis during deformation of bedded-sandstone: Use of acoustic emission. Ultrasonics 2014, 54, 217–226. [Google Scholar] [CrossRef]
- Yavuz, H.; Altindag, R.; Sarac, S.; Ugur, I.; Sengun, N. Estimating the index properties of deteriorated carbonate rocks due to freezethaw and ther-mal shock weathering. Int. J. Rock Mech. Min. Sci. 2006, 43, 767–775. [Google Scholar] [CrossRef]
- Eberhardt, E.; Stead, D.; Stimpson, B. Effects of sample disturbance on the stress-induced microfracturing characteristics of brittle rock. Can. Geotech. J. 1999, 36, 239–250. [Google Scholar] [CrossRef]
- Otto, S.; Popp, T.; Kern, H. Development of damage and permeability in deforming rock salt. Eng. Geol. 2001, 61, 163–180. [Google Scholar]
- Takarli, M.; Prince, W.; Siddique, R. Damage in granite under heating/cooling cycles and water freeze–thaw condition. Int. J. Rock Mech. Min. Sci. 2008, 45, 1164–1175. [Google Scholar] [CrossRef]
- Carpinteri, A.; Lacidogna, G.; Accornero, F.; Mpalasks, A.C.; Aggelis, D.G. Influence of damage in the acoustic emission parameters. Cem. Concr. Compos. 2013, 44, 9–16. [Google Scholar] [CrossRef]
- Gokceoglu, C.; Zorlu, K.; Ceryan, S.; Nefeslioglu, H.A. A comparative study on indirect determination of degree of weathering of gran-ites from some physical and strength parameters by two soft computing techniques. Mater. Charact. 2009, 60, 1317–1327. [Google Scholar] [CrossRef]
- Denoual, C.; Hild, F. A damage model for the dynamic fragmentation of brittle solids. Comput. Methods Appl. Mech. Eng. 2000, 183, 247–258. [Google Scholar] [CrossRef] [Green Version]
- Mizuno, M.; Okayasu, M.; Odagiri, N. Damage evaluation of piezoelectric ceramics from thevariation of the elastic coefficient under static compressive stress. Int. J. Damage Mech. 2010, 19, 375–390. [Google Scholar] [CrossRef]
- Nicksiar, M.; Martin, C.D. Factors affecting crackinitiation in low porosity crystalline rocks. Rock Mech. Rock Eng. 2014, 47, 1165–1181. [Google Scholar] [CrossRef]
- Aydan, Ö.; Ito, T.; Özbay, U.; Kwasniewski, M.; Shariar, K.; Okuno, T.; Özgenoğlu, A.; Malan, D.F.; Okada, T. ISRM Suggested Methods for Determining the Creep Characteristics of Rock. Rock Mech. Rock Eng. 2013, 47, 275–290. [Google Scholar] [CrossRef] [Green Version]
- Mansouri, H.; Ajalloeian, R. Mechanical behavior of salt rock under uniaxial compression and creep tests. Int. J. Rock Mech. Min. Sci. 2018, 110, 19–27. [Google Scholar] [CrossRef]
- Fahimifar, A.; Karami, M.; Fahimifar, A. Modifications to an elasto-visco-plastic constitutive model for prediction of creep de-formation of rock samples. Soils Found. 2015, 55, 1364–1371. [Google Scholar] [CrossRef] [Green Version]
- Kachanov, M. On theconcept of damage in creep and in the brittle-elastic rang. Int. J. Damage Mech. 1994, 3, 329–337. [Google Scholar] [CrossRef]
- Gatelier, N.; Pellet, F.; Loret, B. Mechanical damage of an anisotropic porous rock in cyclic triaxial tests. Int. J. Rock Mech. Min. Sci. 2002, 39, 335–354. [Google Scholar] [CrossRef]
- Heo, J.S.; Lee, C.I.; Jeon, S.K. Measurement of Acoustic Emission and Source Location Considering Anisotropy of Rock under Triaxial Compression. Key Eng. Mater. 2004, 270–273, 1574–1579. [Google Scholar] [CrossRef]
- Ghazvinian, E.; Perras, M.; Diederichs, M. Formalized approaches to defining damage thresholds in brittle rock: Granite and limestone. In Proceedings of the 46th US Rock Mechanics Geomechanics Symposium, Chicago, IL, USA, 24–27 June 2012. [Google Scholar]
- Doan, M.-L.; D’Hour, V. Effect of initial damage on rock pulverization along faults. J. Struct. Geol. 2012, 45, 113–124. [Google Scholar] [CrossRef]
- Bayram, F. Predicting mechanical strength loss of natural stones after freeze–thaw in cold regions. Cold Reg. Sci. Technol. 2012, 83-84, 98–102. [Google Scholar] [CrossRef]
- Murakami, S. Continuum Damage Mechanics. Intern. Var. Thermoelast. 2012, 185, 1–431. [Google Scholar] [CrossRef]
- Zhu, C.Y.; Yu, S.C. Study on discrimination method of rock mass damage caused by blasting. Eng. Blasting 2001, 1, 12–16. [Google Scholar]
- Zhang, H.; Guo, P.; Wang, Y.; Zhao, Y.; Lin, H.; Liu, Y.; Shao, Y. Fracture Behavior of Rock with Initial Damage: Theoretical, Experimental, and Numerical Investigations. Geofluids 2020, 2020, 1–9. [Google Scholar] [CrossRef]
- Tarasov, B.G. Simplified method for determining the extent to which strain rate affects the strength and energy capacity of rock fracture. J. Min. Sci. 1990, 26, 315–320. [Google Scholar] [CrossRef]
- Zhang, H.; Ping, Q.; Su, H.P. Dynamic compression SHPB test of limestone with different aspect ratios. Coal Sci. Technol. 2018, 46, 38–43. [Google Scholar] [CrossRef]
- Fakhimi, A.; Hemami, B. Axial splitting of rocks under uniaxial compression. Int. J. Rock Mech. Min. Sci. 2015, 79, 124–134. [Google Scholar] [CrossRef]
- Hemami, B. Rock-loading machine interaction in uniaxial compression test. Diss. Theses-Gradworks. 2015, 81, 152–169. [Google Scholar]
- Hidalgo, K.P.; Nordlund, E. Comparison between stress and strain quantities of the failure deformation process of fen-noscandian hard rocks using geological information. Rock Mech. Rock Eng. 2013, 46, 41–51. [Google Scholar] [CrossRef]
- Palchik, V.; Hatzor, Y. Crack damage stress as a composite function of porosity and elastic matrix stiffness in dolomites and limestones. Eng. Geol. 2002, 63, 233–245. [Google Scholar] [CrossRef]
- Hamza, O.; Stace, R. Creep properties of intact and fractured muddy siltstone. Int. J. Rock Mech. Min. Sci. 2018, 106, 109–116. [Google Scholar] [CrossRef] [Green Version]


| Mineral Composition | Percentage Weight (%) | |
|---|---|---|
| Component | calcite | 92 |
| dolomite | 3 | |
| irony | 2 | |
| clay | 2 | |
| others | 1 | |
| Property | Average | Range |
|---|---|---|
| Initial density (g/cm3) | 2.76 | 2.68–2.81 |
| Natural moisture content (%) | 1.9 | 1.1–2.7 |
| Cohesive force (MPa) | 27 | 21–35 |
| Frictional angle (°) | 33 | 28–37 |
| Poisson’s ratio | 0.27 | 0.25–0.31 |
| No | ν′ | Average | No | ν′ | Average | No | ν′ | Average | No | ν′ | Average | No | ν′ | Average |
|---|---|---|---|---|---|---|---|---|---|---|---|---|---|---|
| A1 | 2823 | 2976 | B1 | 3230 | 3365 | C1 | 3564 | 3675 | D1 | 3952 | 4811 | E1 | 5599 | 5871 |
| A2 | 2846 | B2 | 3250 | C2 | 3602 | D2 | 4150 | E2 | 5645 | |||||
| A3 | 2875 | B3 | 3298 | C3 | 3624 | D3 | 4221 | E3 | 5742 | |||||
| A4 | 2902 | B4 | 3311 | C4 | 3649 | D4 | 4465 | E4 | 5778 | |||||
| A5 | 2940 | B5 | 3326 | C5 | 3672 | D5 | 4723 | E5 | 5891 | |||||
| A6 | 2961 | B6 | 3348 | C6 | 3688 | D6 | 4904 | E6 | 5911 | |||||
| A7 | 2986 | B7 | 3369 | C7 | 3693 | D7 | 5021 | E7 | 5946 | |||||
| A8 | 3010 | B8 | 3389 | C8 | 3702 | D8 | 5086 | E8 | 5979 | |||||
| A9 | 3054 | B9 | 3426 | C9 | 3721 | D9 | 5126 | E9 | 5982 | |||||
| A10 | 3097 | B10 | 3475 | C10 | 3740 | D10 | 5242 | E10 | 5990 | |||||
| A11 | 3104 | B11 | 3480 | C11 | 3780 | D11 | 5367 | E11 | 5992 | |||||
| A12 | 3114 | B12 | 3485 | C12 | 3797 | D12 | 5478 | E12 | 5997 |
| Depth(m) | Item | V (m/s) | D | |
|---|---|---|---|---|
| 85–85.9 | Maximum | 2.65 | 3114 | 0.730 |
| Minimum | 2.63 | 2823 | 0.779 | |
| Mean | 2.635 | 2976 | 0.754 | |
| 87–88.5 | Maximum | 2.71 | 3485 | 0.663 |
| Minimum | 2.69 | 3230 | 0.710 | |
| Mean | 2.7 | 3365 | 0.685 | |
| 88.5–89.9 | Maximum | 2.75 | 3797 | 0.601 |
| Minimum | 2.71 | 3564 | 0.647 | |
| Mean | 2.74 | 3675 | 0.625 | |
| 91.2–93.5 | Maximum | 2.79 | 5478 | 0.166 |
| Minimum | 2.77 | 3952 | 0.566 | |
| Mean | 2.78 | 4811 | 0.357 | |
| 95.2–97.9 | Maximum | 2.81 | 5997 | 0.009 |
| Minimum | 2.78 | 5599 | 0.129 | |
| Mean | 2.79 | 5871 | 0.043 |
| No. | Test Type | D | σ3/MPa | Strain Rate/s | Criterion for End |
|---|---|---|---|---|---|
| 1 | Uniaxial compression | 0.754 | 0 | 2 × 10⁻⁶; 2 × 10⁻⁵; 2 × 10⁻⁴ | Deformation displacement |
| 0.625 | |||||
| 0.357 | |||||
| 0.043 | |||||
| 2 | Triaxial compression | 0.754 | 5;10;20 | 2 × 10⁻⁶ | Axial strain |
| 0.625 | |||||
| 0.357 | |||||
| 0.043 |
| No. | Test Type | D | Criterion for End | |
|---|---|---|---|---|
| 1 | Stress–strain | 0.754 | 1;10;100 | Axial strain |
| 2 | 0.625 | |||
| 3 | 0.357 | |||
| 4 | 0.043 |
| No | ||||
|---|---|---|---|---|
| 0.043 | 5 | 154.573 | 27.615 | 25.4 |
| 10 | 171.748 | 32.956 | 35.2 | |
| 20 | 214.685 | 40.074 | 37.3 | |
| 0.357 | 5 | 136.618 | 26.880 | 24.3 |
| 10 | 156.134 | 29.512 | 34.0 | |
| 20 | 195.168 | 38.466 | 40.1 | |
| 0.625 | 5 | 122.956 | 22.576 | 16.6 |
| 10 | 136.618 | 26.375 | 25.5 | |
| 20 | 150.279 | 28.721 | 26.4 | |
| 0.754 | 5 | 98.365 | 19.157 | 16.3 |
| 10 | 122.956 | 22.675 | 16.8 | |
| 20 | 136.618 | 26.421 | 25.6 |
| No | Parameter | DE | Dv | |||
|---|---|---|---|---|---|---|
| ε | εp | E’ | E | |||
| 1 | 0.0042 | -4 | 31.98 | 33.45 | 0.044 | 0.043 |
| 2 | 0.0045 | 0.96 -4 | 17.67 | 27.65 | 0.361 | 0.357 |
| 3 | 0.0052 | 1.12 -4 | 7.52 | 20.21 | 0.628 | 0.625 |
| 4 | 0.0061 | 1.62 -4 | 4.81 | 19.96 | 0.759 | 0.754 |
| No | Rc (mpa) | ε | |
|---|---|---|---|
| Dv | 0.043 | 130.56 | 0.0043 |
| 0.357 | 106.37 | 0.0045 | |
| 0.625 | 95.51 | 0.0052 | |
| 0.754 | 81.23 | 0.0064 | |
| DE | 0.044 | 127.43 | 0.0042 |
| 0.361 | 97.69 | 0.0044 | |
| 0.628 | 94.89 | 0.0051 | |
| 0.759 | 82.56 | 0.0061 | |
| ε/s−1 | D | η | ε/s−1 | D | η |
|---|---|---|---|---|---|
| 2 × 10⁻⁶ | 0.043 | 37.102 | 1 | 0.034 | 36.224 |
| 0.357 | 31.178 | 0.357 | 30.884 | ||
| 0.625 | 18.853 | 0.625 | 16.744 | ||
| 0.754 | 15.376 | 0.754 | 14.148 | ||
| 2 × 10⁻⁴ | 0.043 | 28.822 | 100 | 0.043 | 29.825 |
| 0.357 | 24.816 | 0.357 | 25.922 | ||
| 0.625 | 15.551 | 0.625 | 15.824 | ||
| 0.754 | 11.400 | 0.754 | 12.413 |
| NO | D/ms−1 | Charge Diameter/mm | Single-Hole Charge/kg | Single-Hole Diameter/mm | Single-Hole Depth/m |
|---|---|---|---|---|---|
| T1 | 1115, 1279, 1492, 1824, 2116, 2452, 2661, 3152 | 32 | 0.2 | 90 | 8.4 |
| T2 | 3297, 3587, 3928, 4116, 4258, 4359, 4447, 4530 |
Publisher’s Note: MDPI stays neutral with regard to jurisdictional claims in published maps and institutional affiliations. |
© 2021 by the authors. Licensee MDPI, Basel, Switzerland. This article is an open access article distributed under the terms and conditions of the Creative Commons Attribution (CC BY) license (https://creativecommons.org/licenses/by/4.0/).
Share and Cite
Wang, Y.; Wang, X.; Zhang, J.; Yang, B.; Chen, J.; Zhu, W. Experimental Investigation of the Static and Dynamic Compression Characteristics of Limestone Based on Its Initial Damage. Appl. Sci. 2021, 11, 7643. https://doi.org/10.3390/app11167643
Wang Y, Wang X, Zhang J, Yang B, Chen J, Zhu W. Experimental Investigation of the Static and Dynamic Compression Characteristics of Limestone Based on Its Initial Damage. Applied Sciences. 2021; 11(16):7643. https://doi.org/10.3390/app11167643
Chicago/Turabian StyleWang, Yongqian, Xuan Wang, Jiasheng Zhang, Benshui Yang, Junhua Chen, and Wujun Zhu. 2021. "Experimental Investigation of the Static and Dynamic Compression Characteristics of Limestone Based on Its Initial Damage" Applied Sciences 11, no. 16: 7643. https://doi.org/10.3390/app11167643
APA StyleWang, Y., Wang, X., Zhang, J., Yang, B., Chen, J., & Zhu, W. (2021). Experimental Investigation of the Static and Dynamic Compression Characteristics of Limestone Based on Its Initial Damage. Applied Sciences, 11(16), 7643. https://doi.org/10.3390/app11167643