Article

Simulation of Test Arch Based on Concrete Damage Plasticity Model and Damage Evolution Analysis

1
School of Civil Engineering, Changsha University of Science and Technology, Changsha 410114, China
2
School of Civil Engineering, Fujian University of Technology, Fuzhou 350118, China
3
China Railway Construction Bridge Engineering Bureau Group First Engineering Co., Ltd., Dalian 116000, China
*
Author to whom correspondence should be addressed.
These authors contributed equally to this work.
Appl. Sci. 2023, 13(20), 11239; https://doi.org/10.3390/app132011239
Submission received: 12 September 2023 / Revised: 11 October 2023 / Accepted: 11 October 2023 / Published: 13 October 2023
(This article belongs to the Section Civil Engineering)

Abstract

:
In light of the limited research on latent damages during the construction of large-span suspension arches, this study introduced a method to simulate structural damage utilizing random porosity. Initially, based on data from real-world engineering projects, the most susceptible areas within the arch structure were pinpointed. Subsequently, multiple test arch simulation models were constructed. Employing Python, commands for random porosity were implemented within ABAQUS and distinct mesh modules were devised to depict structures under varying degrees of damage. The current investigation delved into the structural responses of these susceptible areas under different damage rates, shedding light on damage progression patterns. Notably, our findings demonstrated that concealed damages on the top plate of the arch foot profoundly influenced structural integrity, whereas damages at the arch hance were comparatively minimal and predominantly manifest at the arch base. The pronounced localized damage at both the arch base and hance initiated and intensified at sectional corners, necessitating enhanced anti-crack measures in these regions. Moreover, depending on the stresses of the arch structure, diverse reinforcement strategies could be employed, optimizing the balance between load-bearing efficiency and cost considerations.

1. Introduction

With the advancement of new design theories, construction technologies, and high-performance materials, reinforced concrete arch bridges have consistently achieved new span records both domestically and internationally, with their prevalence increasing [1,2,3]. Yet, the construction management of these large-span arch bridges presents amplified challenges [4,5]. Coupled with environmental degradation and the deterioration of structural materials over time, there emerges a heightened risk of subsequent damage in the later phases of these arch bridges.
Tang et al. [6] employed the tensor damage theory, drawing from tests on 28-year-old RC arches, to model arch rib damage and delve into its failure mechanisms. Using on-site monitoring data from operational RC arch bridges, Fan et al. [7] constructed experimental arch models mirroring actual damage scenarios. Their research highlighted the impacts of varying damage locations and magnitudes on the arch structure. Kamiński et al. [8] compared the kinematic method with the finite element method to simulate the material loss, degradation, and longitudinal cracking in arch structures, investigating the ramifications of distinct damages on load-bearing capacities. Focusing on masonry arch bridges from the early 20th century, Conde et al. [9] identified pronounced cracks at the 1/4 span and within the vault, underscoring the arch’s quadrants as points of vulnerability. Witzany et al. [10] formulated a pragmatic rehabilitation strategy for the Lipen Bridge—a concrete arch structure erected in the early 1900s. Over its extended operational life, this bridge exhibited material detachment and weakening on approximately 20–25% of its arch ring surface, averaging a depth between 10 and 30 mm. Khorraminejad et al. [11] assessed geometric and design parameters, analyzing the vulnerability of arch bridges. Their findings emphasized the connection modality and sagittal span ratio as influential factors in failure probability. The damage mechanisms of RC arches, particularly those influenced by the rusting and expansion of steel bars, currently stand as prominent research subjects. In this vein, Ma et al. [12] explored the influence of rusting and expansion on the load-bearing capabilities and failure patterns of RC arches post-rust-loading. Xin et al. [13] chose the RC arch as their focal point, designed an RC bare arch test, and studied the damage evolution of arch ribs under rust-induced expansion.
While the load-bearing damage mechanism of concrete arches has been elucidated [14] and advancements have been made in damage identification technology with in-depth research into the rusting and swelling of reinforcing steel, a notable gap exists. Most current studies target post-construction bridge damages, often overlooking latent damages incurred during construction. In the above studies, there are fewer cases of finite element simulation of damage to arch ribs, and there is no simulation method for damage inside the structure. During the erection of suspension arch bridges, the tower–cable–arch combined system is influenced by various elements like thermal disparities, cable tensioning, and subpar construction quality [15], leading to varying damage extents. In order to understand the force and damage mechanisms during this phase, there is a need for new approaches to damage modelling for related research.
This study contrasts stress calculation outcomes from constructing three suspension arches with existing experimental data. Utilizing the CDP model, a simulation model of downscaled reinforced concrete arches was constructed. In this paper, a new simulation method (stochastic porosity method) is proposed to simulate local material damage in arch ribs. This method is implemented by programming a command stream in Python. The current analysis focuses on displacement trend shifts across these conditions, inferring localized damage progression and their overarching spatial distribution.

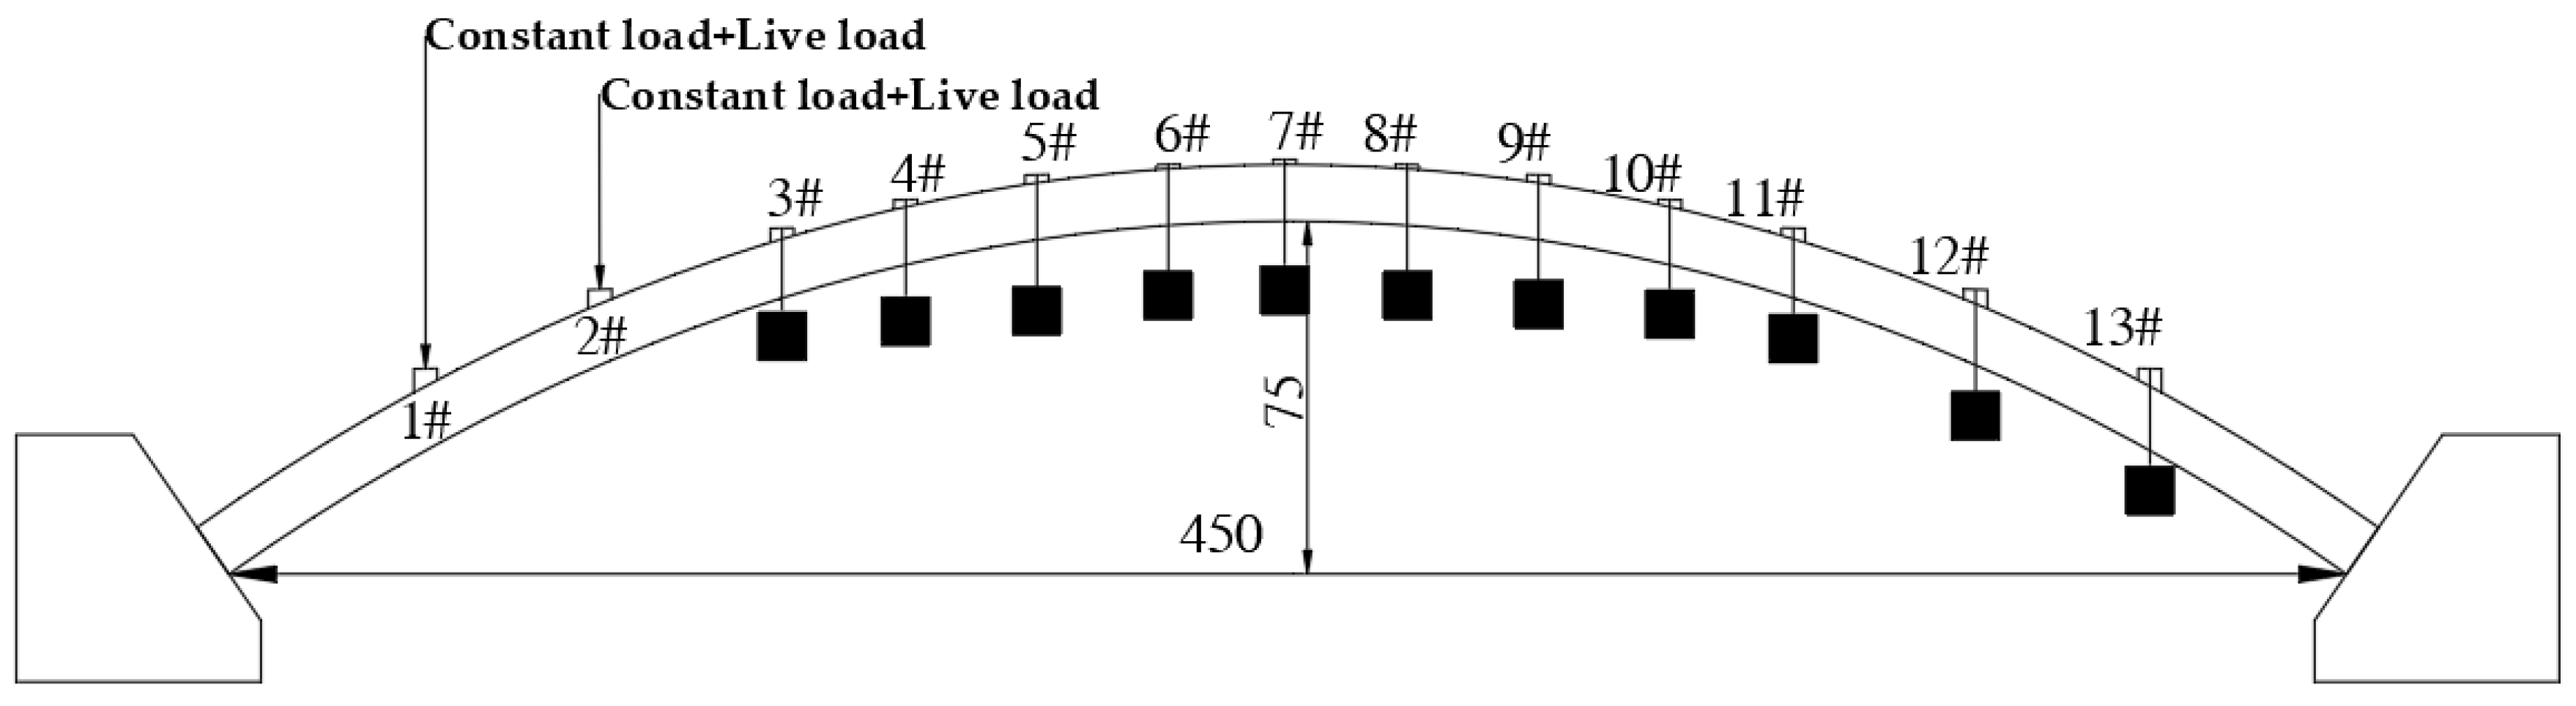
2. Overview of the Experiment

The simulation model was constructed based on the scaling test done by Li Jun of Southwest Jiaotong University [16]. The prototype for this model is the Damotan Bridge on the Longna Line in Sichuan. Scaled down to 1/10 of the original, the test arch spans 450 cm, with a net sagittal span ratio of 1/6 and an arch axis coefficient of m = 1.756. The arch rib section measures 8 cm in width and 11 cm in height and is constructed using C40 standard concrete. The section edges of the arch foot, both upper and lower, are reinforced with three Φ6 bars, resulting in a reinforcement rate of 1.93%. Conversely, the section edges of the vault are reinforced with two Φ6 bars, achieving a 1.29% reinforcement rate.
Based on the scaled-down calculations, the dead load compensation for the self-weight of the arch rib and the converted dead load from the structure atop the arch are detailed in Table 1. These loads are applied at loading points 1# to 13#. According to the research objectives in the literature [16], the reason for selecting #1 and #2 columns as loading points is to analyze the structural forces at the foot of the arch for the maximum bending moment condition. Consequently, the test live load is specifically applied at points 1# and 2#. Positions 3#~13# have dead loads applied by counterweights, while positions 1# and 2# both use jacks to apply dead loads and live loads. A schematic representation of the loading arrangement is displayed in Figure 1. Arch rib section is displayed in Figure 2.
According to the literature [16], there were 13 loading conditions in the experiment, and their corresponding values are listed in Table 2.

3. Concrete Plastic Damage Model

3.1. Fundamentals

The CDP model was provided by ABAQUS. Assuming that the concrete material mainly fails due to tensile cracking and compressive crushing, the evolution of yield or failure surfaces is controlled by two hardening variables, ε ˜ t p l and ε ˜ c p l . ε ˜ t p l and ε ˜ c p l denote the equivalent plastic strains in tension and compression, respectively [17]. The stress–strain curves are shown in Figure 3 and Figure 4 [18]. The tensile and compressive stress–strain curves of the CDP model were entered into ABAQUS in the form of σ t ε ˜ t c k and σ c ε ˜ c c k , respectively, and the relationships between the equivalent plastic strains ε ˜ t p l and ε ˜ c p l and the corresponding inelastic strains ε ˜ t c k and ε ˜ c c k when hardened in tension and compression are as follows [19]:
ε ˜ t p l = ε ˜ t c k d t ( 1 d t ) σ t E 0 ε ˜ c p l = ε ˜ c c k d c ( 1 d c ) σ c E 0
Among them, dt and dc are the tensile and compressive unloading stiffness reduction factors, respectively, and E0 is the initial damage-free elastic modulus of the material.
Figure 5 illustrates the stiffness recovery process under uniaxial cyclic loading. Concrete, while susceptible to tension-induced cracking, sees crack closure when the load shifts from tension to compression. This closure augments the support area, thereby reviving stiffness. The OAB segment demonstrates tension application and the subsequent damage, then unloading and reverse loading lead to point C on the BC segment—this point marks the shift from tension to compression. Subsequent compression along the CF segment returns the stiffness to its initial state. When subjected to a dual-cycle load, transitioning from compression to tension, the curve follows the GH path, with G indicating the pivot from compression to tension. Given prior tensile and compressive damages, there is a slight decrease in stiffness. W c and W t are the coefficients of recovery of compressive and tensile stiffness, respectively, which are generally taken as W c = 1 , W t = 0 .

3.2. CDP Model Parameterization

ABAQUS requires input for the stress–strain relationships of σ t ε ˜ t c k and σ c ε ˜ c c k . However, effective experimental data are often elusive when employing this model. Consequently, actual structural analysis typically incorporates the concrete design code [20]. This integration facilitates specific calculation methodologies.
Regarding the linear stress–strain relationship within the elastic phase, the modulus of elasticity E 0 can be inferred from the crack initiation slope depicted in Figure 3, which is mathematically expressed as follows:
E 0 = f t k ε t k
Among them, f t k is the standard value of uniaxial tensile strength, which can be obtained directly from the field specimen test under the condition; ε t k is the corresponding strain value, and the recommended calculation formula is ε t k = f t k 0.54 × 65 × 10 6 .
The inelastic stress–strain relationship is specified as follows:
When pulled:
y = 1.2 x 0.2 x 6 x 1 y = x α t ( x 1 ) 1.7 + x x > 1 ,   x = ε / ε t k   ,   y = σ / f t k
When pressurized:
y = n x n 1 + x n x 1 y = x α c ( x 1 ) 2 + x x > 1 ,   x = ε / ε c k   ,   y = σ / f c k , n = E c ε c k E c ε c k f c r
Among them, f c k is the standard value of uniaxial compressive strength; ε c k is the corresponding strain value, and the recommended calculation formula is ε c k = ( 700 + 172 f c k ) × 10 6 ; α t and α c are the parameter values of the descending section of uniaxial tensile and compressive stress–strain curves, respectively, and the corresponding values are shown in the specification.
In the CDP model, it is necessary to specify the damage factors d t and d c , which can be derived from Equation (2) and introduced into the scale factor η :
d t = ( 1 η t ) ε ˜ t i n E 0 σ t ( 1 η t ) ε ˜ t i n E 0 d c = ( 1 η c ) ε ˜ c i n E 0 σ c ( 1 η c ) ε ˜ c i n E 0
among them, η t was 0.9 and η c was 0.6.
From the above, the calculated parameters of the test arch concrete CDP model are shown in Table 3 and Table 4.

4. Simulation Model Construction

4.1. Model Construction and Validation

Based on the dimensional parameters in one previous study [16], a simulation model was developed with the comprehensive finite element software ABAQUS 2022. The C3D8R solid element was used to represent the concrete, and the CDP model was employed for plastic damage. Spatial beam elements (B31 element) simulated the steel bars. The size of the reinforcement unit is 5 cm. The reinforcement is connected to the concrete by means of embedded fixing. The bond-slip effect between steel bars and concrete was not considered, and the loading was applied based on the amplitude data. The model is shown in Figure 6.
Using preset parameters and experimental loads, horizontal and vertical displacement data for Column 2 were extracted from the referenced literature and were compared with our simulation model. The horizontal coordinates in Figure 7 are the live load multipliers, and the load values are shown in Table 2. The vertical coordinates are the displacement values. The displacement values are shown in Figures 3.4.5-3 and 3.4.5-4 in the literature [16]. As shown in Figure 7, the simulation results largely followed a linear trend without prominent deviations from the experimental data. The most significant discrepancy in horizontal displacement emerged in Load Cases 6 to 9, with a peak difference of 0.95 mm. Meanwhile, the greatest variance in vertical displacement appeared in Load Cases 4 to 6, peaking at 0.7 mm. Given potential inaccuracies in the simulation parameters, measurements, and loading, these deviations are within acceptable limits. Moreover, the damage distribution depicted in Figure 8 for the left half-span aligns closely with the experimental model, underscoring the reliability of our simulation results.

4.2. Initial Damage Simulation Approach

Before conducting the analysis, it is essential to assess the arch ring stress variation throughout the construction phase and pinpoint potentially vulnerable cross-sections. Three cast-in-place arch bridges were selected for comparison: Shatuo Bridge (with a span of 240 m), Qingshui River Bridge (with a span of 248 m), and Xixiu Bridge (with a span of 288 m). The stress changes during the construction of the three bridges are shown in Figure 9. The data suggested that as the length of the constructed segments increased, the peak stress on the upper edge progressively relocated towards the crown of the arch. Notably, most bridges manifested significant tensile stress concentrations at this crown. Conversely, while stress variations were evident at the lower edge near the abutment, they predominantly clustered in its vicinity. These findings underscored the arch crown as a pivotal transition point during construction. Before commencing construction at the crown segment, primary damage locations were predominantly at the base plate of abutments. However, after this phase, these points shifted closer to the top plate of the crown.
Drawing from the original experimental data and stress calculations during the bridge’s construction phase, this study identified the springing and hance locations of the load points as focal areas for damage simulation. In line with our predetermined simulation approach, four damage categories were established: top slab at springing (working condition I), bottom slab at springing (working condition II), top slab at hance (working condition III), and bottom slab at hance (working condition IV). Each damage category encompassed three models, reflecting loss rates of 5%, 10%, and 15%, culminating in 12 distinct models.
Concrete damage simulation predominantly employs methodologies, such as CIT, VCCT, XFEM [27,28,29], and the damage mechanics-based CDP model [30]. Given our emphasis on macroscopic effects on the overarching bridge structure, local crack propagation was not a component of this study. Consequently, utilizing the CDP plastic damage model, specific structural elements were pinpointed and a Python code was devised to simulate concrete material damage through random porosity. The detailed mesh of this model is depicted in Figure 10.
The protective layer of the arch rib has a thickness of 10 mm. Considering the potential full-layer damage, a 16 mm concrete thickness was designated for the simulation. The element size was set at 4 mm and a 12 mm thickness was earmarked for element removal, excluding elements proximate to the contact surface from damage consideration. The damage zone was an independent mesh component seamlessly integrated with the arch rib. To optimize computational efficiency, the mesh was meticulously segmented within the arch rib’s damage simulation zone, progressively increasing the mesh size through a transitional area.

4.3. Quasi-Static Computational Assessment

With the advancement in simulation technology, studies have revealed that ABAQUS/Explicit often surpasses ABAQUS/Standard in addressing specific static problems, avoiding non-convergence issues [21,31]. Typically, after performing a quasi-static analysis, its validity can be measured by determining if the kinetic energy surpasses 5% to 10% of the overall internal energy. If it remains within this threshold, the computation can be deemed reflective of a static load process.
Given the 12 models formulated in this research, those at identical locations only vary in damage rates. A model exhibiting a 10% damage rate was chosen as a representative sample. Extracting internal and kinetic energy data from select load steps yielded the curve depicted in Figure 11. The data underscore that the kinetic energy in all models is significantly below the internal energy, contributing less than 10%, thus meeting the quasi-static analysis criteria [32].

5. Analysis of Results

5.1. Analysis of Displacement Results

For a clearer visual representation of the displacement alterations, the 2# and 11# bearing pads (situated at the loading point and close to the hance, respectively) were chosen as data extraction points for displacement, based on prior experimental results. In the following section, the displacement results for different damage conditions are summarized. It is shown in Figure 12, Figure 13, Figure 14 and Figure 15. In each figure, (a) represents the X-direction displacement at position 2#, (b) represents the Y-direction displacement at position 2#, (c) represents the X-direction displacement at position 11#, and (d) represents the Y-direction displacement at position 11#. The horizontal axis indicates the load steps, while the vertical axis illustrates the displacement variance pre- and post-damage.

5.1.1. Damage Conditions at Arch Foot Base Plate

Figure 12 illustrates the displacement alterations following damage to the bottom slab of the springing. The data curve trends were largely consistent. In the initial 30 load steps, the impact of displacement damage was marginal, suggesting the stability of the arch structure. Post the 30th step, a slight elevation in displacement disparity occurred, culminating in a pronounced increase that signified structural collapse. This suggested that the damage rate of the bottom slab does not directly influence the onset of structural failure. The marked surge indicated that damage expedited the structure’s brittle breakdown. Intriguingly, under a 5% damage rate, the displacement variance was more pronounced than the 10% and 15% rates and structural failure manifested sooner. This challenged the prevailing belief that “greater damage equates to a higher likelihood of failure”.

5.1.2. Damage Conditions at the Top Plate of the Arch Foot

Figure 13 illustrates the displacement changes following damage to the top slab of the springing. The graph revealed that the structural displacement disparity escalated from the 10th load step onward. Within the region highlighted by the dashed box, the displacement difference exhibited a quadratic growth pattern, which was markedly amplified compared to the effects on the bottom slab. The impairment to the top slab was considerably more consequential, precipitating an earlier structural breakdown. Nonetheless, owing to the lagged intervention of the reinforcement, the damage to the top slab culminated in a ductile failure. This type of failure was preferable in real-world engineering scenarios as it allowed for structural evaluations before reinforcement was applied. Conversely, escalating the damage rate on the top slab of the springing intensified the overall degradation of the structure.

5.1.3. Damage Conditions at the Top and Bottom of the Arch Hance

Figure 14 and Figure 15 delineate the displacement shifts resulting from damage to the top and bottom slabs of the hance. By examining the inflection points of curves within these figures, it was evident that under the present experimental parameters, the precise location of the hance’s damage showed no direct correlation with structural collapse. Notably, as the damage rate of the top slab augmented, there was a marked rise in the structure’s displacement, underscoring a direct relationship between the top slab damage rate of the hance and structural failure (Figure 14). Conversely, irrespective of the damage conditions, the displacement trends were analogous, and their magnitudes were closely aligned (Figure 15), suggesting a minimal impact of varying damage rates on the displacement of the structure.

5.2. Analysis of Structural Damage Evolution

Within the ABAQUS 2022 finite element software, the rate of stiffness reduction in SDGE serves as an indicator to ascertain an element’s failure. In the figure legend, 0 denotes an unimpaired element with no loss in stiffness, while 1 implies total stiffness degradation, signifying material failure. For this study, a model with a 5% damage rate was chosen to examine the progression and spatial distribution of element damage and to shed light on how damage evolves in the arch ribs under varying operational conditions. According to the calculation of different damage conditions, the results of the local damage distribution mutation stage are extracted and divided into Results I~VI and Results I~V in turn.

5.2.1. Damage Conditions at the Foot of the Arch

Figure 16 and Figure 17 depict the stiffness alterations in elements following damage to the top and bottom slabs of the arch foot, respectively. From the results in Figure 16 (Results I and II), it was observed that the damage to the arch foot top slab first started from the corners and then gradually extended to the surface of the web. The degradation on the top surface commenced at the edges, advancing toward the center, culminating in a substantial region of stiffness reduction in the elements. This failure was confined to the surface of the damage zone in the arch rib and showed no effect on the reinforcing steel framework. Results III, IV, and V illustrated that while the concrete protective layer on the top slab sustained damage, its impact on the bottom slab remained insignificant until complete failure ensued. As damage continued to evolve, the deterioration of the bottom slab extended from the web surface upwards to the top slab, with pronounced damage to its protective layer manifesting only after comprehensive failure of the web surface.
By comparing Figure 16 and Figure 17, it was found that the progression of element stiffness failure in the bottom slab at the arch foot was similar to that at the top slab. The initiation of damage emerged from the corners and methodically progressed across the web, culminating in a comprehensive cross-sectional failure. Moreover, after the elemental failures on the web surface, the damage in the bottom slab region started to evolve, steadily spreading deeper into the section. This suggested that varying initial damage sites might influence the preliminary local damage patterns at the arch foot, but not significantly alter the ensuing progression trajectory.

5.2.2. Arch Hance Damage Conditions

Figure 18 and Figure 19 delineate the evolution in element stiffness subsequent to damage at the top and bottom slabs of the arch hance, respectively. From the Results I, it was evident that elemental failures at the arch hance initiated at the corner regions of the top slab. As the stiffness at the compromised site continued to degrade, the materials situated at the corners of the bottom slab began to exhibit failure. Thereafter, the damaged zone expanded from both the top and bottom slabs, converging toward the center, culminating in a full sectional breakdown. This analysis underscored the notion that while the initial site of damage exerted no pronounced influence over the subsequent damage trajectory in the arch hance, the corners of the section remained pivotal zones of vulnerability. Consequently, it was advisable to fortify these corner regions with a dense steel crack control mesh to mitigate and decelerate the proliferation of concrete damage.

5.2.3. Structural Damage Distribution

After analyzing the progression of localized damage, a deeper exploration was conducted into the overarching structural implications under varied initial damage conditions. Figure 20 illustrates the aftermath of expansive material failure based on various starting damage points. As depicted by the elemental stiffness failure distribution in the figure, distinct initial damage sites at the arch foot exhibited no influence on the global structural damage distribution; predominant failure consistently stemmed from damage originating at the arch foot. Conversely, when the initial damage was positioned at the arch hance, pronounced damage was evident mainly at the arch hance and the vicinity of the 2# pad beam. In this scenario, the arch foot was not the primary locus of failure. Interestingly, when comparing the initial damage on the bottom slab of the arch hance with that on the top slab, the latter proved more deleterious to the integrity of the structure. Given the loading dynamics of the 1# and 2# pad beams, a negative bending moment materialized at the 10# pad beam, resulting in tensile stress on the top slab and compressive stress on the bottom slab. Taking into the low tensile strength of concrete and the initial damage of the material, the structure underwent significant detrimental effects.

5.3. Analysis of Reinforcement Forces at the Damage Site

For reinforced concrete structures, when the protective layer of concrete fails due to tension or compression, the reinforcing bars may further bear the structural loads. Consequently, it was imperative to delineate the stress variations experienced by these reinforcing bars throughout structural analysis. The solid line and dashed line in Figure 21a represent the damage to the arch foot bottom slab and top slab, respectively, while the solid line and dashed line in Figure 21b represent the damage to the arch hance bottom slab and top slab, respectively. These figures capture the loss in stiffness when the material in the damaged sections has effectively reached its failure point.
From the stress curves in Figure 21, the following points were observed:
  • Once the concrete underwent comprehensive failure throughout the cross-section, the stress within the primary reinforcement predominantly remained beneath the yield strength of 465 MPa [16]. This signified that the reinforcing bars largely sustained an elastic stress state, with the predominant structural failure stemming from the concrete’s collapse.
  • Compared to the reinforcing bars in the top slab, the reinforcing bars in the arch foot bottom slab experienced higher stress. In the reinforcement design, the specifications of the reinforcing bars in the top and bottom slabs can be adjusted based on the most unfavorable conditions, aiming to save materials while ensuring the load-bearing requirements are met.
  • Compared to damage at the bottom slab of the arch hance, damages sustained by the top slab resulted in the reinforcing bars undergoing augmented stress levels. This escalation in stress was witnessed earlier. Nevertheless, the change in stress for both the top and bottom plate reinforcements followed a similar trend, indicating that the damage location exhibited no significant impact on the development of reinforcement stress.

6. Conclusions

Based on the analysis of large-span continuous casting arches and stress calculations, vulnerable positions during construction were identified. Using ABAQUS finite element software, the arch was simulated with a CDP model grounded on experimental data. Displacement changes were observed for various vulnerable positions and damage rates, with both local and overall damage evolution being studied. Key findings include:
  • Displacement data comparison revealed that top plate damage critically influenced structural failure more than bottom plate damage. The ductile nature of top plate failure contrasted with the brittle bottom plate failure, offering better prospects for engineering monitoring and strengthening. Foot damage notably affected structural failure more than hance damage.
  • Both foot and hance damage in the arch began at the section corners. Initial damage rates primarily influenced early damage evolution, with less impact on subsequent trends. To mitigate damage, a crack prevention mesh could be incorporated at section corners.
  • In the event of substantial local material failure, even if most reinforcing bars remained unyielded, the bottom plate bars faced more challenging conditions. Consequently, the reinforcement design should recalibrate specifications and ratios for both plates based on these conditions.
  • Given laboratory test constraints, this study primarily assessed the eccentric loading of arch ribs. Upcoming research will delve into damage evolution under midspan loading, striving for a comprehensive understanding.

Author Contributions

Conceptualization, Z.T. and Y.C.; methodology, Y.C.; software, Y.C.; validation, Y.C.; formal analysis, Y.C.; investigation, Y.C., H.S., G.W., Z.Z., Y.D. and B.X.; resources, Z.T.; writing—original draft preparation, Y.C.; writing—review and editing, Y.C. and Z.T.; supervision, Z.T.; project administration, Y.C.; funding acquisition, Z.T., H.S., and G.W. All authors have read and agreed to the published version of the manuscript.

Funding

This research was funded by the National Nature Science Foundation of China, grant number 51478049; the National Nature Science Foundation of China, grant number 52078058; the Hunan Natural Science Foundation of China, grant number 2022JJ50323; the Major Technological Achievements Transformation Program of Hunan Strategic emerging industries of China, grant number 2017GK4034; the Postgraduate Research and Innovation Project of Hunan, grant number CX20200834; Research on Key Technology of Long Span Reinforced Concrete Suspension Arch Construction, grant number DQJ-2021-B02.

Institutional Review Board Statement

Not applicable.

Informed Consent Statement

Not applicable.

Data Availability Statement

Not applicable.

Conflicts of Interest

The authors declare no conflict of interest.

References

  1. Chen, B.; Liu, J.; Habib, T. Recent Research and Application of Arch Bridges in China; Springer International Publishing: Cham, Switzerland, 2019; pp. 536–544. [Google Scholar]
  2. Lin, S.S.; Chen, B.C.; Wu, Q.X. Discussion on Calculation Methods for Load Bearing Capacity of Concrete Arch Bridges. In Proceedings of the 2013 Fourth International Conference on Digital Manufacturing & Automation, Shinan, China, 29–30 June 2013; pp. 492–496. [Google Scholar]
  3. Liu, J.; Chen, B.; Li, C.; Zhang, M.; Mou, T.; Tabatabai, H. Recent application of and research on concrete arch bridges in China. Struct. Eng. Int. 2023, 33, 394–398. [Google Scholar] [CrossRef]
  4. Yang, J.; Chen, R.; Zhang, Z.; Zou, Y.; Zhou, J.; Xia, J. Experimental study on the ultimate bearing capacity of damaged RC arches strengthened with ultra-high performance concrete. Eng. Struct. 2023, 279, 115611. [Google Scholar] [CrossRef]
  5. Yang, J.; Huang, L.; Tong, K.; Tang, Q.; Li, H.; Cai, H.; Xin, J. A Review on Damage Monitoring and Identification Methods for Arch Bridges. Buildings 2023, 13, 1975. [Google Scholar] [CrossRef]
  6. Tang, X.; Zhang, J.; Li, C.; Xu, F.; Pan, J. Damage analysis and numerical simulation for failure process of a reinforced concrete arch structure. Comput. Struct. 2005, 83, 2609–2631. [Google Scholar] [CrossRef]
  7. Fan, Y.; Zhou, J.; Hu, Z.; Zhu, T. Study on mechanical response of an old reinforced concrete arch bridge. Struct. Control. Health Monit. 2007, 14, 876–894. [Google Scholar] [CrossRef]
  8. Kamiński, T.; Bień, J. Application of kinematic method and FEM in analysis of ultimate load bearing capacity of damaged masonry arch bridges. Procedia Eng. 2013, 57, 524–532. [Google Scholar] [CrossRef]
  9. Conde, B.; Drosopoulos, G.; Stavroulakis, G.; Riveiro, B.; Stavroulaki, M. Inverse analysis of masonry arch bridges for damaged condition investigation: Application on Kakodiki bridge. Eng. Struct. 2016, 127, 388–401. [Google Scholar] [CrossRef]
  10. Witzany, J.; Zigler, R. Rehabilitation design of a historic concrete arch bridge in Prague from the early 20th century. J. Perform. Constr. Fac. 2020, 34, 04020056. [Google Scholar] [CrossRef]
  11. Khorraminejad, A.; Shiravand, M.R.; Safi, M. Damage Analysis of Concrete Open-Spandrel Deck Arch Bridges under Seismic Loads. J. Bridge. Eng. 2022, 27, 04022069. [Google Scholar] [CrossRef]
  12. Ma, Y.; Xu, F.; Wang, L.; Zhang, J.; Zhang, X. Influence of corrosion-induced cracking on structural behavior of reinforced concrete arch ribs. Eng. Struct. 2016, 117, 184–194. [Google Scholar] [CrossRef]
  13. Xin, J.; Wang, J.; Liu, Z.; You, X.; Zhou, J. Experimental Study on Bearing Capacity of Corroded Reinforced Concrete Arch Considering Material Degradation. Front. Mater. 2022, 9, 847193. [Google Scholar] [CrossRef]
  14. Chen, B.C.; Lin, S.S. A state-of-the-art on the ultimate load-carrying capacity of reinforced concrete arches. J. Fuzhou Univ. 2014, 42, 282–289. [Google Scholar] [CrossRef]
  15. Peng, W.P. Research on Optimization of Cable Force and Arch Ring Stress Regulation during the Construction Period of Large-Span Cantilever Cast Concrete Arch Bridge. Ph.D. Thesis, Changsha University of Science and Technology, Changsha, China, 2020. [Google Scholar]
  16. Li, J. Research on Moment Increase Coefficient of Reinforced Concrete Arch Bridge. Ph.D. Thesis, Southwest Jiaotong University, Chengdu, China, 2012. [Google Scholar]
  17. Mirgal, P.; Singh, R.K.; Banerjee, S. Acoustic and fracture energy correlation in mode I fracture with concrete damage plasticity model and three-point bend experiment. J. Mater. Civil. Eng. 2023, 35, 04023002. [Google Scholar] [CrossRef]
  18. Park, H.W.; Lee, J.H.; Jeong, J.H. Finite Element Analysis of Continuously Reinforced Bonded Concrete Overlay Pavements Using the Concrete Damaged Plasticity Model. Sustain. Sci. 2023, 15, 4809. [Google Scholar] [CrossRef]
  19. Hafezolghorani, M.; Hejazi, F.; Vaghei, R.; Jaafar, M.B.; Karimzade, K. Simplified damage plasticity model for concrete. Struct. Eng. Int. 2017, 27, 68–78. [Google Scholar] [CrossRef]
  20. China Academy of Building Research, Tsinghua University, Tongji University. Code for Design of Concrete Structures; China Building Industry Press: Beijing, China, 2010. [Google Scholar]
  21. Genikomsou, A.S.; Polak, M.A. Finite element analysis of punching shear of concrete slabs using damaged plasticity model in ABAQUS. Eng. Struct. 2015, 98, 38–48. [Google Scholar] [CrossRef]
  22. Othman, H.; Marzouk, H. Applicability of damage plasticity constitutive model for ultra-high performance fibre-reinforced concrete under impact loads. Int. J. Impact. Eng. 2018, 114, 20–31. [Google Scholar] [CrossRef]
  23. Lubliner, J.; Oliver, J.; Oller, S. A plastic-damage model for concrete. Int. J. Solids Struct. 1989, 25, 299–326. [Google Scholar] [CrossRef]
  24. Helmut, K.; Hubert, K.H.; Hubert, R. Behavior of Concrete Under Biaxial Stresses. J. Proc. 1969, 66, 656–666. [Google Scholar] [CrossRef]
  25. Minh, H.L.; Khatir, S.; Wahab, M.A.; Cuong-Le, T. A concrete damage plasticity model for predicting the effects of compressive high-strength concrete under static and dynamic loads. J. Build. Eng. 2021, 44, 103239. [Google Scholar] [CrossRef]
  26. Ren, W.; Sneed, L.H.; Yang, Y.; He, R. Numerical simulation of prestressed precast concrete bridge deck panels using damage plasticity model. Int. J. Concr. Struct. Mater. 2015, 9, 45–54. [Google Scholar] [CrossRef]
  27. Tawfik, A.B.; Mahfouz, S.Y.; Taher, S. Nonlinear ABAQUS Simulations for Notched Concrete Beams. Aci. Mater. J. 2021, 14, 7349. [Google Scholar] [CrossRef] [PubMed]
  28. Yuan, Z.H.; Ma, C.; Yang, S.Y.; Wang, P.Z. Performance Study of RC Hollow Core Slab with Cracks Based on Extended Finite Element Method (XFEM). In Proceedings of the CICTP 2020, Xi’an, China, 2–5 July 2020; pp. 1106–11118. [Google Scholar]
  29. Wang, G.; Lu, W.; Zhou, C.; Zhou, W. The influence of initial cracks on the crack propagation process of concrete gravity dam-reservoir-foundation systems. J. Earthq. Eng. 2015, 19, 991–1011. [Google Scholar] [CrossRef]
  30. Yazdani, M.; Habibi, H. Residual capacity evaluation of masonry arch bridges by extended finite element method. Struct. Eng. Int. 2023, 33, 183–194. [Google Scholar] [CrossRef]
  31. Bradford, M.A.; Liu, X.; Chen, C.; Wang, J. Finite element modelling of lattice angle steel structures exposed to wildland fires. Structures 2023, 56, 104901. [Google Scholar] [CrossRef]
  32. Koman, H. Strengthening of RC frames with infill walls using high strength lightweight concrete panels. J. Sustain. Constr. Mater. Tech. 2023, 8, 120–133. [Google Scholar] [CrossRef]
Figure 1. Basic arrangement of test arch (unit: cm).
Applsci 13 11239 g001
Figure 2. Section dimensions and reinforcement arrangement [16] (unit: cm): (a) section of the foot of the arch; (b) L/4 and vault section.
Applsci 13 11239 g002
Figure 3. Uniaxial compression stress–strain diagram of concrete [18].
Applsci 13 11239 g003
Figure 4. Uniaxial tensile stress–strain diagram of concrete [18].
Applsci 13 11239 g004
Figure 5. Variation of stiffness under cyclic loading for the CDP model [18].
Applsci 13 11239 g005
Figure 6. Simulation model diagram: (a) bridge; (b) reinforcing steel skeleton.
Applsci 13 11239 g006
Figure 7. Comparison of displacement data of 2# columns: (a) horizontal displacement; (b) vertical displacement.
Applsci 13 11239 g007
Figure 8. Comparison of damage distribution in the left half-span for Case 13: (a) test model [16]; (b) simulation model.
Applsci 13 11239 g008
Figure 9. Comparison of stress changes during construction: (a) Shatuo Bridge; (b) Qingshui River Bridge; (c) Xixiu Bridge.
Applsci 13 11239 g009aApplsci 13 11239 g009b
Figure 10. Grid map of the damaged area.
Applsci 13 11239 g010
Figure 11. Energy time course graph.
Applsci 13 11239 g011
Figure 12. Damage work displacement on arch foot base plate: (a) X-direction displacement at position 2#; (b) Y-direction displacement at position 2#; (c) X-direction displacement at position 11#; (d) Y-direction displacement at position 11#.
Applsci 13 11239 g012
Figure 13. Damage conditions at the top plate of the arch foot: (a) X-direction displacement at position 2#; (b) Y-direction displacement at position 2#; (c) X-direction displacement at position 11#; (d) Y-direction displacement at position 11#.
Applsci 13 11239 g013
Figure 14. Damage work displacement at the top plate of the hance: (a) X-direction displacement at position 2#; (b) Y-direction displacement at position 2#; (c) X-direction displacement at position 11#; (d) Y-direction displacement at position 11#.
Applsci 13 11239 g014
Figure 15. Damage work displacement at the base plate of the hance: (a) X-direction displacement at position 2#; (b) Y-direction displacement at position 2#; (c) X-direction displacement at position 11#; (d) Y-direction displacement at position 11#.
Applsci 13 11239 g015aApplsci 13 11239 g015b
Figure 16. Unit stiffness under top plate damage.
Applsci 13 11239 g016
Figure 17. Unit stiffness under bottom plate damage.
Applsci 13 11239 g017
Figure 18. Unit stiffness under top plate damage.
Applsci 13 11239 g018
Figure 19. Unit stiffness under bottom plate damage.
Applsci 13 11239 g019
Figure 20. Stiffness failure distribution in the arch rib unit.
Applsci 13 11239 g020
Figure 21. Stress curves of main reinforcement at damage location: (a) damage to the foot of the arch; (b) arch lumbar injuries.
Applsci 13 11239 g021
Table 1. Load values of the test arch.
Dead Load ValuesLive Load Values
Loading PointLoad (kN)Loading PointLoad (kN)Loading PointLoad (kN)
1#5.488#1.071#4.79
2#3.799#1.232#4.79
3#3.4910#1.33
4#1.3311#3.49
5#1.2312#3.79
6#1.0713#5.48
7#3.08
Table 2. Numerical values of live load for each working condition of the test arch.
Number1# Point Loading Value (kN)2# Point Loading Value (kN)Cumulative Live Load MultiplierNumber1# Point Loading Value (kN)2# Point Loading Value (kN)Cumulative Live Load Multiplier
11.821.990.4080.861.281.88
22.042.150.8491.000.782.07
31.150.781.04100.870.902.25
40.790.861.21111.031.412.51
51.231.071.45121.160.942.73
6−0.280.001.42131.010.842.92
71.320.981.66
Table 3. List of calculated parameters for C40 concrete.
Tensile BehaviorCompressive Behavior
Yield Stress (MPa)Cracking StrainDamage ParameterYield Stress (MPa)Inelastic StrainDamage Parameter
2.317005.12700
2.380.000030.1605110.0020.000010.0163
1.380.000150.5300214.3890.000030.0366
0.9110.000250.6839221.1290.000140.0958
0.6910.000350.7599224.9950.000340.1688
0.5650.000440.8050126.5430.000610.2446
0.4820.000530.8351226.70.000770.2812
0.4230.000620.8567118.3750.002370.5616
0.3790.000710.8729311.9110.003920.7078
0.3450.00080.885568.5450.005380.7842
0.3180.000890.895666.5960.006790.8297
0.2950.000980.904115.350.008180.8596
0.2760.001070.911144.490.009550.8807
0.2590.001150.917253.8650.010920.8963
0.2450.001240.922413.390.012290.9083
0.2330.001330.926873.0180.013650.9178
0.2220.001420.930862.7180.015010.9256
0.2120.001510.934432.4730.016370.932
0.2030.00160.937632.2670.017720.9374
0.1950.001690.940482.0930.019080.942
0.1880.001770.943031.9440.020440.946
0.1810.001860.945431.8150.021790.9495
0.1750.001950.947571.7010.023140.9525
0.170.002040.949451.6010.02450.9552
0.1640.002130.951391.5120.025850.9576
0.160.002220.952951.4320.02720.9598
0.1550.002310.954581.3610.028560.9618
0.1510.002390.9561.2960.029910.9635
0.1470.002480.957371.2370.031260.9651
0.1430.002570.958681.1830.032610.9666
Table 4. Values of concrete plasticity parameters.
Expansion Angle [21]Eccentricity [22]Compressive Strength Ratio [23,24]K-Factor [25]Coefficient of Viscosity [26]
350.11.160.6670.0005
Disclaimer/Publisher’s Note: The statements, opinions and data contained in all publications are solely those of the individual author(s) and contributor(s) and not of MDPI and/or the editor(s). MDPI and/or the editor(s) disclaim responsibility for any injury to people or property resulting from any ideas, methods, instructions or products referred to in the content.

