Article

TFNetPropX: A Web-Based Comprehensive Analysis Tool for Exploring Condition-Specific RNA-Seq Data Using Transcription Factor Network Propagation

1
Samsung Genome Institute, Samsung Medical Center, Seoul 06351, Republic of Korea
2
School of Software Convergence, Myongji University, Seoul 03674, Republic of Korea
*
Author to whom correspondence should be addressed.
Appl. Sci. 2023, 13(20), 11399; https://doi.org/10.3390/app132011399
Submission received: 30 August 2023 / Revised: 12 October 2023 / Accepted: 16 October 2023 / Published: 17 October 2023
(This article belongs to the Special Issue Bioinformatics: From Gene to Networks)

Abstract

:
Understanding condition-specific biological mechanisms from RNA-seq data requires comprehensive analysis of gene expression data, from the gene to the network level. However, this requires computational expertise, which limits the accessibility of data analysis for understanding biological mechanisms. Therefore, the development of an easy-to-use and comprehensive analysis system is essential. In response to this issue, we present TFNetPropX, a user-friendly web-based platform designed to perform gene-level, gene-set-level, and network-level analysis of RNA-seq data under two different conditions. TFNetPropX performs comprehensive analysis, from DEG analysis to network propagation, to predict TF-affected genes with a single request, and provides users with an interactive web-based visualization of the results. To demonstrate the utility of our system, we performed analysis on two TF knockout RNA-seq datasets and effectively reproduced biologically significant findings. We believe that our system will make it easier for biological researchers to gain insights from different perspectives, allowing them to develop diverse hypotheses and analyses.

1. Introduction

The analysis of RNA sequencing (RNA-seq) data has become a routine practice in biological research for transcriptome analysis, driven by reduced production costs and the development of analytical tools [1,2]. In most cases, the analysis of RNA-seq data follows the following process: sequencing data, quality control, read alignment, gene level quantification, and differential expression and functional analysis. These analyses aim to reveal the underlying biological mechanisms that cause variation between two conditions in different scenarios, such as phenotypic changes, knockout experiments, drug interventions, and temperature-induced stress [3]. A number of computational tools have been developed to obtain gene-level quantification matrices from RNA-seq data, and approaches have been developed to analyze DEG-based gene-level quantification matrix data from different perspectives [4]. However, genes do not function alone, so analysis at the level of individual genes is limited in its ability to understand the highly complex biological mechanisms that result from interactions between genes [5,6]. Thus, gene module level analysis is necessary for interpreting and hypothesizing from gene expression data. However, as there are a large number of candidate gene combinations to be considered, additional biological knowledge is required for an efficient analysis.
Leveraging biological knowledge in analysis often involves gene ontology (GO) terms and biological pathways at the molecular level, as well as broader biological networks that capture gene interactions [7]. There are a number of popular methods for performing analyses at the gene set level. For example, a widely used method, gene set enrichment analysis (GSEA), effectively extracts insights from gene expression data, facilitating the identification of the underlying biological processes or pathways associated with specific phenotypes [8]. Enrichr serves as a gene set search engine, providing the ability to query an extensive collection of annotated gene sets. It is a tool that integrates knowledge from many projects to provide a unified understanding of mammalian genes and gene sets. The tool is available on the web and also provides an API [9]. The Kyoto Encyclopedia of Genes and Genomes (KEGG) is a comprehensive knowledge base designed to facilitate the biological interpretation of molecular datasets. It provides comprehensive insights into diverse biological systems, covering data on genes, proteins, pathways, and compounds. KEGG is particularly valuable for gene-set-level analyses as it contains detailed information on the interactions between genes involved in specific biological functions, making it a widely used resource in this context [10].
Biological network analysis examines the interaction and organization of genes in forming functional modules that carry out essential physiological processes. Gene regulatory network analysis, which examines the regulatory interactions between transcription factors (TFs) and target genes (TGs) to modulate gene expression, is a common approach to analyzing RNA-seq data [11,12]. The STRING database provides comprehensive data on protein–protein interactions, consolidating information from diverse sources such as experimental studies, co-expression data, therapeutic knowledge, and computational biological text mining. The STRING protein–protein interaction (PPI) network is used by many network-based methods and provides insight into interactions across a wide range of biological species [13]. When constructing a TF-TG network, several databases offer predictions of TF–TG interactions, including resources such as TRANSFAC, TRRUST, and hTFtarget [14,15,16]. These databases present TF-TG target information using various approaches, including predictions derived from the literature dedicated to TF–TG interactions, motif-based predictions, aggregation of experimental evidence, and compilation of relevant datasets. Various network construction and analysis algorithms have been developed to facilitate the interpretation of complex biological mechanisms at the network scale. Among these methods, network propagation is emerging as an important approach to identifying important biological modules and genes in the analysis of genomic, transcriptomic, and proteomic data using networks [17,18,19]. Network propagation serves as a methodology for prioritizing condition-specific genes by spreading information from specific nodes within the network. This technique is useful in a variety of applications, including identifying subnetworks, discovering condition-specific gene sets, testing hypotheses, exploring drug–disease associations, and facilitating biological interpretation [20,21].
While many tools have been developed for analyzing gene expression data, a major drawback is their complexity for non-experts. These tools often rely on command line interfaces and different preferences, and when using multiple methods as a pipeline, sometimes the format of the output of the previous method does not match the format of the input of the next method, so you have to format the data for each process, making analysis more complicated. Acquiring the computational skills to meaningfully explore data is a significant barrier to analysis. In order to address these challenges, we have developed TFNetPropX, which is a web-based comprehensive RNA-seq data analysis system for the analysis and exploration of TF networks using network propagation. Our platform offers distinct usability advantages, integrating results across levels in a single run, with a user-friendly interface and minimal complexity. Visualizations from gene to network level facilitate the identification of significant results, with the generated analysis results easily downloadable for further processing. In addition, we streamline user exploration by providing one-click access to related gene and biological function information. The following sections describe the detailed analysis process of our system.

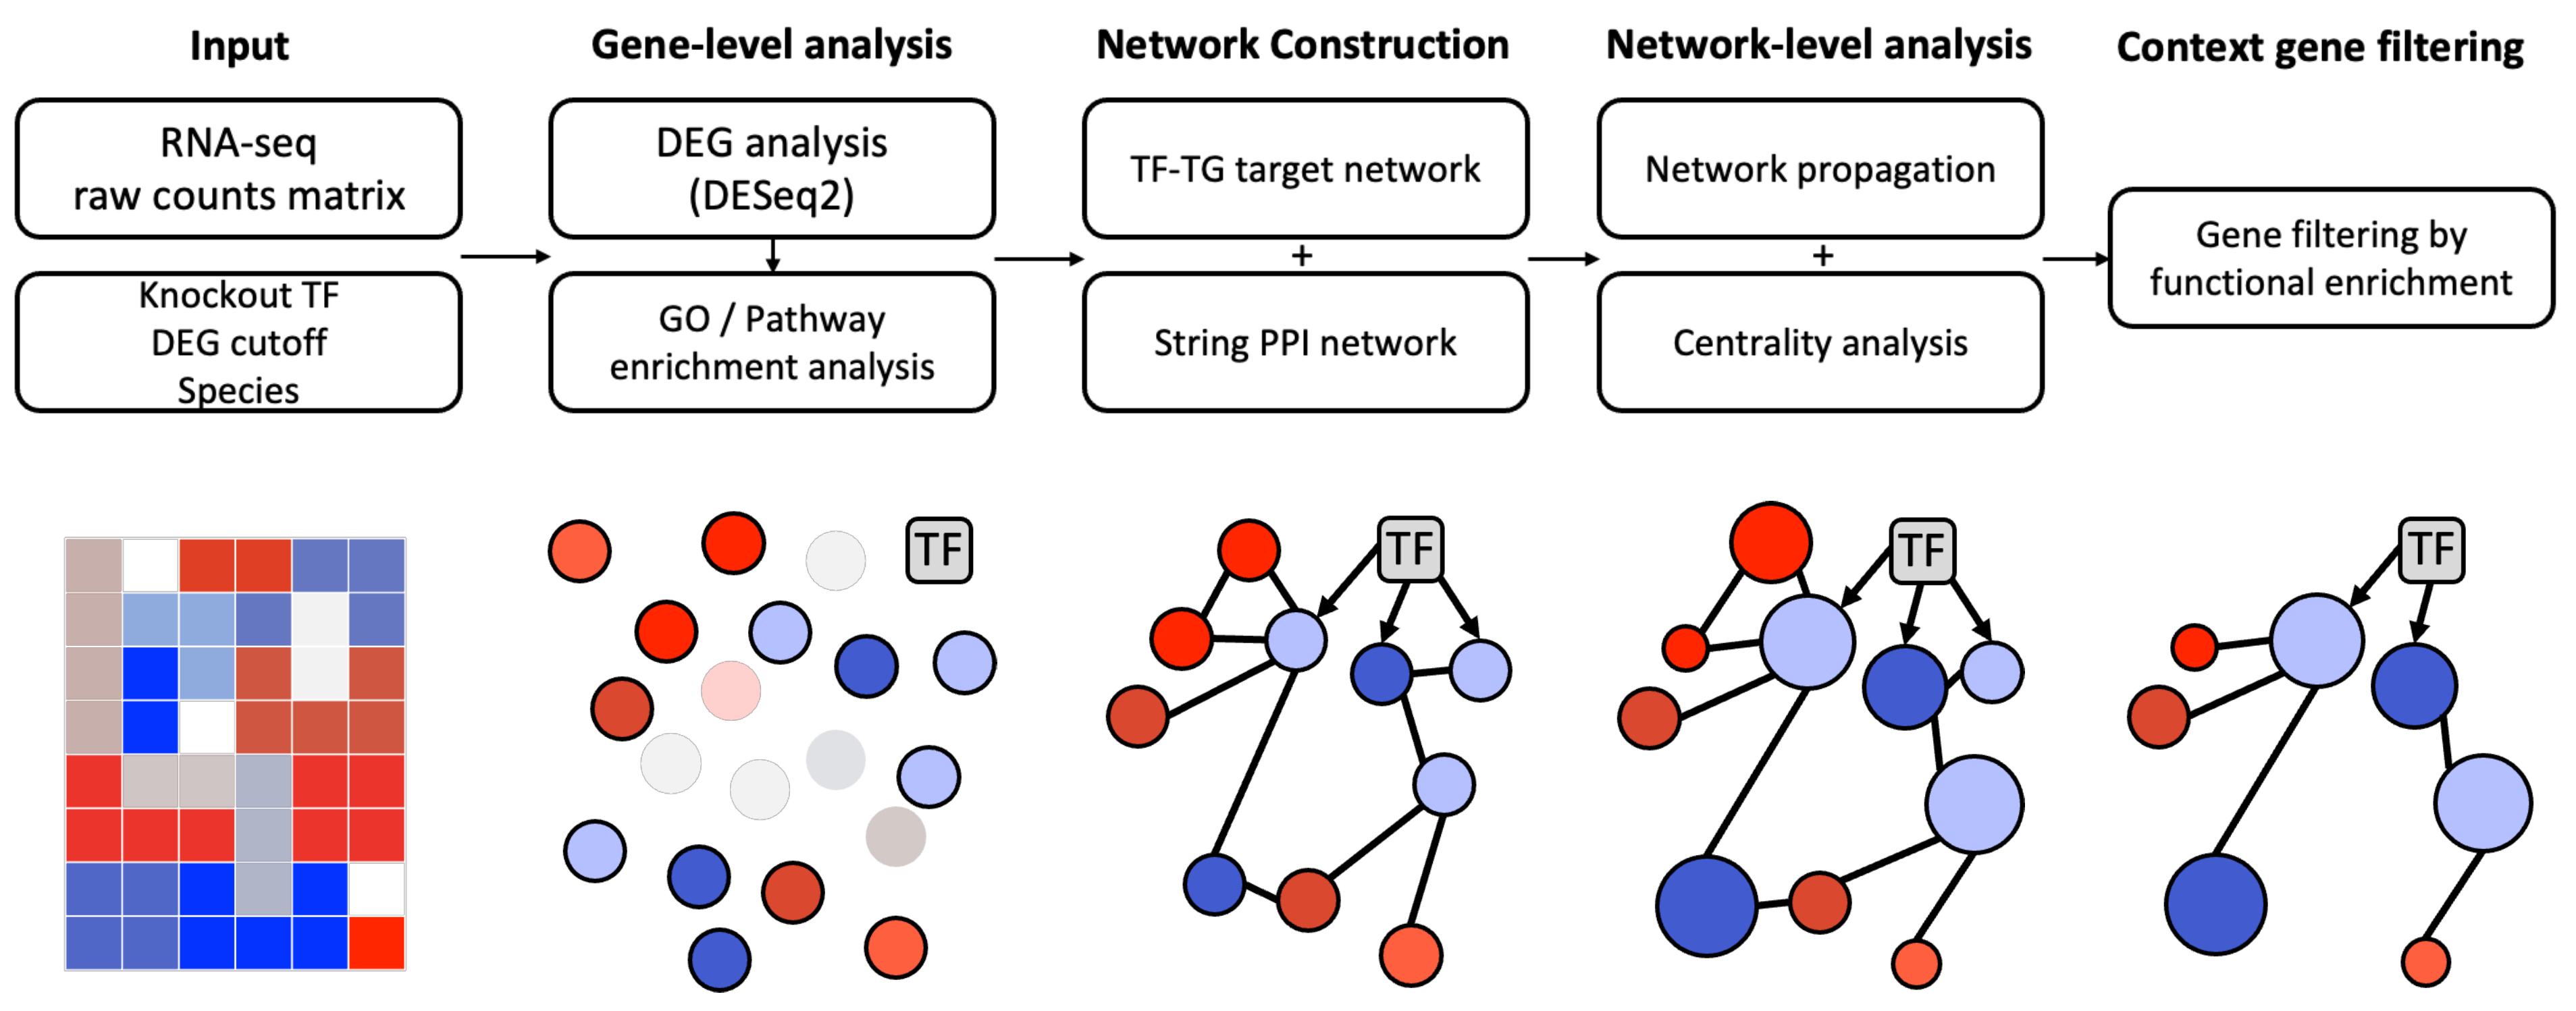
2. Materials and Methods

The workflow of the TFNetPropX system is illustrated in Figure 1. It follows a structured and sequential 5-step process, starting with the input data and progressing through the stages of context-specific gene filtering. It provides a mechanism for visualizing the results of gene- and network-level analysis through an interactive plot. A detailed description of the process is presented in the following section.

2.1. Step 1: Input

The first step in carrying out RNA-seq data analysis using our system is to take input data from users. Our system requires that gene expression raw count matrix data are analyzed, as well as the specific TF gene name of the knockout study and various parameters. The parameters consist of the species of the data, cutoff values including log2 fold change (log2FC) and p-value threshold for differential expression (DE) analysis, and the users’ email address. The currently available species are human and mouse, which will be further extended.
The gene expression data entered by the user are in the form of a raw count matrix, where genes are represented by rows, while samples, wild-type and knockout samples, are represented by columns.Our system does not provide raw sequencing read mapping, so the users must prepare a dataset that has undergone pre-alignment and quantification procedures.
For the running parameters, the users are asked to select the species used for the study of the data, human or mouse, and enter the gene name of the knockout TF. The users are also asked to specify the log2FC and the p-value threshold for the DE analysis. The default log2FC and p-value thresholds are 1 and 0.05, respectively. Setting a higher log2FC threshold or a lower p-value threshold will reduce the number of DEG candidates, and vice versa will increase them, so the user needs to set the appropriate thresholds. When the analysis is complete, our system sends an email to the email addresses that the users entered in the beginning, and the email contains a notification that the analysis is complete and a link to the results.

2.2. Step 2: Gene-Level Analysis

Step 2 is a gene-level analysis, where DEGs are identified based on user-defined thresholds. In the first step of step 2, DESeq2 is used to identify DEGs between the wild-type (WT) and knock-out (KO) groups, using the user-specified log2FC and p-value threshold values [22]. This process extracts relevant genes that show significant expression changes in response to experimental conditions.
After identifying the DEGs, our system uses GSEAPY [23] to perform an enrichment analysis to reveal the functional significance of the DEGs. This enrichment analysis includes five major categories: gene ontology cellular components, biological processes, molecular functions, KEGG pathways and Wiki pathways. The top 10 enriched terms within each category for up- and downregulated DEGs in knockout samples are identified, providing insight into the underlying biological processes and pathways associated with the DEGs.
The gene-level analysis generates three distinct visualization plots: a DEG volcano plot, a gene-level clustering heatmap, and an enrichment plot corresponding to each of the five categories of the enriched term. These graphical representations contribute to a comprehensive understanding of the results. Each plot is created using the Highchart library, to ensure the clarity and interpretability of the analysis results.

2.3. Step 3: Network Construction

Step 3 is network construction, which focuses on exploring knock-out condition-specific interactions within the regulatory landscape. This is achieved by integrating two different approaches to build a comprehensive network of TFs and their associated TGs.
First, the TRRUST v2 database is used to establish connections between user-provided TFs and their associated TGs [15]. In addition, the construction of the comprehensive network includes the incorporation of DEG interactions obtained from the STRING PPI network [13]. To ensure robustness, only interactions with a combined score of 550 or higher in the STRING PPI network are considered.
The integrated network from the TRRUST v2 database and the STRING PPI network results in a comprehensive knockout condition-specific network that reveals the regulatory relationships and functional associations between TFs, TGs, and interacting genes. This network serves as a valuable resource for in-depth network analysis, facilitating the exploration of the intricate regulatory mechanisms involved in the knockout condition.

2.4. Step 4: Network Analysis

Step 4 is a network analysis that aims to score and rank the genes likely to be affected by knock-out TFs from a network topology perspective. This step uses the constructed knock-out condition-specific network and employs network propagation algorithm and betweenness centrality to quantify the impact of knock-out TFs and genes within the network.
First, we estimate the influential possibility of the knockout TF in relation to the other genes on the network through network propagation.Our system runs the random walk with restart (RWR) algorithm to carry out network propagation using TF as a seed gene. The equation for RWR is shown below:
p t + 1 = ( 1 r ) W p t + r p 0
where W is the column-normalized matrix of W , the adjacency matrix representing the knock-out condition-specific network; t is the current time step; p 0 is the vector of the genes, which is initialized either 1 n or 0 for the seed gene and the other genes, respectively, where n is the number of seed genes; p t is the vector at the current time step t; p t + 1 is the vector at the next time step; and r is the restart rate.
Then, our system calculates the betweenness centrality for the genes in the network. Betweenness centrality is a measure of the centrality of the genes in a network, based on how many shortest paths out of all the shortest paths existing in the network pass through the genes. The higher betweenness centrality of a gene, the more biological signals pass through the gene, which in turn implies that such genes are likely to be hubs in the network and play an important role in the gene network. The equation for betweenness centrality is shown below:
B C ( g ) = i g j σ i j ( g ) σ i j
where B C ( g ) is the betweenness centrality of a gene g, σ i j is the total number of shortest paths between any pair of genes i and j, and σ i j ( g ) is the number of shortest paths between gene i and j passing through gene g.
By integrating network propagation and betweenness centrality information, the results of the network analysis provide valuable insights into the regulatory impact of knockout TFs and the relative importance of individual genes in the network. Such network-level analyses allow us to detect important genes that are not detectable at the single gene level and help us to understand biological mechanisms at the network level.

2.5. Step 5: Context-Specific Gene Filtering

Step 5 is a filtering step used to address the problem of too many candidate genes resulting from DEG and network analysis. This large number of candidate genes can hinder the results interpretation, literature exploration, and identification of candidate genes for experimental validation. To overcome this problem, step 5 uses contextual information in the data, i.e., data-driven information such as GO terms or biological pathways that are significantly enriched in the gene-set-level analysis.
From the results of step 2, we select the top 10 significantly enriched GO terms and biological pathways from DEGs and filter the network analysis results to include only genes that belong to these terms. This filtering step reduces the number of candidates and allows us to identify genes that cannot be identified by DEG analysis alone, through considering the network information and biological context of the data.
The result of this network-level analysis is a scatterplot that displays the network propagation score on the x-axis, the betweenness centrality score on the y-axis, and color coding based on the log2 fold change between the different groups. This scatterplot helps to identify significant genes within the context-specific gene set under consideration, providing insights into potential key genes.
In addition, to provide users with a comprehensive overview of gene interactions, we use Cytoscape.js to visualize the interaction network between these context-specific genes [24]. This network visualization provides essential interaction information, facilitating further analysis and hypothesis generation based on the intricate gene regulatory relationships.

2.6. Step 6: Result Page Generation
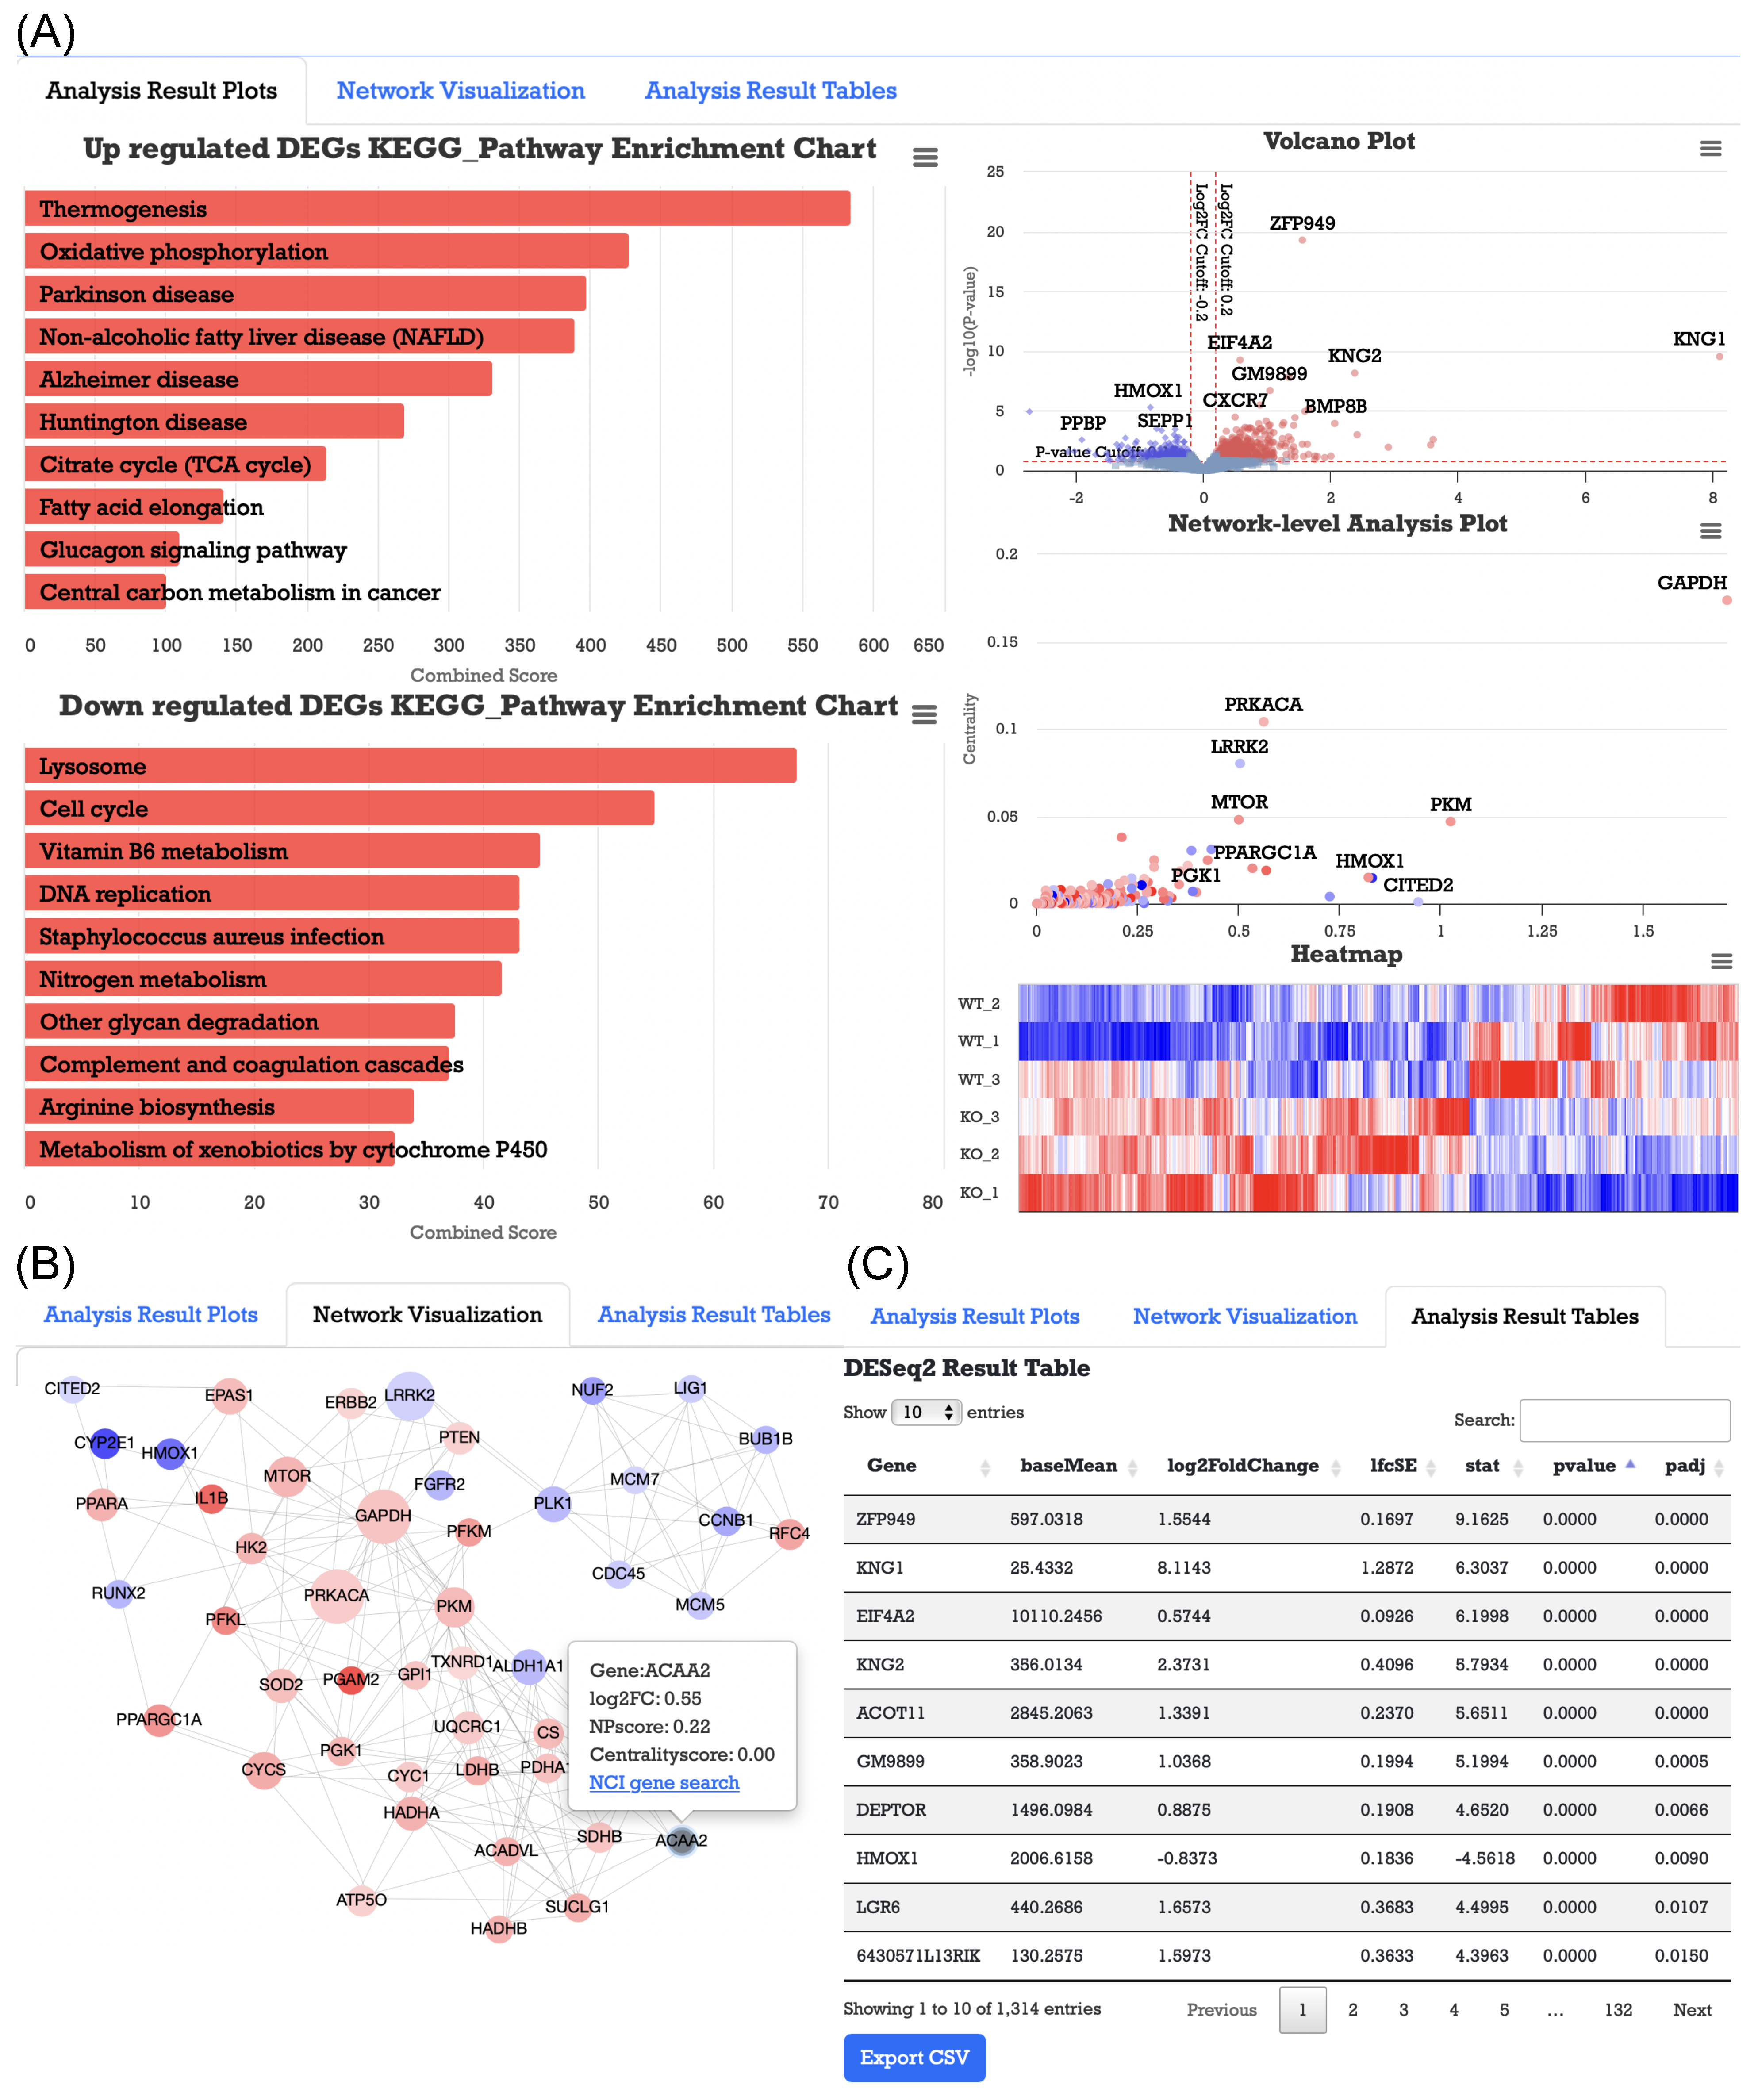
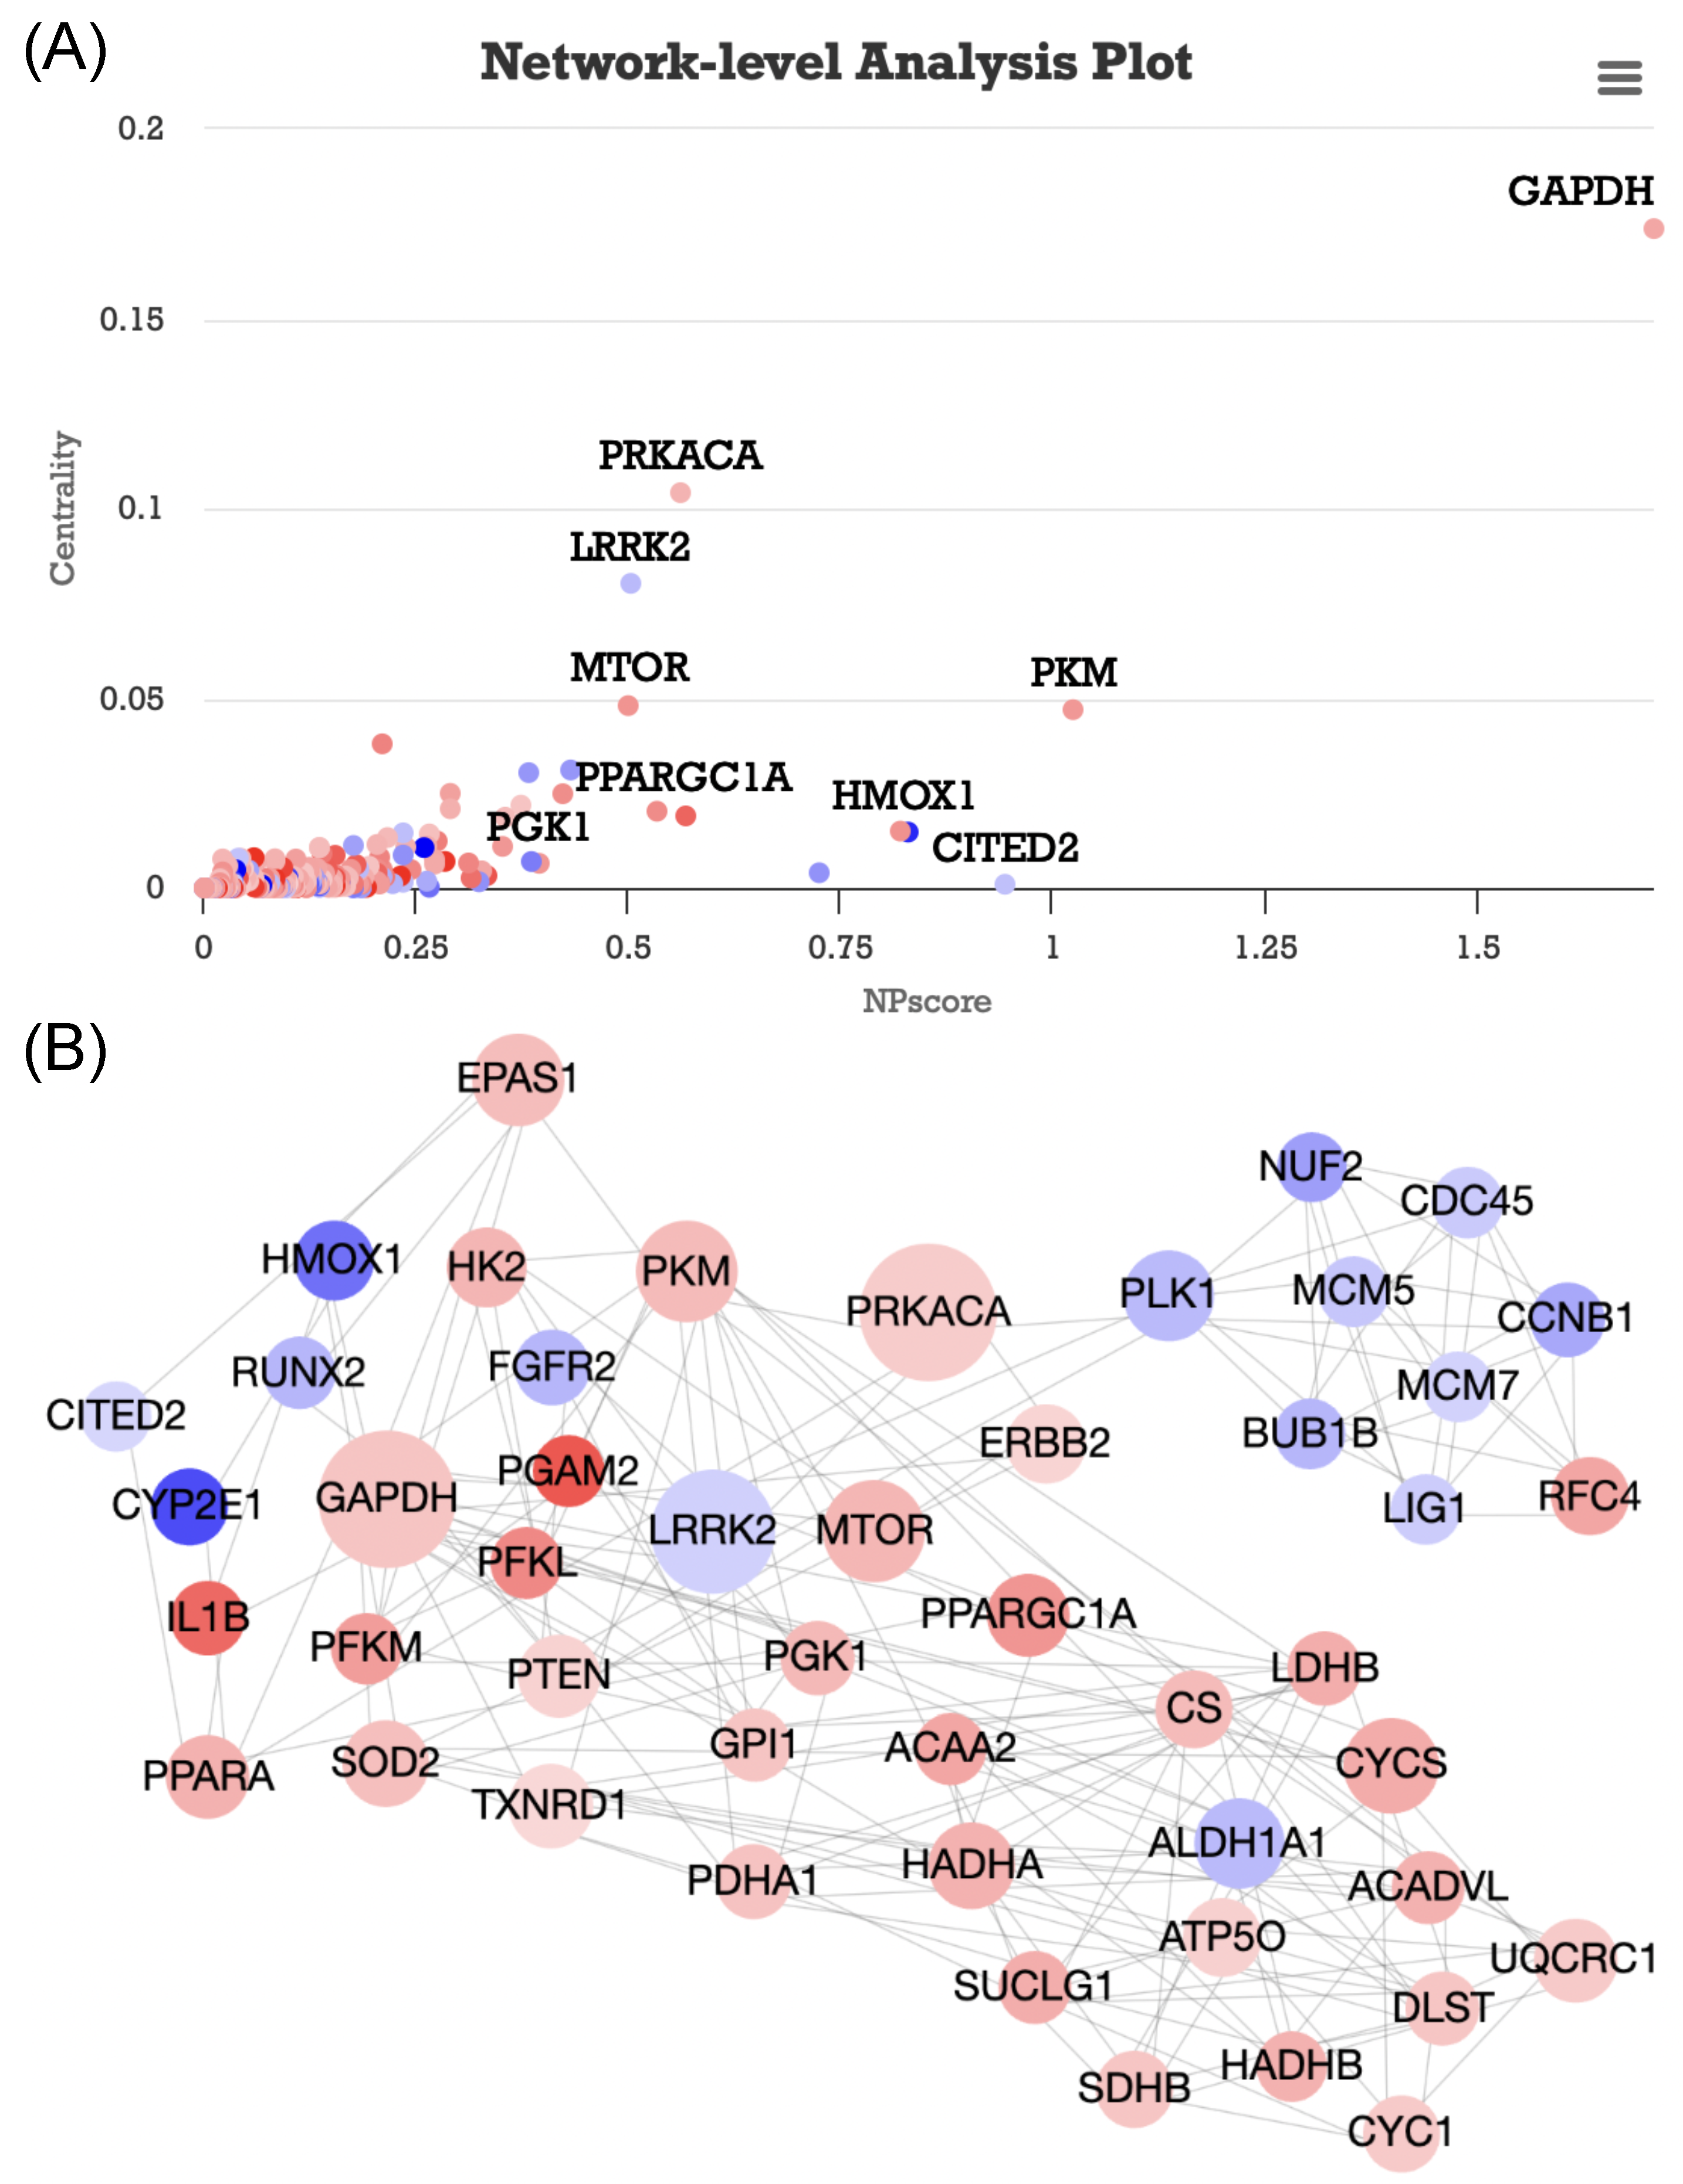
Upon completion of the analysis, the system provides the user with the results via a web-based interface, culminating in the presentation of the analysis results on a dedicated web page. This interface is illustrated in Figure 2. The results page consists of several informative elements, including an analysis results plot, a network visualization, and an analysis results table.
The following paragraphs describe the contents of each tab in detail. The analysis results plots, starting with Figure 2A, provide a comprehensive overview of the results. The bar plot summarizes the results of the enrichment analysis on DEG with user-defined thresholds. This plot shows the top 10 functional enrichment results for GO categories, biological processes, cellular components, and molecular functions, as well as two biological pathways: WikiPathways and KEGG pathways.
The volcano plot places significant DEGs by displaying the log2 fold change of a gene on the x-axis and the negative logarithm of the p-value on the y-axis. For ease of use, the top 20 most significant genes are labeled based on their p-value.Some labels may not be visible if they overlap on the plot, but the user can mouse-over to see the gene name. Network-level analysis plots visually represent significant DEGs associated with TFs at the network level. This plot shows the betweenness centrality score and the network propagation score (NPscore) on the axis, allowing users to identify significant genes within the network. A heat map showing gene expression patterns is the final plot. The heat map plot shows gene expression patterns.
The second tab is the network visualization in Figure 2B, which allows the user to explore gene regulatory and interaction mechanisms. The result is a TF-TG visualization network connected by enriched functionally-related DEGs. In addition, by clicking on a node, the user can check the node-related information, log2FC, NPscore, and centrality score, and it also provides a link to the NCBI gene search page.
The third tab is the analysis result tables shown in Figure 2C, which allows the user to view the result in tabular form and download it by exporting it as a CSV file. Six tables are available to the user, including the DEG analysis results and five enrichment analysis result tables. It is also possible to search for a specific word in the column. Finally, clicking on a term in the table will take the user to the relevant link, so that they can immediately investigate the information associated with the term. The gene is linked to the NCBI link, the GO term to the AmiGO2 link, and WikiPathways to the WikiPathway website link. Finally, when the user clicks on a term in the KEGG pathway table, the user can check the biological function-related genes by displaying an image with DEGs mapped in red in the KEGG pathway image generated by KEGGAPI.

3. Results

To demonstrate the utility of our system, we performed two informative case studies using RNA-seq data coupled with TF knock-out experiments. Using RNA-seq data from GSE179385 and GSE81082 available in the GEO database for TF knock-out and wild-type samples, our system facilitated analysis from the gene to the network level, providing valuable insights.

3.1. Case Study 1: GSE179385 Dataset

The GSE179385 dataset investigates how adipocyte hypoxia-inducible factor 2 α (HIF2α) responds to cold [25]. It presents RNA-seq data for thermoneutral and cold exposures with HIF2α knockout and wild-type mice, each replicated three times. In order to investigate the role of HIF2α upon cold stress, we utilized cold wild-type and cold knockout raw count gene expression matrices as the input. We focused on endothelial PAS domain-containing protein 1 (Epas1), also known as HIF2α, as the knockout TF. Then, we used a log2FC threshold of 0.2 and a p-value threshold of 0.15.
Figure 3 shows the results of the gene-set-level analysis of our system, where the DEGs between the KO and WT samples showed a remarkable enrichment in aspects related to thermogenesis, mitochondrial function, and fatty acid metabolism when exposed to cold conditions. This suggests that HIF2 may be involved in the regulation of thermogenesis.
To explore the genes associated with the thermogenesis pathway, we selected the term “thermogenesis” within the table results, to examine the DEG mapping plot on the KEGG pathway, as shown in Figure 3, accessible via the web interface. Among the DEGs involved in thermogenesis, the uncoupling protein 1 (Ucp1) was upregulated in the KO samples. A previous study showed that modulation of the gut microbiota in HIF2α KO mice primarily stimulated thermogenesis, mainly through the upregulation of Ucp1 in inguinal adipose tissue [26].
To investigate the interaction between HIF2α and DEGs, we visualized the interaction network and Figure 4 shows the network-level analysis. In the network-level analysis plot, certain upregulated candidates had been implicated in thermogenesis in previous investigations. For instance, the mechanistic target of rapamycin kinase (mTOR) gene holds pivotal roles in governing adipogenesis, lipid metabolism, and thermogenesis in adipose tissue [27,28]. The peroxisome proliferator-activated receptor alpha (Ppara) gene regulates Ucp1 gene expression and is known to be a direct activator of peroxisome proliferator-activated receptor gamma coactivator 1-alpha (Ppargc1a) [29,30]. Ppargc1a, which was directly connected with Ppara gene in the network, is known to be a cold-responsive transcriptional coactivator that drives adaptive thermogenesis, which dissipates energy as heat in response to cold stress and overfeeding [31]. A previous study suggested that HIF2α suppresses PKA activity by inducing the expression of miR-3085-3p, resulting in the downregulation of protein kinase cAMP-activated catalytic subunit alpha (Prkaca) [25]. It is also noteworthy that the Prkaca gene is of significant importance at the network level.

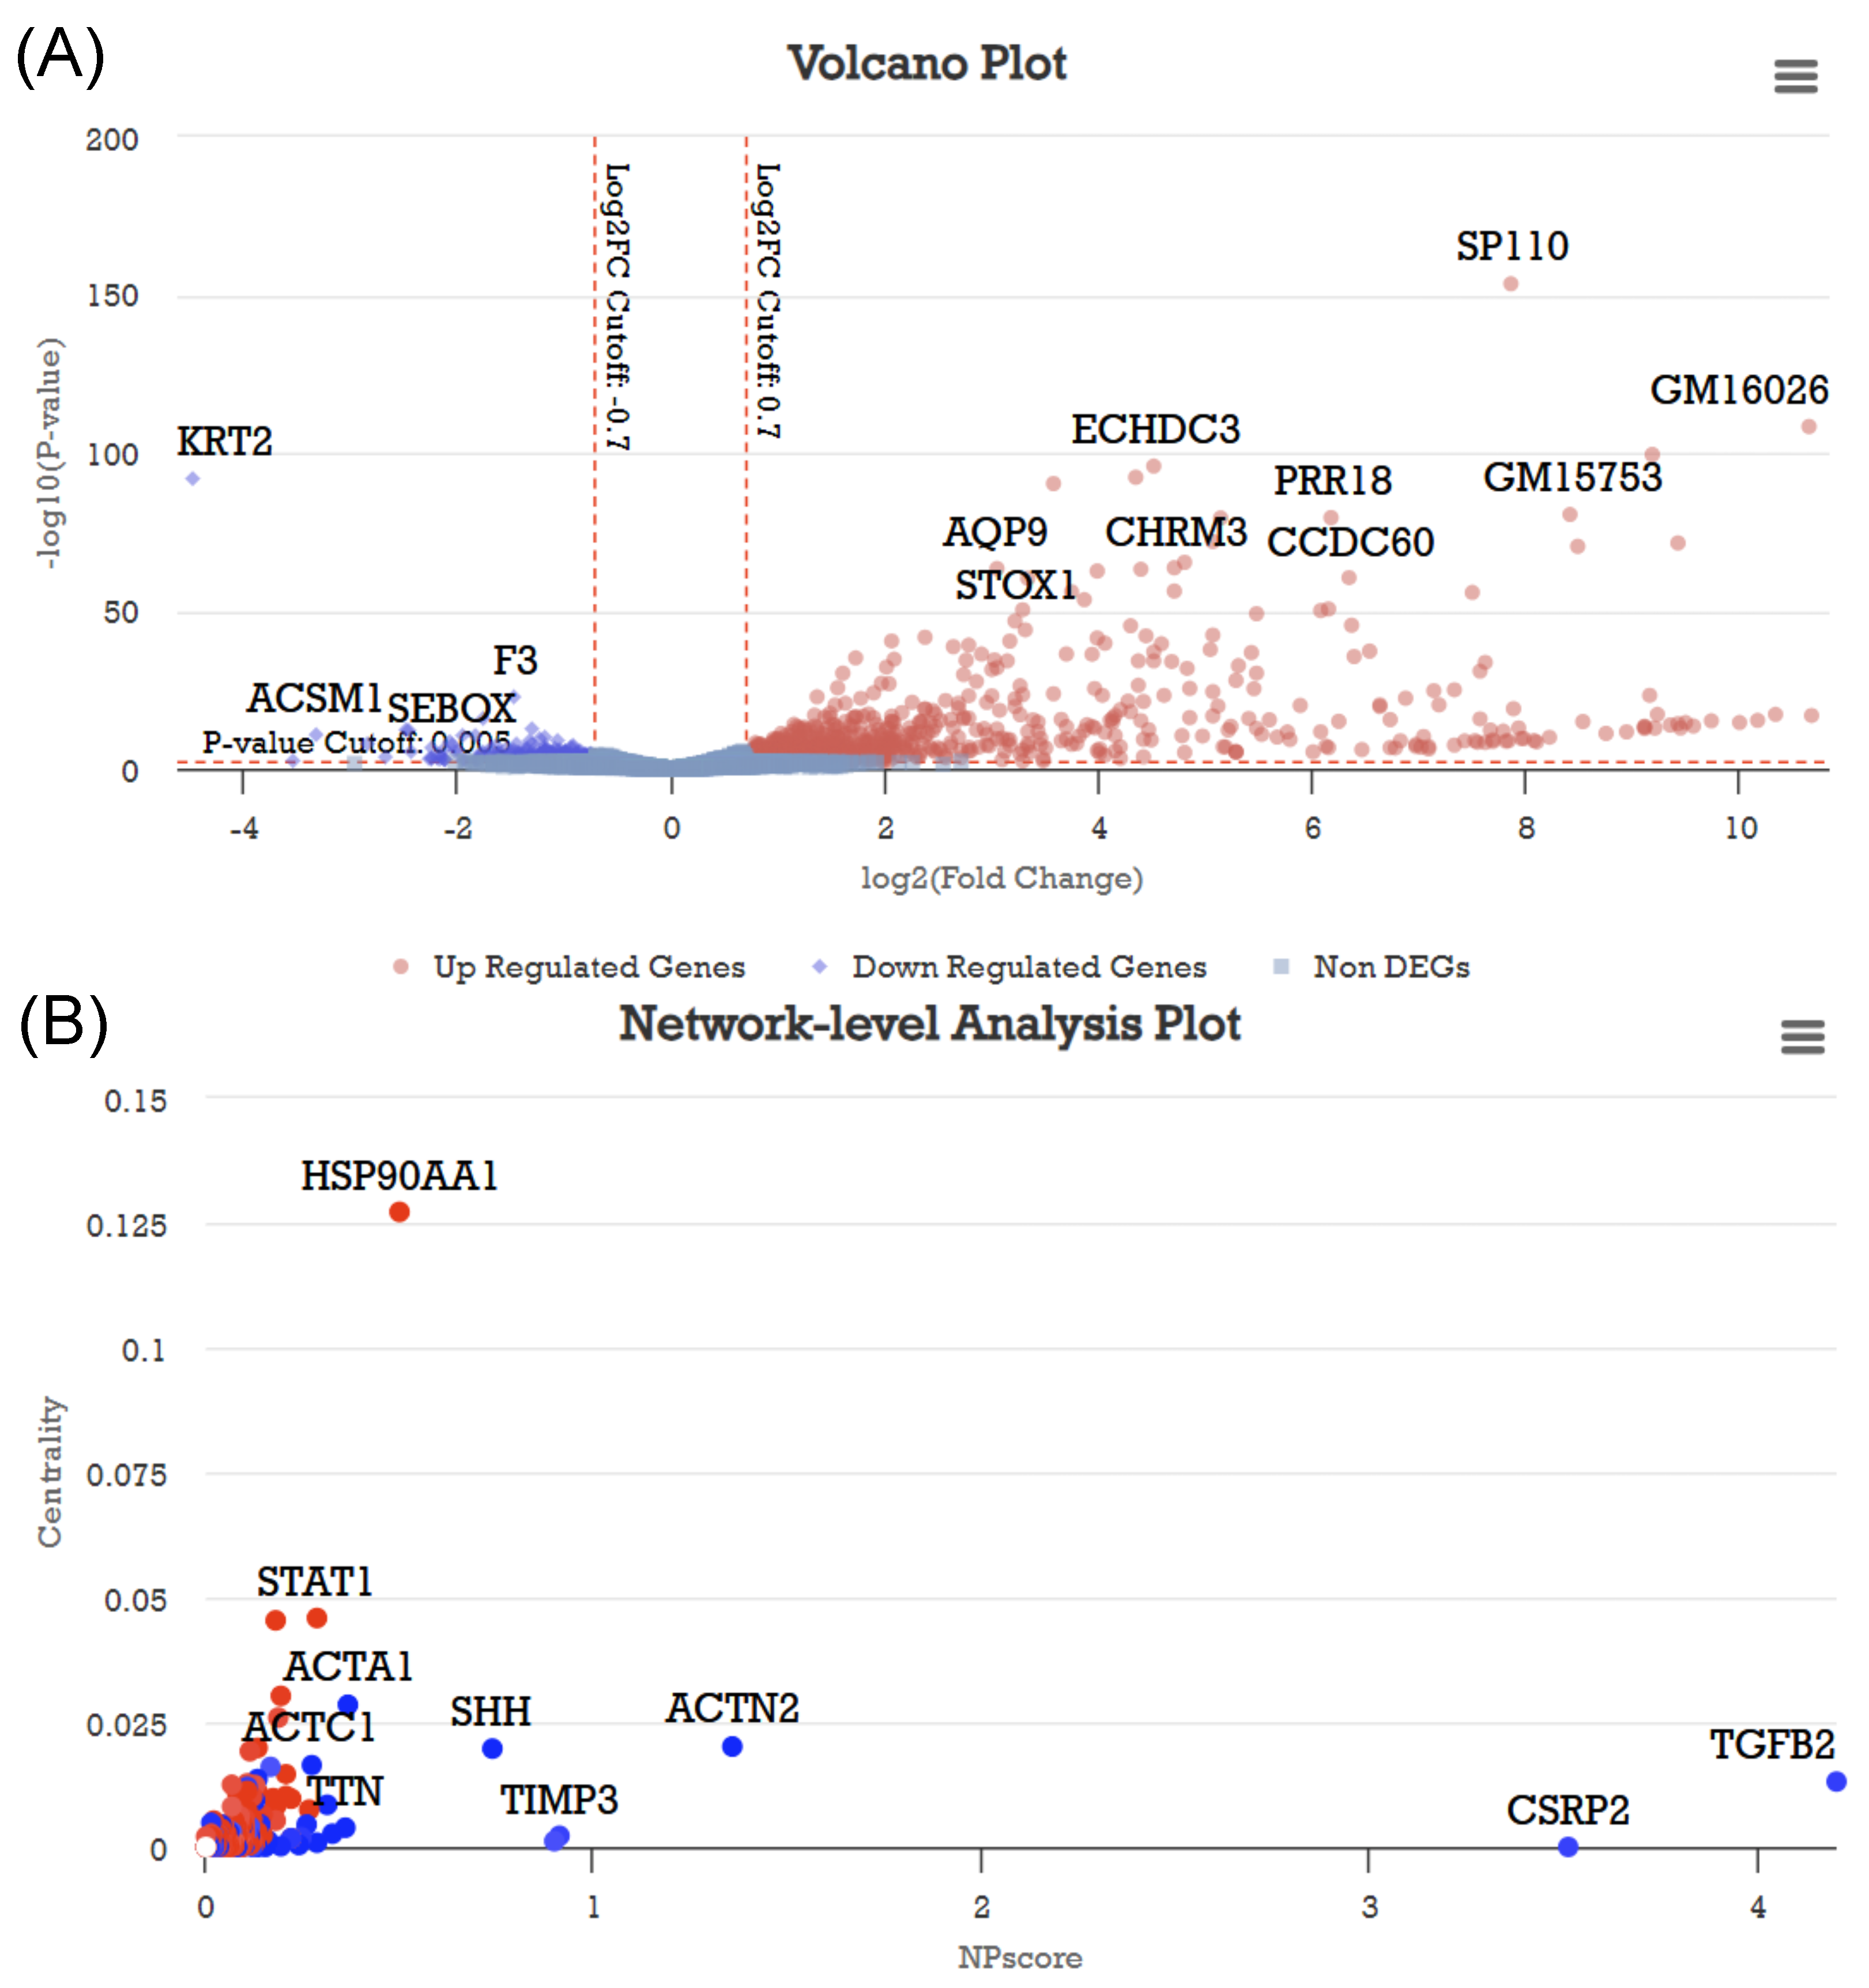
3.2. Case Study 2: GSE81082 Dataset

Williams–Beuren Syndrome (WBS) is a genetic condition associated with multiple symptoms, such as cognitive challenges and craniofacial dysmorphology. It is caused by a genetic abnormality involving genes in chromosome 7q11.23. The GSE81082 dataset was used to study the transcriptional landscape of how dysregulation of Gtf2ird1, one of the genes within a domain of 7q11.23, affects facial dysmorphology using Gtf2ird1 knockout mice.
The DEGs were calculated using DESeq2 and identified using a log2FC cutoff of 0.7 and a p-value cutoff of 0.005; they are visualized using a volcano plot in Figure 5A. Typically, DEGs are ranked either by fold changes or p-values, to be prioritized for downstream analysis. The underlying assumption is that the more perturbed genes are the more biologically important. Therefore, such ranking-based approaches sometimes fail to determine the phenotypically significant DEGs when the expression changes are noncompetitive. Biological phenomena result from the interaction of multiple genes, so the network of genes can explain complex phenotypes or diseases in many cases [32].
Transforming growth factor beta 2 (Tgfb2) is an inhibitor of cell proliferation and is known to be involved in intellectual disability and craniofacial defects [33,34]. The network level analysis suggested this gene as one of the most probable candidates possibly relevant to the phenotype, as shown in Figure 5B. Similarly, Csrp2, known to promote proliferation and cell cycle progression when knocked down, also appeared to be prominent in the network-level analysis result. This gene is known to be downregulated when BEN, one of the TFII-I family of helix–loop–helix TFs, is upregulated in mouse embryonic fibroblasts, and GTF2IRD1 is another member of the TFII-I family sharing considerable sequence and structural similarity with BEN [35,36]. This implies that Csrp2 can be considered a candidate downstream gene of Gtf2ird1. In Figure 6, in the network visualization tab, the topological importance is depicted in detail.The aforementioned genes are the direct target of Gtf2ird1 and their connectivity implies that they may have critical roles in the development of the phenotype.

4. Discussion

We introduced TFNetPropX, a comprehensive web-based RNA-seq data analysis tool. The system provides user-friendly access, allowing users to perform gene, gene-set, and network-level analyses with a single analysis request. This enables easy exploration of disease-specific genes, gene sets, and gene networks focused on targeted TFs. Two case studies demonstrated the utility of TFNetPropX in generating biologically meaningful results. Unlike the existing web tools, our system generates interactive plots of results, overcoming the limitations of static plots. Additional information about genes, GO terms, and biological pathways resulting from the analysis is easily obtained by providing a link to the term’s web page for convenience. In addition, even if there are no KO data, if there are gene expression data for two classes, such as condition or phenotypic subtype, it is possible to select the specific TF that the user wants to focus on and perform a biological analysis of the differences in conditions, focusing on the specific TF. We believe that our web tool represents a tool that will help researchers who want to obtain and analyze gene expression data, by facilitating analysis and providing various insights, helping in biological understanding and developing various biological hypotheses.
Nonetheless, this study has several limitations and areas necessitating enhancement. There is a trade-off between ease of use and specificity of analysis, which needs to be improved to allow more detailed analysis options to be easily performed by the user. Although the running parameters were reduced for ease of use, the user still needs to set the threshold for DEG identification, and the results will vary depending on this value; thus, the user needs to find appropriate parameters according to the data. There is also a need for enhanced network analysis capabilities, potentially including subnetwork features, network clustering, and comprehensive network information extraction. The integration of other types of networks is also being considered, such as disease-gene networks, drug-gene networks, and the integration of multi-omics data with networks. This would provide more comprehensive information to the user, but it is very challenging to analyze these heterogeneous networks. Future work should consider these aspects, to further improve the analytical capabilities and functionality of the system.

Author Contributions

M.O. designed the project. M.O. designed and implemented data analysis algorithm. M.O. and J.H.M. biologically interpreted the case study analysis results. M.O. and J.H.M. wrote and revised the paper. All authors contributed to the article and approved the submitted version. All authors have read and agreed to the published version of the manuscript.

Funding

This work was supported by the 2022 Research Fund of Myongji University.

Institutional Review Board Statement

Not applicable.

Informed Consent Statement

Not applicable.

Data Availability Statement

The TFNetPropX service is freely available at http://ailab.mju.ac.kr/TFNetPropX/ (accessed on 15 October 2023).

Conflicts of Interest

The authors declare no conflict of interest.

References

  1. Conesa, A.; Madrigal, P.; Tarazona, S.; Gomez-Cabrero, D.; Cervera, A.; McPherson, A.; Szcześniak, M.W.; Gaffney, D.J.; Elo, L.L.; Zhang, X.; et al. A survey of best practices for RNA-seq data analysis. Genome Biol. 2016, 17, 1–19. [Google Scholar] [CrossRef]
  2. Stark, R.; Grzelak, M.; Hadfield, J. RNA sequencing: The teenage years. Nat. Rev. Genet. 2019, 20, 631–656. [Google Scholar] [CrossRef]
  3. Costa-Silva, J.; Domingues, D.S.; Menotti, D.; Hungria, M.; Lopes, F.M. Temporal progress of gene expression analysis with RNA-Seq data: A review on the relationship between computational methods. Comput. Struct. Biotechnol. J. 2022. [Google Scholar] [CrossRef]
  4. Seyednasrollah, F.; Laiho, A.; Elo, L.L. Comparison of software packages for detecting differential expression in RNA-seq studies. Briefings Bioinform. 2015, 16, 59–70. [Google Scholar] [CrossRef]
  5. Wang, X.; Sun, Z.; Zimmermann, M.T.; Bugrim, A.; Kocher, J.P. Predict drug sensitivity of cancer cells with pathway activity inference. BMC Med. Genom. 2019, 12, S5. [Google Scholar] [CrossRef]
  6. Allocco, D.J.; Kohane, I.S.; Butte, A.J. Quantifying the relationship between co-expression, co-regulation and gene function. BMC Bioinform. 2004, 5, 18. [Google Scholar] [CrossRef]
  7. Charitou, T.; Bryan, K.; Lynn, D.J. Using biological networks to integrate, visualize and analyze genomics data. Genet. Sel. Evol. 2016, 48, 27. [Google Scholar] [CrossRef]
  8. Subramanian, A.; Tamayo, P.; Mootha, V.K.; Mukherjee, S.; Ebert, B.L.; Gillette, M.A.; Paulovich, A.; Pomeroy, S.L.; Golub, T.R.; Lander, E.S.; et al. Gene set enrichment analysis: A knowledge-based approach for interpreting genome-wide expression profiles. Proc. Natl. Acad. Sci. USA 2005, 102, 15545–15550. [Google Scholar] [CrossRef]
  9. Xie, Z.; Bailey, A.; Kuleshov, M.V.; Clarke, D.J.; Evangelista, J.E.; Jenkins, S.L.; Lachmann, A.; Wojciechowicz, M.L.; Kropiwnicki, E.; Jagodnik, K.M.; et al. Gene set knowledge discovery with Enrichr. Curr. Protoc. 2021, 1, e90. [Google Scholar] [CrossRef]
  10. Kanehisa, M.; Furumichi, M.; Tanabe, M.; Sato, Y.; Morishima, K. KEGG: New perspectives on genomes, pathways, diseases and drugs. Nucleic Acids Res. 2017, 45, D353–D361. [Google Scholar] [CrossRef]
  11. Karlebach, G.; Shamir, R. Modelling and analysis of gene regulatory networks. Nat. Rev. Mol. Cell Biol. 2008, 9, 770–780. [Google Scholar] [CrossRef]
  12. Gardy, J.L.; Lynn, D.J.; Brinkman, F.S.; Hancock, R.E. Enabling a systems biology approach to immunology: Focus on innate immunity. Trends Immunol. 2009, 30, 249–262. [Google Scholar] [CrossRef]
  13. Szklarczyk, D.; Kirsch, R.; Koutrouli, M.; Nastou, K.; Mehryary, F.; Hachilif, R.; Gable, A.L.; Fang, T.; Doncheva, N.T.; Pyysalo, S.; et al. The STRING database in 2023: Protein–protein association networks and functional enrichment analyses for any sequenced genome of interest. Nucleic Acids Res. 2023, 51, D638–D646. [Google Scholar] [CrossRef]
  14. Matys, V.; Fricke, E.; Geffers, R.; Gößling, E.; Haubrock, M.; Hehl, R.; Hornischer, K.; Karas, D.; Kel, A.E.; Kel-Margoulis, O.V.; et al. TRANSFAC®: Transcriptional regulation, from patterns to profiles. Nucleic Acids Res. 2003, 31, 374–378. [Google Scholar] [CrossRef]
  15. Han, H.; Cho, J.W.; Lee, S.; Yun, A.; Kim, H.; Bae, D.; Yang, S.; Kim, C.Y.; Lee, M.; Kim, E.; et al. TRRUST v2: An expanded reference database of human and mouse transcriptional regulatory interactions. Nucleic Acids Res. 2018, 46, D380–D386. [Google Scholar] [CrossRef]
  16. Zhang, Q.; Liu, W.; Zhang, H.M.; Xie, G.Y.; Miao, Y.R.; Xia, M.; Guo, A.Y. hTFtarget: A comprehensive database for regulations of human transcription factors and their targets. Genom. Proteom. Bioinform. 2020, 18, 120–128. [Google Scholar] [CrossRef]
  17. Cowen, L.; Ideker, T.; Raphael, B.J.; Sharan, R. Network propagation: A universal amplifier of genetic associations. Nat. Rev. Genet. 2017, 18, 551–562. [Google Scholar] [CrossRef]
  18. Zhang, W.; Ma, J.; Ideker, T. Classifying tumors by supervised network propagation. Bioinformatics 2018, 34, i484–i493. [Google Scholar] [CrossRef]
  19. Pak, M.; Jeong, D.; Moon, J.H.; Ann, H.; Hur, B.; Lee, S.; Kim, S. Network propagation for the analysis of multi-omics data. In Recent Advances in Biological Network Analysis: Comparative Network Analysis and Network Module Detection; Springer: Berlin/Heidelberg, Germany, 2021; pp. 185–217. [Google Scholar]
  20. Barel, G.; Herwig, R. NetCore: A network propagation approach using node coreness. Nucleic Acids Res. 2020, 48, e98. [Google Scholar] [CrossRef]
  21. Charmpi, K.; Chokkalingam, M.; Johnen, R.; Beyer, A. Optimizing network propagation for multi-omics data integration. PLoS Comput. Biol. 2021, 17, e1009161. [Google Scholar] [CrossRef]
  22. Love, M.I.; Huber, W.; Anders, S. Moderated estimation of fold change and dispersion for RNA-seq data with DESeq2. Genome Biol. 2014, 15, 550. [Google Scholar] [CrossRef] [PubMed]
  23. Fang, Z.; Liu, X.; Peltz, G. GSEApy: A comprehensive package for performing gene set enrichment analysis in Python. Bioinformatics 2023, 39, btac757. [Google Scholar] [CrossRef] [PubMed]
  24. Franz, M.; Lopes, C.T.; Fong, D.; Kucera, M.; Cheung, M.; Siper, M.C.; Huck, G.; Dong, Y.; Sumer, O.; Bader, G.D. Cytoscape. js 2023 update: A graph theory library for visualization and analysis. Bioinformatics 2023, 39, btad031. [Google Scholar] [CrossRef]
  25. Han, J.S.; Jeon, Y.G.; Oh, M.; Lee, G.; Nahmgoong, H.; Han, S.M.; Choi, J.; Kim, Y.Y.; Shin, K.C.; Kim, J.; et al. Adipocyte HIF2α functions as a thermostat via PKA Cα regulation in beige adipocytes. Nat. Commun. 2022, 13, 3268. [Google Scholar] [CrossRef]
  26. Wu, Q.; Liang, X.; Wang, K.; Lin, J.; Wang, X.; Wang, P.; Zhang, Y.; Nie, Q.; Liu, H.; Zhang, Z.; et al. Intestinal hypoxia-inducible factor 2α regulates lactate levels to shape the gut microbiome and alter thermogenesis. Cell Metab. 2021, 33, 1988–2003. [Google Scholar] [CrossRef]
  27. Cai, H.; Dong, L.Q.; Liu, F. Recent advances in adipose mTOR signaling and function: Therapeutic prospects. Trends Pharmacol. Sci. 2016, 37, 303–317. [Google Scholar] [CrossRef]
  28. Ye, Y.; Liu, H.; Zhang, F.; Hu, F. mTOR signaling in Brown and Beige adipocytes: Implications for thermogenesis and obesity. Nutr. Metab. 2019, 16, 74. [Google Scholar] [CrossRef]
  29. Xue, B.; Coulter, A.; Rim, J.S.; Koza, R.A.; Kozak, L.P. Transcriptional synergy and the regulation of Ucp1 during brown adipocyte induction in white fat depots. Mol. Cell. Biol. 2005, 25, 8311–8322. [Google Scholar] [CrossRef]
  30. Hondares, E.; Rosell, M.; Díaz-Delfín, J.; Olmos, Y.; Monsalve, M.; Iglesias, R.; Villarroya, F.; Giralt, M. Peroxisome proliferator-activated receptor α (PPARα) induces PPARγ coactivator 1α (PGC-1α) gene expression and contributes to thermogenic activation of brown fat: Involvement of PRDM16. J. Biol. Chem. 2011, 286, 43112–43122. [Google Scholar] [CrossRef]
  31. Liang, H.; Ward, W.F. PGC-1α: A key regulator of energy metabolism. In Advances in Physiology Education; American Physiological Society: Washington, DC, USA, 2006. [Google Scholar]
  32. Wang, X.; Dalkic, E.; Wu, M.; Chan, C. Gene module level analysis: Identification to networks and dynamics. Curr. Opin. Biotechnol. 2008, 19, 482–491. [Google Scholar] [CrossRef]
  33. Sanford, L.P.; Ormsby, I.; Groot, A.C.G.d.; Sariola, H.; Friedman, R.; Boivin, G.P.; Cardell, E.L.; Doetschman, T. TGFβ2 knockout mice have multiple developmental defects that are non-overlapping with other TGFβ knockout phenotypes. Development 1997, 124, 2659–2670. [Google Scholar] [CrossRef] [PubMed]
  34. Boileau, C.; Guo, D.C.; Hanna, N.; Regalado, E.S.; Detaint, D.; Gong, L.; Varret, M.; Prakash, S.K.; Li, A.H.; d’Indy, H.; et al. TGFB2 mutations cause familial thoracic aortic aneurysms and dissections associated with mild systemic features of Marfan syndrome. Nat. Genet. 2012, 44, 916–921. [Google Scholar] [CrossRef]
  35. Chimge, N.O.; Mungunsukh, O.; Ruddle, F.; Bayarsaihan, D. Expression profiling of BEN regulated genes in mouse embryonic fibroblasts. J. Exp. Zool. Part B 2007, 308, 209–224. [Google Scholar] [CrossRef]
  36. Makeyev, A.V.; Bayarsaihan, D. New TFII-I family target genes involved in embryonic development. Biochem. Biophys. Res. Commun. 2009, 386, 554–558. [Google Scholar] [CrossRef]
Figure 1. The workflow of TFNetPropX.
Applsci 13 11399 g001
Figure 2. Analysis results of TFNetPropX. ((A) Analysis result plots.) A tab that displays the analysis result as an interactive plot. Even if there is no label, the tooltip for the entity will appear when the mouse is held over it. ((B) Network visualization.) A tab that visualizes the TF network results. Clicking on a node gives information about the gene and a link to the NCI gene search page. ((C) Analysis result tables.) This tab shows a table for each analysis result. These can be searched, sorted, and downloaded in CSV format. Clicking on each term provides a pathway DEG mapping plot or a link to the term.
Applsci 13 11399 g002
Figure 3. Functional enrichment analysis of genes upregulated in KO in the GSE179385 dataset. Thermogenesis-related terms were highly enriched, and the plot below shows the mapping of KO DEGs to the Thermogenesis KEGG pathway in red.
Applsci 13 11399 g003
Figure 4. Network analysis of the GSE179385 dataset. ((A) Network level analysis plot.) The network analysis result is displayed in a scatter plot and this reveals that Prkaca is one of the most probable candidates. ((B) TF Network Visualization using Cytoscape.js.) The network analysis result was visualized in a network. The connectivity and interactions of Epas1 and its downstream genes can be easily observed.
Applsci 13 11399 g004
Figure 5. Analysis result of the GSE81082 dataset. ((A) Volcano Plot) The DEGs were detected with a log2 fold change of 0.7 and p-value of 0.005. ((B) Network level analysis plot) The network analysis result is displayed in a scatter plot and this reveals that Tgfb2 was one of the most probable candidates.
Applsci 13 11399 g005
Figure 6. TF Network visualization using the Cytoscape.js. The network analysis result is visualized in a network. The connectivity and interactions of Gtf2ird1 and its downstream genes can be easily observed.
Applsci 13 11399 g006
Disclaimer/Publisher’s Note: The statements, opinions and data contained in all publications are solely those of the individual author(s) and contributor(s) and not of MDPI and/or the editor(s). MDPI and/or the editor(s) disclaim responsibility for any injury to people or property resulting from any ideas, methods, instructions or products referred to in the content.

