Article

Application of Hardening State Parameter Constitutive Model for Prediction of Overconsolidated Soft Clay Behavior Due to Embankment Loading

by
Nikola Obradović
*,
Sanja Jocković
and
Mirjana Vukićević
Faculty of Civil Engineering, University of Belgrade, 11120 Belgrade, Serbia
*
Author to whom correspondence should be addressed.
Appl. Sci. 2023, 13(4), 2175; https://doi.org/10.3390/app13042175
Submission received: 17 January 2023 / Revised: 3 February 2023 / Accepted: 6 February 2023 / Published: 8 February 2023
(This article belongs to the Section Civil Engineering)

Abstract

:
This paper investigates the possibility of the application of the HArdening State Parameter (HASP) constitutive model for numerical modelling of overconsolidated soft clay under embankment loading. The HASP constitutive model is a critical state soil model with a combined hardening rule that uses a state parameter to determine the dilatancy of overconsolidated clay. The model overcomes some shortcomings of the Modified Cam Clay (MCC) model in the prediction of overconsolidated clay’s behavior, while preserving the simplicity and the same set of five parameters. The HASP model was implemented in finite element software. In order to verify the applicability of the model in predicting the behavior of soft overconsolidated clay due to embankment loading, two examples reported in the literature are analyzed. The numerical predictions of the HASP model are compared with the field measurements of ground settlements and pore water pressures, and with the MCC model’s predictions. The results indicate that the HASP model predicts the development of the settlements of the overconsolidated soft clay deposits with a high accuracy from an engineering point of view. There are certain deviations from the field measurements in predicting the pore pressure development, which is often observed for other models as well. For the embankment settlement assessment, as important serviceability issue, the HASP model has an advantage over more complex models that require a large number of parameters. Since the parameters of the HASP model are obtained from standard laboratory tests, it can be easily applied for routine geotechnical analyses.

1. Introduction

Prediction of the behavior of soil as a foundation for various man-made structures represents a very important part of geotechnical engineering. The types of soils and the natural ground conditions are so diverse that the task of determining how the soil will perform under an imposed load, or under various construction works, can be complex. Thus, the development and application of advanced constitutive soil models, which can include different aspects of soil behavior, is a very significant task for both researchers and geotechnical engineers. A soft soil deposit can be very demanding for modeling, design, and construction, even with the considerable developments in geotechnical engineering during the past several decades [1]. Overconsolidated soft clays are acknowledged as one of the most problematic soils because of their deficient mechanical properties [2]. The mechanical properties of overconsolidated soft clays depend on the causes of overconsolidation such as desiccation stresses due to moisture extraction by plant roots and surface evaporation, secondary consolidation, changes in static groundwater level, and the erosion of surface material [3].
Earthfill embankments, used for supporting roads, railroads and serving as floodwalls along riverfronts and coastlands, are often built on soft soil deposits [4]. In the past, embankments were built on firm soil in order to reduce construction costs, but in recent years, they are increasingly being built on sites consisting of soil layers with poor mechanical characteristics [5]. Because of such geotechnical conditions, it is very important to accurately assess the mechanical behavior of the soil, especially settlement. The use of numerical methods, such as the finite element method, requires the proper formulation of constitutive laws that can reproduce all of the important aspects of a soil’s behavior. A good way to validate the suitability of the constitutive model used for clay soil is a comparison of the predicted and field-measured behaviors [6].
One of the most widely used elastoplastic soil constitutive models for modeling clays’ behavior is the Modified Cam Clay (MCC) model [7]. Due to its simplicity, well established model parameters, and its ability to satisfactorily predict some facets of clayey soil’s behavior, it is usually the first model of choice employed in numerical analyses [1,6,8,9,10,11,12,13,14,15]. Although the MCC model can adequately describe the behavior of normally or slightly overconsolidated clay, it possesses certain drawbacks when used for overconsolidated clays [16,17]. The Soft Soil (SS) constitutive model was developed for soft soils, such as slightly overconsolidated clays, clayey silts, and peats, as a modification of the MCC model [9,18]. The Soft Soil Creep (SSC) model is the improved SS model, with the ability to model creep behavior of soft clays susceptible to secondary consolidation using the logarithmic creep function [18,19]. Both SS and SSC combine the Mohr-Coulomb failure criterion with the cap yield surface of the MCC model. One of the drawbacks of the previous three constitutive models is that they are isotropic yielding models. The S-CLAY1 and S-CLAY1S constitutive models are developed in the critical state framework, and can account for plastic strain induced anisotropy (S-CLAY1) and anisotropy combined with destructuration (S-CLAY1S) [9,10,20]. Application of the MELANIE model, which represents a modification of the MCC model for anisotropic conditions with a non-associated flow rule, can be found in [14,21]. The MIT-E3 [22] constitutive model, based on bounding surface plasticity, has also been used to predict overconsolidated soft clays’ behavior as an embankment base [21,23]. The MIT-E3 model incorporates: anisotropic yield surface, kinematic plasticity, strain softening behavior under undrained conditions, small nonlinear elasticity using a closed loop hysteretic stress-strain formulation, and bounding surface plasticity [24]. Other advanced constitutive models have been applied: the bubble model of Al Tabba&Wood [25], the elastoplastic constitutive model with isotach viscosity [26], and EVP-SANICLAY [1].
As the complexity of the mentioned constitutive models increases, the number of model material parameters also increases. Many of those model parameters are difficult to determine from conventional laboratory tests, and as a consequence, application of these advanced models is limited for routine analyses. The HASP (HArdening State Parameter) model is a critical state bounding surface constitutive model for describing the mechanical behavior of overconsolidated clays [27]. It provides a more realistic prediction of overconsolidated clay behavior while retaining the simplicity and the same number of model parameters as the MCC model. The HASP model introduces a new expression of the hardening rule with a state parameter as a state variable [28], and the yield surface always passes through the current stress point, thus enabling elastoplastic behavior even in the early stages of loading. The state parameter is a key parameter for describing the typical behavior of overconsolidated clays, which is manifested by hardening, peak strength, and softening under drained conditions, as well as the development of negative pore pressures under undrained conditions.

2. Objectives of the Study

The estimation of the rate and total settlement of embankments is an important engineering task, taking into account the necessity of maintaining the top elevation at the design level. Considering that soft foundation soil is subjected to the processes of consolidation and creep, large settlements can be induced, requiring the raising of the embankment height [4]. The stiffness and strength anisotropy, and the rate-dependent behavior, of soft foundation soil make the analysis challenging and computationally demanding. Most often, sufficient data to describe all the mentioned soil characteristics is not available, and simple constitutive models are preferred in conventional design procedures.
The aim and the novelty of this study is to investigate the capabilities of the simple HASP constitutive model in predicting the behavior of overconsolidated soft clay during and after embankment construction. Using the state of the soil as an important determinant of its mechanical response, and without introducing anisotropy and creep parameters in constitutive relations, an attempt has been made to address the above-mentioned problem.
Thus, two examples of soft overconsolidated clay behaviors, due to embankment loading, reported in the literature [6,8], are analyzed. For the selected embankments, there was a good instrumentation system for monitoring settlement and pore water pressures over time. Also, site investigation and laboratory testing were performed for both sites, and calibrated material parameters for the MCC constitutive model were reported. The same material parameters are adopted for the HASP model. The initial conditions are also well-documented and reproduced in the study.
The numerical predictions are performed using the PLAXIS 2D software, in which the HASP model was previously implemented via a user subroutine. Coupled hydro-mechanical analyses were conducted with appropriate mechanical and hydraulic boundary conditions. The obtained results are compared with the field measurements. The complete numerical procedures in the study correspond to those described in references [6,8].
Additionally, in order to compare the HASP model predictions to predictions of other constitutive models, in PLAXIS 2D, a series of numerical calculations were carried out using the MCC model for clay layers. Although there are many other constitutive models available in PLAXIS 2D that could be used for comparison, the available data from [6,8] for the clay layers was insufficient to reliably determine the parameters of those models.

3. HASP Constitutive Soil Model

The relations of the HASP model are established on the following assumptions: soil is isotropic, plastic strains develop from the very beginning of loading, and the hardening parameter depends on the increments of the plastic volumetric and shear strains. The HASP model is formulated in the triaxial p q plane. It uses the MCC surface as the bounding surface, and its size is defined by the value of maximum mean effective stress p ¯ 0 (Figure 1a). The bounding surface has all the properties of the MCC surface. The volume decreases and the surface expands for stress ratios below the critical state line (CSL), while the volume increases and the surface shrinks for stress ratios above the CSL. The yield surface expands until peak strength is reached at the stress ratio η = M f , after which it shrinks (softening) until the critical state is reached. The HASP model is capable of predicting the saturated clay response under monotonic drained and undrained loading sufficiently accurately, as demonstrated in [27,29,30].
The point A   ( p , q ) , representing the current stress state, is on the inner yield surface, whose size is defined by the value of the mean effective stress p 0 (Figure 1a). There is no pure elastic domain and stress point A is always on the yield surface. Radial mapping implies that point A corresponds to the conjugate point A ¯ ( p ¯ , q ¯ ) , so that the following is fulfilled:
η = q p = q ¯ p ¯ .
In order to use the HASP model to provide reliable simulations of practical boundary value problems, the model relations must be defined in the general stress state. This generalization can be efficiently performed by expressing the stress invariant q in terms of the second invariant of the deviatoric stress tensor J 2 D :
q = 3 J 2 D .
The originally proposed yield and bounding surfaces in the deviatoric plane are circles [27], which is consistent with the original formulation of the MCC model [7]. Because a circle does not represent appropriately the failure conditions for soils, a modification is introduced by replacing the constant critical state strength parameter M with proper Lode angle dependent criterion, to define the shape of the yield and bounding surfaces in the deviatoric plane. The yield surface is defined by:
F ( p , q , θ ) = ( q M ( θ ) ) 2 + p ( p p 0 ) = 0 .
While the bounding surface is defined by:
F ¯ ( p ¯ , q ¯ , θ ) = ( q ¯ M ( θ ) ) 2 + p ¯ ( p ¯ p ¯ 0 ) ,
where M ( θ ) is the gradient of the critical state line in q p plane for the current value of θ . Many failure surfaces, which are continuous and agree well with the experimental results in the deviatoric plane [31], have been suggested. A failure criterion dependent on the Lode angle is introduced in the HASP model by means of the relation proposed in [32]:
M ( θ ) = X · ( 1 + Y · s i n 3 θ ) Z ,
where X, Y and Z are constants, determined in such a way that the appropriate shapes of the yield and bounding surfaces are achieved. The use of this shape takes into account the effect of the intermediate principal stress by allowing the simulation of the shear strength variation in the deviatoric plane, and the fact that strength in triaxial compression is different than in triaxial extension [33]. The Lode angle is expressed as [24]:
θ = 1 3 · s i n 1 ( 27 2 · J 3 D q 3 ) ,
where J 3 D is the third invariant of the deviatoric stress tensor. From Equation (6), a value of θ = 30 ° corresponds to triaxial compression, a value of θ = 30 ° to triaxial extension and a value θ = 0 ° to plane strain conditions. For a constant Z in Equation (5), a value of 0.229 is assumed in order to achieve convexity of the yield surface [32]. The magnitudes of the other two constants (X and Y) are determined from the condition that the value of M obtained from triaxial compression and triaxial extension is matched. The plastic potential is defined by:
P ( p , q ) = ( q M ( θ c ) ) 2 + p ( p p 0 ) = 0 ,
where θ c is the current value of the Lode angle at the point in stress space at which the gradients of the plastic potential are required and therefore the plastic potential has rotational symmetry [24]. As a consequence of that, the shape of the plastic potential in the deviatoric plane is a circle. As the shape of the yield surface and plastic potential are not the same in the deviatoric plane, the previously introduced modification makes the HASP a model with a non-associated flow rule. A detailed discussion of the advantages in adopting a non-associated flow rule for critical state soil models can be found in [24].
The HASP model uses the combined hardening rule, because the volumetric hardening rule does not allow negative dilatancy to develop for overconsolidated soils before the peak strength is reached. In order for the yield surface to continue expanding for stress ratio values M < η < M f , it is necessary to express the hardening rule as a function of the plastic shear strain also [34,35], as follows:
d p 0 = ν λ κ p 0 ( d ε v p + ξ d ε q p ) ,
where ν is the specific volume, λ is the slope of the virgin compression line in ν ln p plane, and κ is the slope of the swelling line in the ν ln p plane. A detailed discussion of the parameter ξ can be found in [27]. This new form of the combined hardening rule considerably influences the stress path. It enables the effective stress path to cross the CSL and reach the peak in drained conditions, while in the undrained test allows an “S” shaped effective stress path. The hardening rule is defined by:
d p 0 = ν λ κ p 0 d ε v p ω ,
where ω is the hardening coefficient:
ω = ( 1 + ξ d ) R ,
where d is the dilatancy d = d ε v p / d ε q p , and R is the current overconsolidation ratio:
R = p ¯ p = q ¯ q = p 0 ¯ p 0 .
Expressions for the plastic strains of the HASP model can now be written as:
d ε v p = λ κ ν 1 p 1 ω ( M 2 η 2 M 2 + η 2 d p + 2 η M 2 + η 2 d q ) ,
d ε q p = λ κ ν 1 p 1 ω ( 2 η M 2 + η 2 d p + 4 η 2 ( M 2 + η 2 ) ( M 2 η 2 ) d q ) .
Observing expressions (12) and (13), it is noticeable that the hardening coefficient is at the same time the reduction coefficient for the plastic strains. Consequently, the plastic strains of an overconsolidated clay in the initial loading stage, when the MCC model predicts only elastic strains, can be significantly reduced with the adequate formulation of the hardening coefficient. It is then possible to assume that the soil deforms plastically from the very beginning of loading.
In the HASP soil model, dilatancy is not a function of the stress ratio η only, it also depends on the state parameter Ψ [27]. The state parameter is defined as the difference between the current specific volume and the specific volume on the reference state line (CSL) at the same mean effective stress (Figure 1b). The state parameter for the current stress state, i.e., point on the yield surface, can be expressed as:
Ψ = ν + λ ln p Γ ,
where Γ is the reference specific volume for p = 1   kPa on the critical state line in the ν ln p plane. The detailed procedure on how to obtain the parameter Γ for the HASP model can be found in [36]. The state parameter is negative for highly overconsolidated clays, Ψ 0 , while for lightly overconsolidated and normally consolidated clays the state parameter is positive, Ψ > 0 . When the stress point reaches the CSL, then Ψ = 0 . Also, the state parameter for the conjugate point on the bounding surface can be expressed as:
Ψ ¯ = ( λ κ ) ln ( 2 M 2 M 2 + η 2 ) .
The current overconsolidation ratio via the state parameters thus becomes:
R = p ¯ p = q ¯ q = e x p ( Ψ ¯ Ψ λ κ ) .
A detailed explanation for the ratio ξ / d in Equation (10) is given in [27], and the following expression for the hardening coefficient is proposed:
ω = ( 1 + Ψ ¯ Ψ Ψ ¯ ) R .
According to expressions (12) and (13), the main difference between the MCC model and the HASP model is in the hardening coefficient. For normally consolidated clays, it holds that Ψ = Ψ ¯ , and the hardening coefficient is then ω = 1 . Then, the HASP model predicts the same behavior as the MCC model for normally consolidated clays.
The HASP soil model includes the consolidation parameters λ and κ , the drained strength parameters M C and M E , the Poisson’s ratio as elastic parameter μ , and the void ratio e 0 , which defines the initial state. The drained strength parameters M C and M E represent the gradients of the critical state line in the q p plane for the triaxial compression test and triaxial extension test, respectively. Those two parameters are related to the friction angles in compression ( ф C ) and extension ( ф E ):
M C = 6 s i n ф C 3 s i n ф C ,
M E = 6 s i n ф E 3 + s i n ф E .
The elastic behavior is modelled using two parameters, κ and μ . A constant value of Poisson’s ratio, μ , is used. The bulk modulus K and shear modulus G are defined by:
K = ν p κ ,           G = 3 ( 1 2 μ ) K 2 ( 1 + μ ) .
The HASP soil model was implemented in the PLAXIS 2D software package via a user subroutine using the Governing Parameter Method (GPM) as the stress integration procedure [37,38].

4. Comparison of HASP and MCC Models

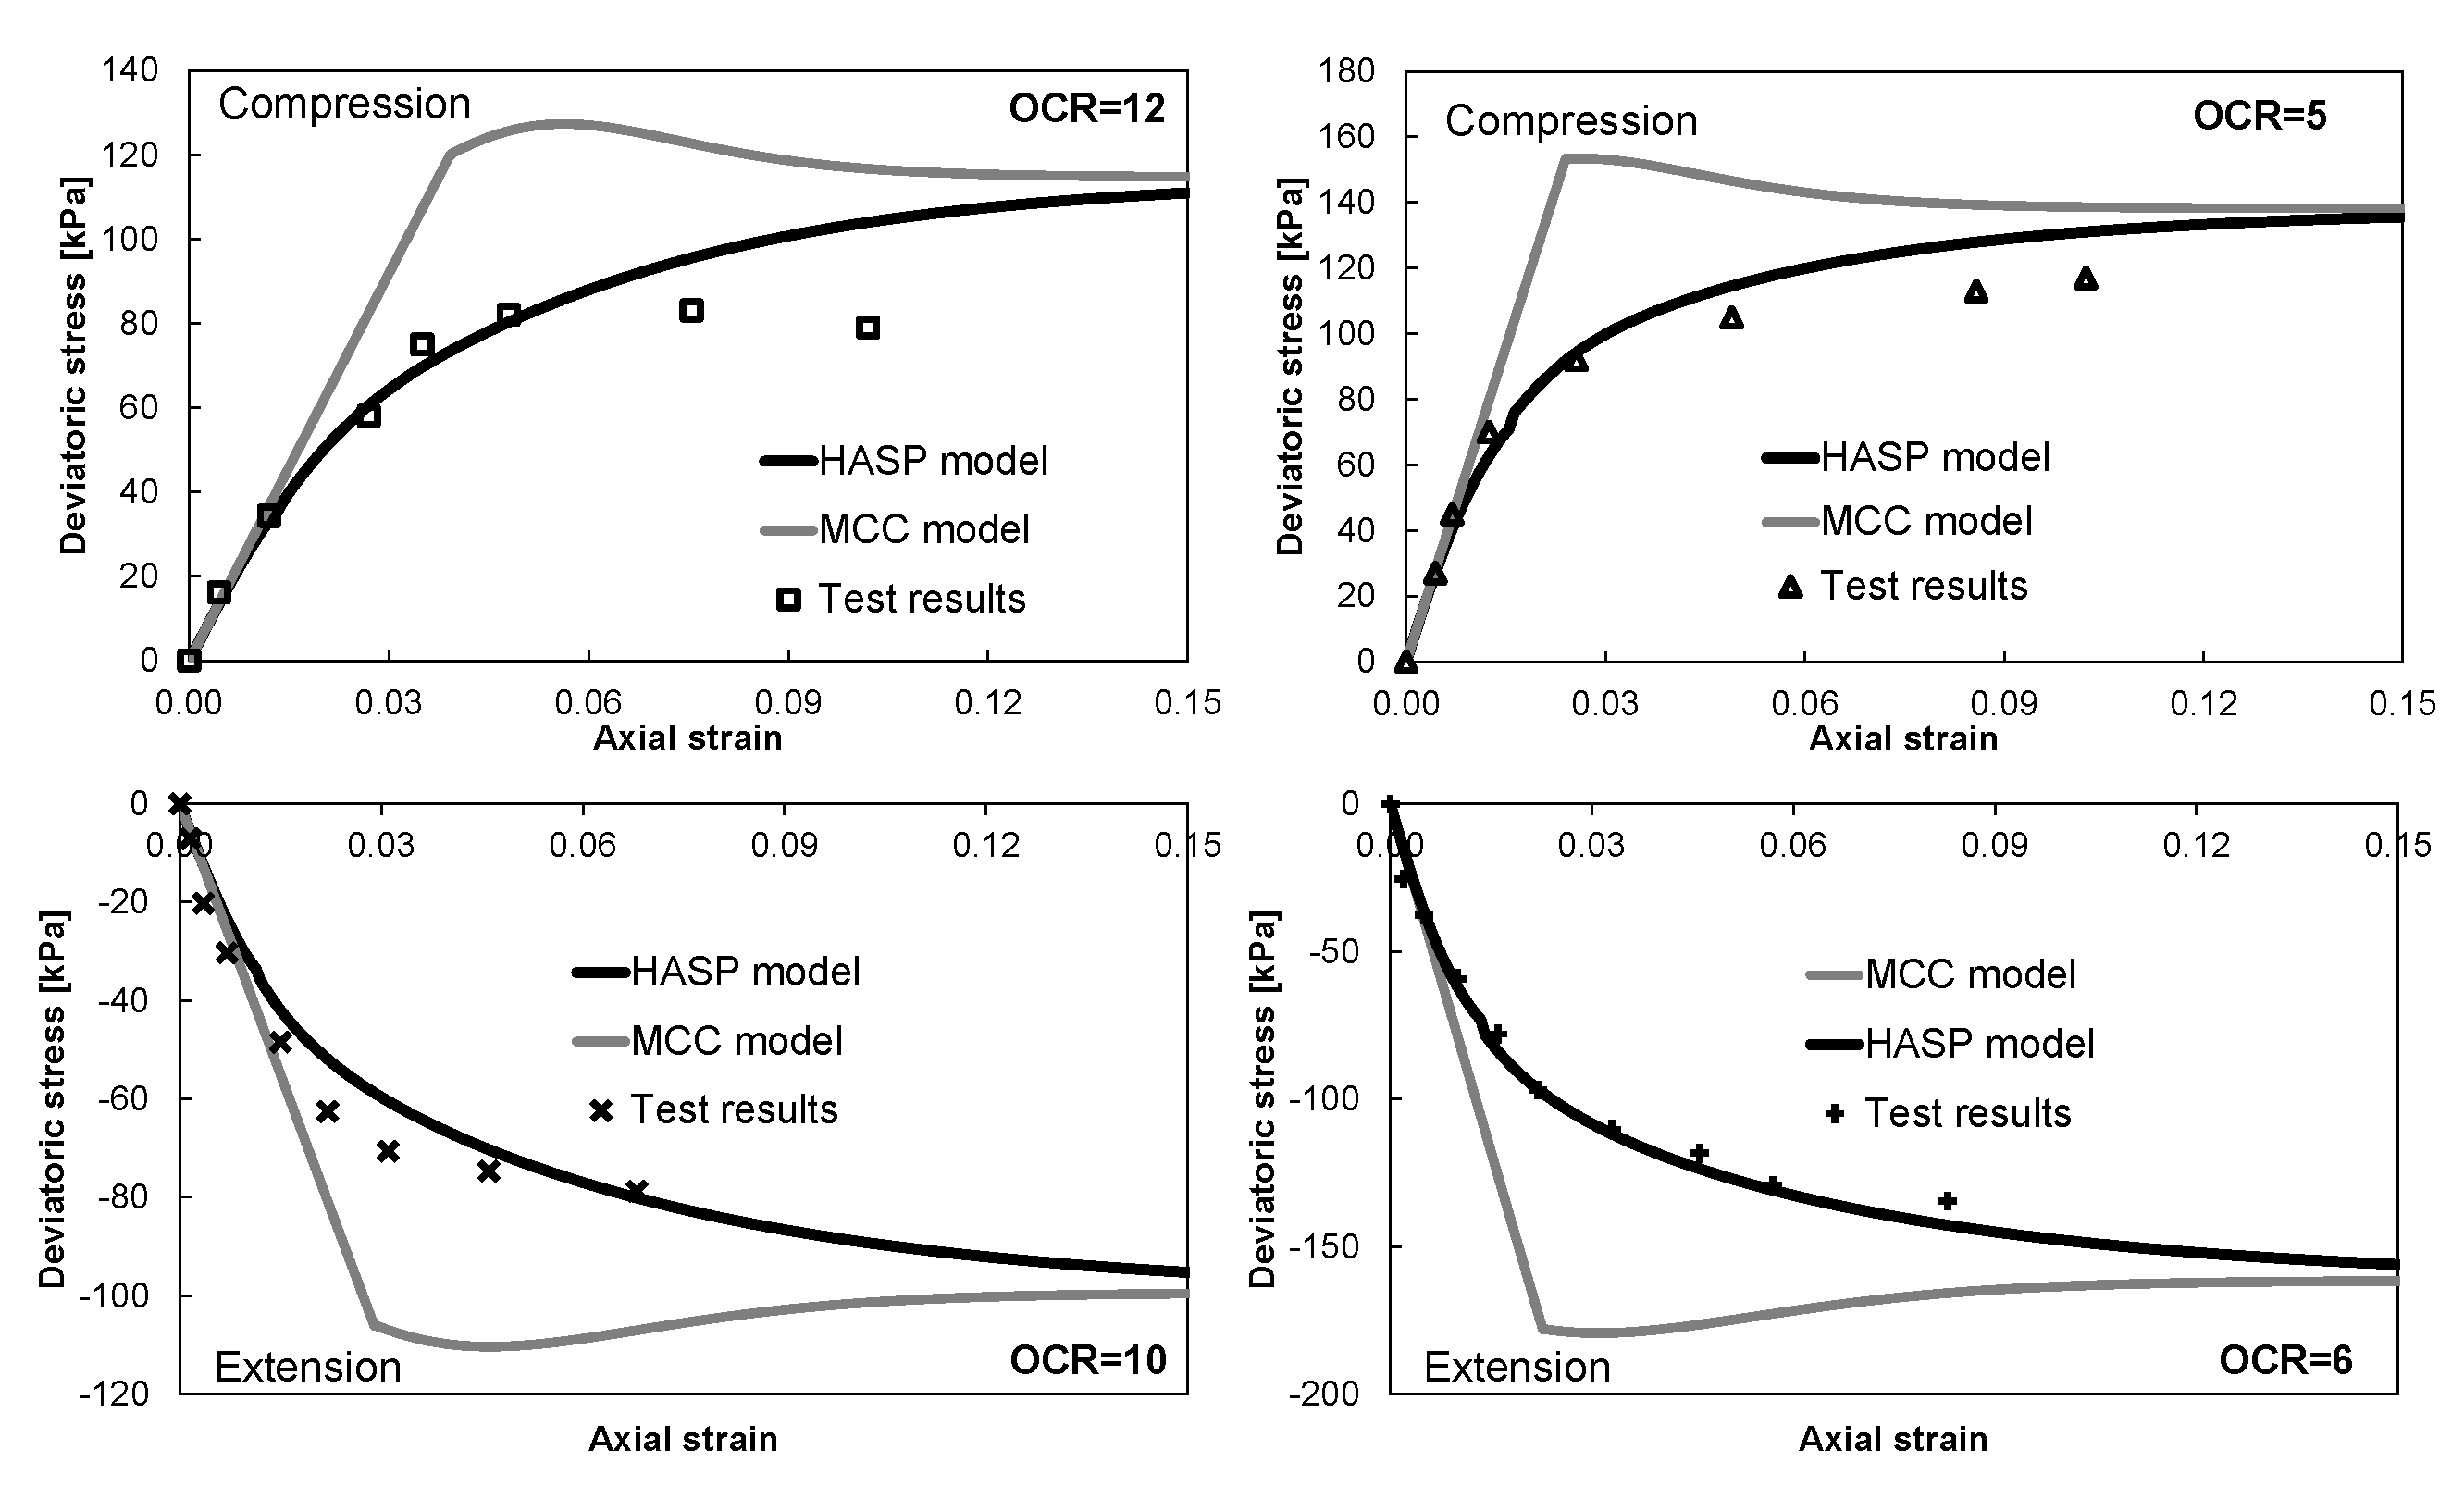
The MCC model is a very well-known isotropic elastoplastic soil model based on the critical state concept [39]. The behavior of soil is elastic for a stress state inside the yield surface (bounding surface for HASP model), and elastoplastic for stress paths that reach the yield surface. The MCC model has an associated flow rule. The shapes of the yield surface and plastic potential surface are both circles in the deviatoric plane. The HASP model includes the same model parameters as the MCC model ( λ ,   κ ,   M ,   μ and e 0 ). These material model parameters have clear physical meanings and can be easily obtained from basic laboratory tests. The drained strength parameter M is a constant, as opposed to being a variable in HASP model, as described in the previous section. The hardening law of the MCC model depends only on the plastic volumetric strains (volumetric hardening rule). On the other hand, the HASP model uses the combined hardening rule (Equation (8)). The difference in predicting an overconsolidated clay’s behavior in a consolidated undrained triaxial test for a Cardiff clay between the MCC and HASP soil models is given in Figure 2 [27]. A detailed presentation of the test results can be found in [27].

5. Finite Element Modelling of the Two Embankments

5.1. Saga Highway Embankment

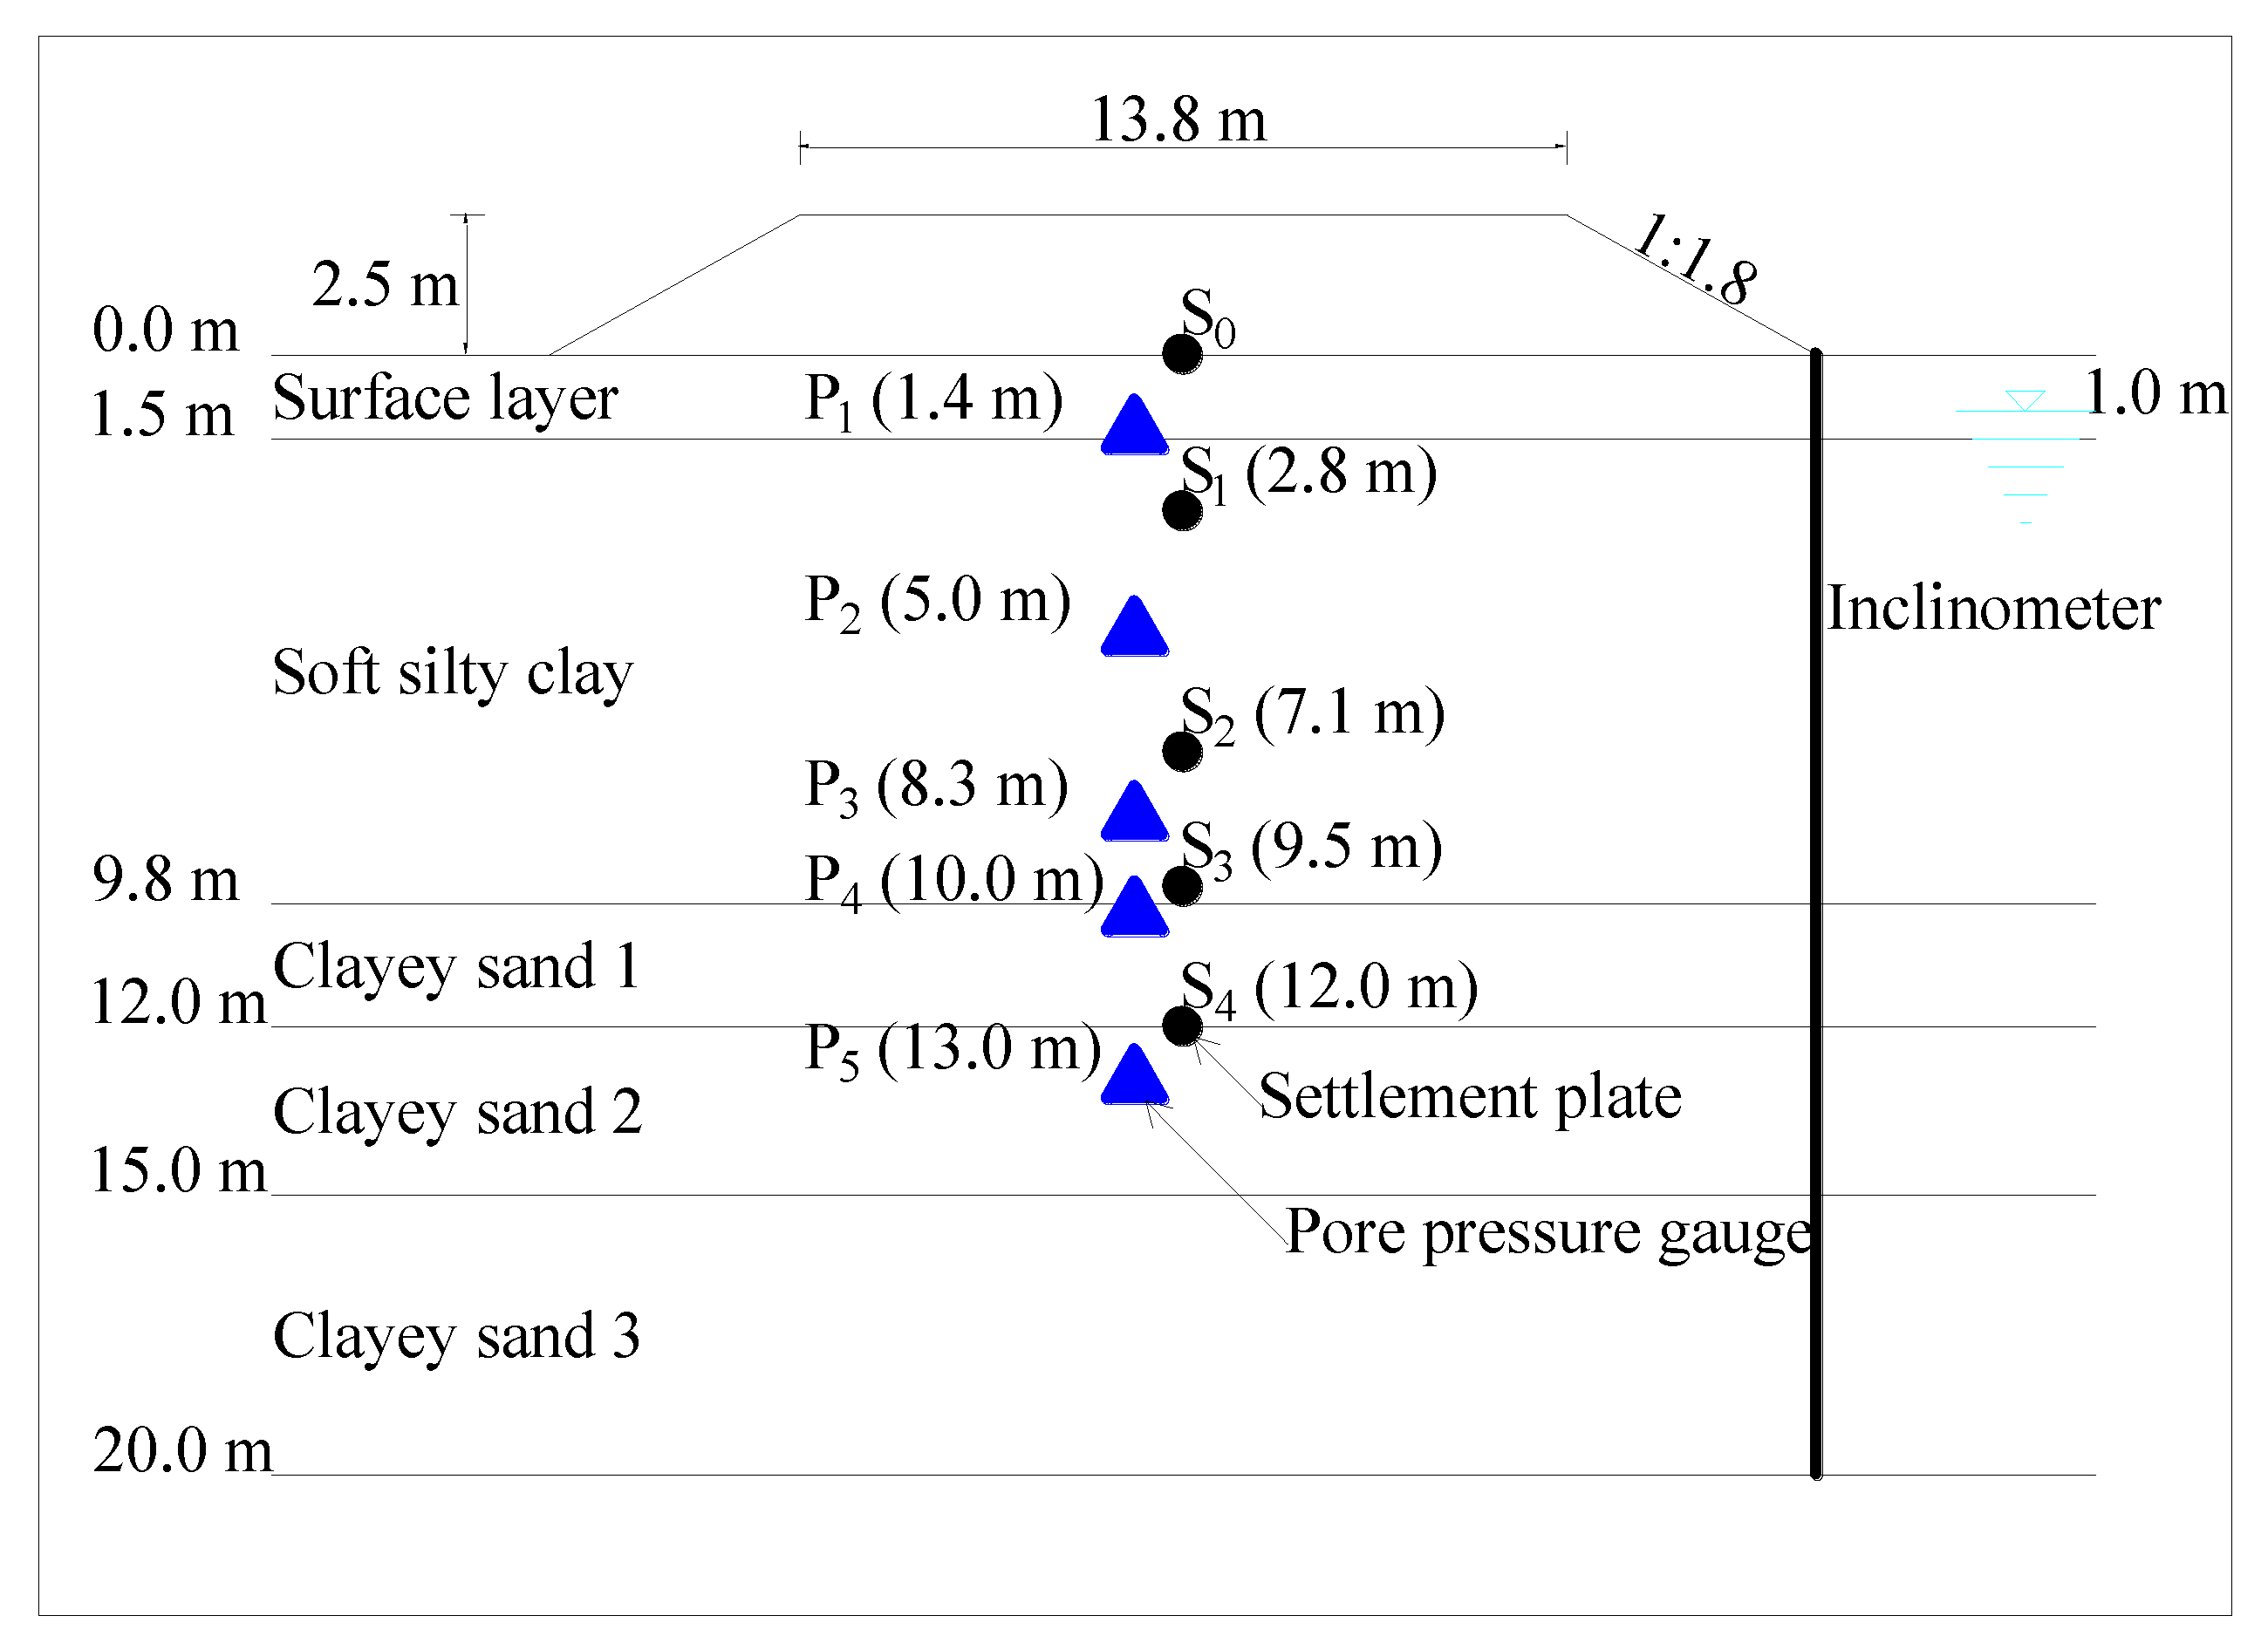
The highway embankment is located at the deposits of soft Ariake clay near Saga City, in Japan [6]. The embankment and foundation soil were instrumented in order to verify the design soil parameters. Ground settlements and the change of excess pore water pressure were monitored during the embankment’s construction and for three years after the end of the construction. Extensive soil, field, and laboratory investigations were performed at the location. Material model parameters, labeled as Class-C2 set in [6], were used in this study. The soil profile consists of a 1.5 m thick surface layer of highly overconsolidated clay. The surface layer is underlined by an 8 m thick layer of soft silty clay. Clayey sand is located below the soft silty clay. The groundwater level is 1.0 m below the surface. The embankment was constructed over 50 days, to a total height of 2.5 m. The base dimensions (length × width) of the embankment were 46.8 m × 21.8 m, and its side slopes were 1:1.8 (vertical:horizontal). The top dimensions of the embankment were 37.8 m × 13.8 m. A decomposed granite was used as the fill material. A cross section of the embankment and the positions of sensors for measuring settlements, excess pore pressures, and lateral displacements are shown in Figure 3. In the following sections, this embankment is referred to as Embankment A.

5.2. Teven Road Trial Embankment

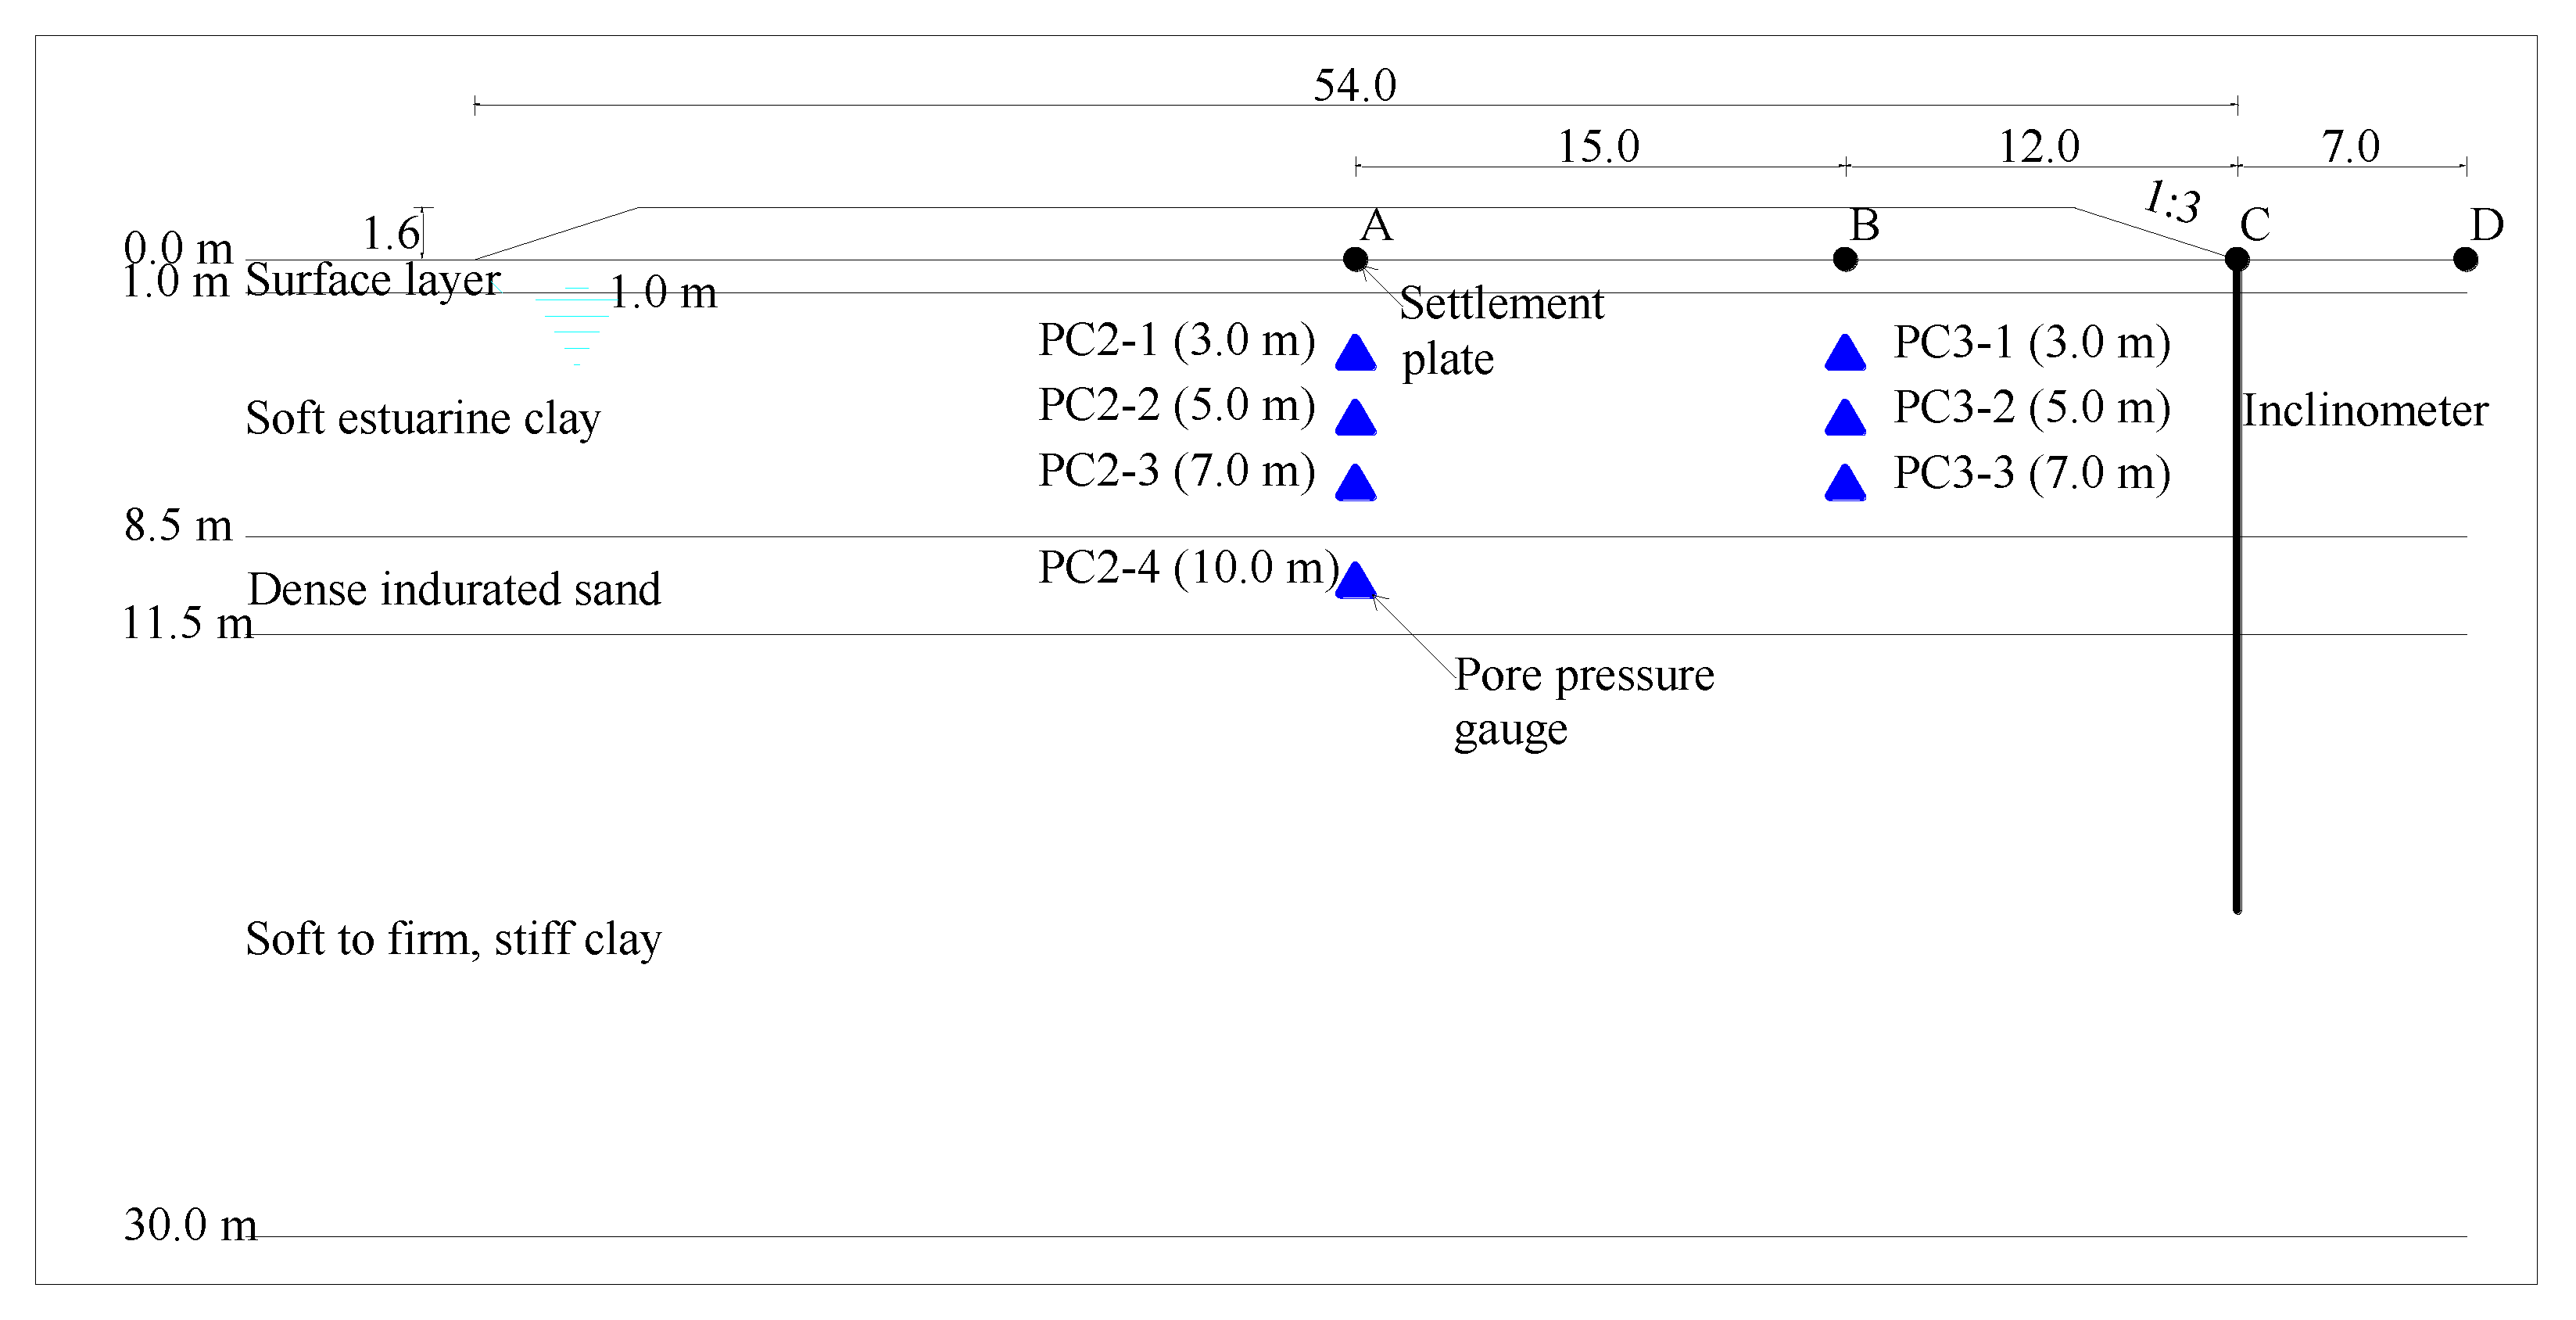
Two test embankments were built near the coastal town of Ballina in the state of New South Wales, Australia, as a part of a program to upgrade the Pacific Highway [8]. The test embankments were instrumented with measuring equipment in order to determine the soil’s behavior due to embankment construction. Detailed field and laboratory investigations were performed in order to obtain the soil parameters. One test embankment was built on natural soil, while another was built on improved soil. Ground settlements and the change of excess pore water pressures were monitored during the embankment’s construction, and for three years after the end of construction. The highway section is located in the floodplain near the mouth of Richmond River. The surface layer is about 1.0 m thick, a highly overconsolidated clay. Beneath it is an estuarine clay deposit, to a depth of about 30 m, which is divided into two layers by a dense fine to medium grained sand. The sand layer is lying almost horizontally, has a relatively high permeability, and can be considered to be a horizontal drainage layer within the clay deposit. The clay layer above the sand layer is soft, while the clay layer below it is firm to stiff (increasing with depth). The base dimensions of the embankment were 84 m × 54 m, and its side slopes were 1:3. The embankment was constructed to a total height of 1.6 m over 69 days. The groundwater level is 1.0 m below the surface. A cross section of the embankment and positions of sensors for measuring settlements and the excess pore water pressures are shown in Figure 4. In the following sections, this embankment is referred to as Embankment B.

5.3. Numerical Models

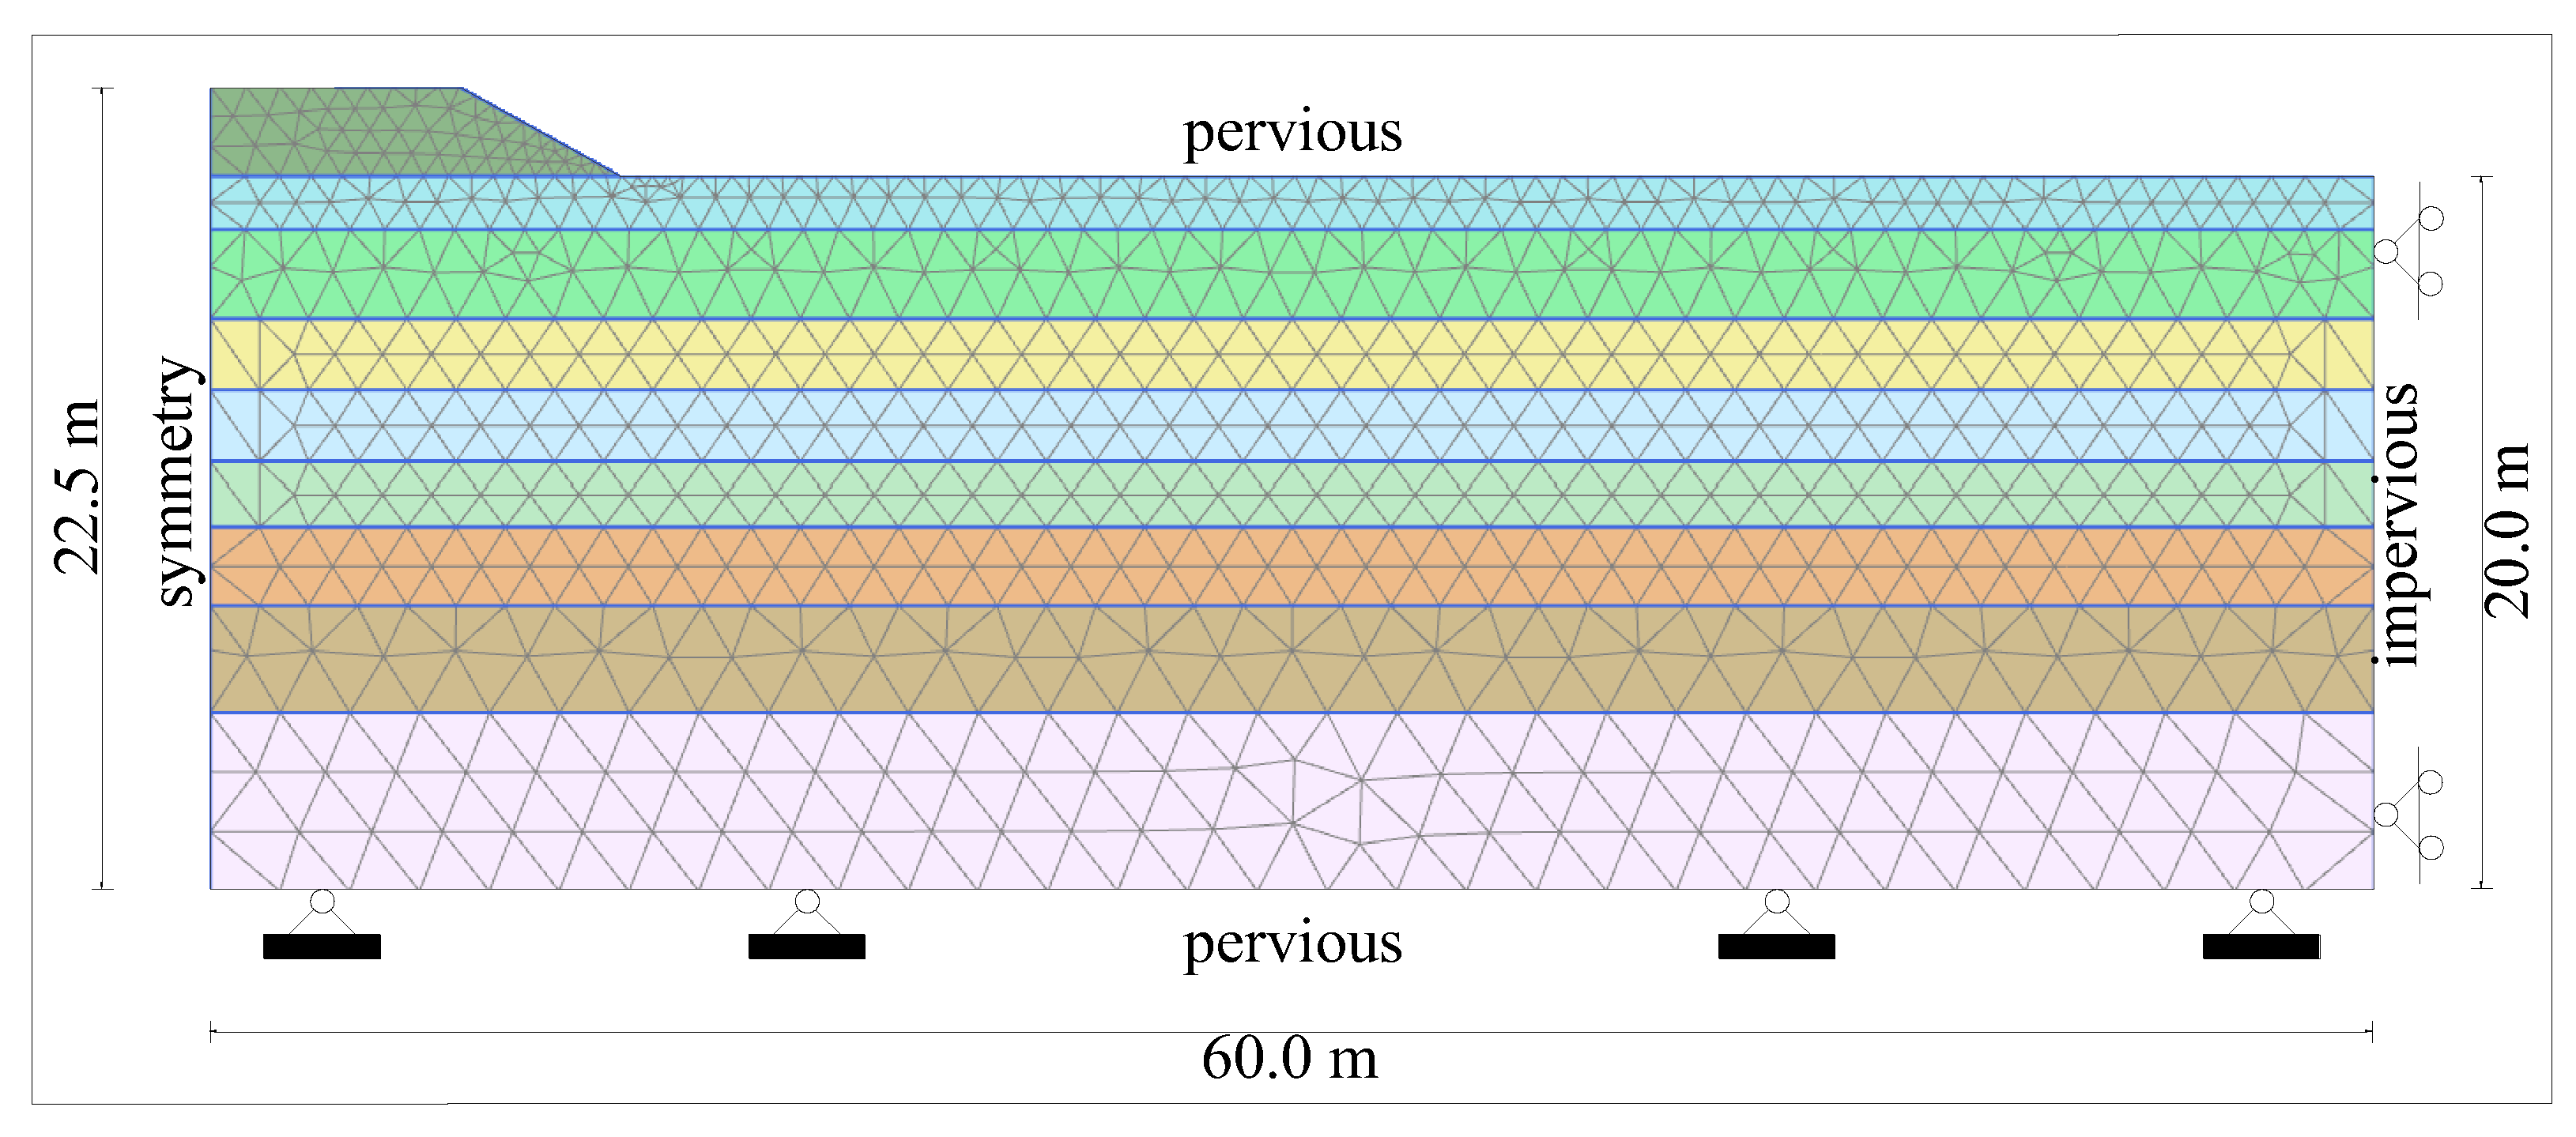
A plane strain finite element analysis was used for all the numerical predictions. The adopted finite element mesh and the boundary conditions are shown in Figure 5 and Figure 6 for Embankments A and B, respectively. All numerical calculations were performed using PLAXIS 2D. A finite element fully coupled flow-deformation analysis (i.e., consolidation based on total pore water pressures) was used to perform numerical predictions. Fifteen-node triangular elements were used. The used elements provide a 4th order interpolation for displacements, and the numerical integration includes twelve Gauss points (stress points) [40].
For both embankments, the horizontal displacements were fixed at the left and the right boundaries, while vertical displacements were allowed. Also, the horizontal and vertical displacements were fixed at the bottom boundary for both embankments.
Because both embankments are symmetrical, only one half of the embankment is modelled. The modelled area for Embankment A had a total horizontal width of 60 m and a vertical thickness of 22.5 m. The drainage boundaries for Embankment A were the ground surface and the bottom boundary (sand layer), while both left and right boundaries were modelled as impermeable. The modelled area for Embankment B had a total horizontal width of 94 m and a vertical thickness of 31.6 m. The impermeable boundaries for Embankment B were the bottom boundary (stiff clay) as well as the left boundary. The drainage boundaries for Embankment B were the ground surface and the right boundary. The right boundary was chosen as a completely permeable boundary for Embankment B in order to permit possible horizontal ground water flow across the boundary through the sand layer (drainage layer). The previously described boundary conditions for both embankments are the same ones as reported in [6,8].
The domain chosen for numerical modelling must be wide enough in order to minimize the influence of the boundary effects on the obtained results, and more than three times the embankment width was selected. The modelled area for Embankment A was discretized into 1620 elements and for Embankment B into 2319 elements. Mesh sensitivity analyses were conducted to ensure that the adopted mesh was fine enough to produce accurate results.
The first stage in the numerical calculations was to model the construction of both embankments. Embankment A was built up to a height of 2.5 m in 50 days, and Embankment B was built up to a height of 1.6 m in 69 days. Although the actual construction sequence of Embankment B consisted of multiple stages with rest periods in between [8], the results of an additional numerical analysis of Embankment B, with multiple construction stages, showed only small differences in the results compared to a linear evolution of the embankment height with time. It was decided to model the construction of both embankments in the same way. Computation is then continued up to four years after the end of embankment construction (up to the end of the measurements) in order to estimate the consolidation behavior. The results are given in terms of time (days) from the reference time (day zero)—the beginning of the embankment construction.
The water table is assumed to be 1.0 m below the ground surface, and above this level the clay remains saturated and can sustain tensile pore water pressures—suction. This gives a finite value of the effective vertical stress and therefore the undrained strength at the ground surface [41]. The conducted fully coupled flow-deformation analysis takes into account suction in the saturated zone above ground water level table.

5.4. Material Model Parameters

In the numerical analyses, all the clay layers were represented by either the MCC model or the HASP model. The embankments and all sand layers were represented with a simple linear elastic-perfectly plastic Mohr–Coulomb model (MC). It is important to note that no parameter calibration was done for the HASP model, and all model parameters are the same ones as used in [6,8]. Table 1 and Table 2 contain the numerical model parameters, which are independent of the selected constitutive model for all soil layers. The model parameters for the MCC and HASP soil models are given in Table 3 and Table 4 for Embankments A and B, respectively. The model parameters for the MCC and HASP soil models are the same. The only difference is that the HASP model uses the parameters ф C and ф E instead of parameter M . For embankment A, the friction angle in compression is determined from the value of M C = 1.6 , as reported in [6]. Since no value was given for the friction angle in extension, it was taken to have the same value as the friction angle in compression for Embankment A. For Embankment B, in [8] it was reported that the ratio of parameter M E in extension and parameter M C in compression was 0.8, and the value of M E is calculated. Using Equations (18) and (19), the values of the friction angles in compression and extension given in Table 4 for Embankment B are calculated. Therefore, the friction angles during compression and extension are different for Embankment B.
The overconsolidation ratio (OCR) of the clay layers is reproduced using POP—pre-overburden pressure. The value of POP for all clay layers is determined using Equation (21) so the values of OCR reported in [6,8] are matched:
OCR = σ v + POP σ v ,
where σ v is the current value of the vertical effective stress. The used values of POP are given in Table 1 for Embankment A and in Table 2 for Embankment B. The variation of OCR with depth for both embankments is given in Figure 7.
The values of the horizontal ( k h ) and vertical ( k v ) hydraulic conductivities were the same ones as used in [6,8]. The natural clayey soils exhibit permeability anisotropy—higher permeability in the horizontal direction than in the vertical direction. For Embankment A, the permeability anisotropy ratio r k = k h / k v was set to 1.5 for all clay layers [42]. For Embankment B, the permeability anisotropy ratio was set equal to 2.0 for all soil layers [8]. The values of k h and k v listed in Table 1 and Table 2 are the initial values for both embankments. The values of hydraulic conductivity were allowed to change during consolidation with void ratio, according to the Equation (22):
k = k 0 · 10 ( e 0 e ) / C k ,
where k 0 is the initial hydraulic conductivity, e 0 is the initial void ratio, k is the current hydraulic conductivity, e is the current void ratio, and C k is a constant. For C k a value of 0.4 e 0 was adopted for all calculations, as suggested in [43]. Because of the much greater stiffness of sand layers than clay layers, the void ratio of the sand layers does not change significantly during the calculation. As a consequence, the hydraulic conductivity of the sand layers is unchanged throughout all the calculation phases for both embankments.
The coefficient of earth pressure at-rest for normally consolidated soil K 0 N C for all soil layers has the same value as reported in [6,8] for both embankments. For all layers except the clay layers in Embankment A, K 0 N C was determined by Jaky’s estimation [44]:
K 0 N C = 1 s i n ϕ ,
where ϕ is friction angle (given in Table 3 and Table 4). For the clay layers in Embankment A, K 0 N C has the same value as given in [6]. For the overconsolidated clay layers, the initial horizontal effective stresses were calculated using the following equation [45]:
K 0 O C = K 0 N C · OCR .
The values of K 0 N C given in Table 1 and Table 2 are average values in a soil layer.

6. Results and Discussion

6.1. Embankment A

6.1.1. Settlement Predictions

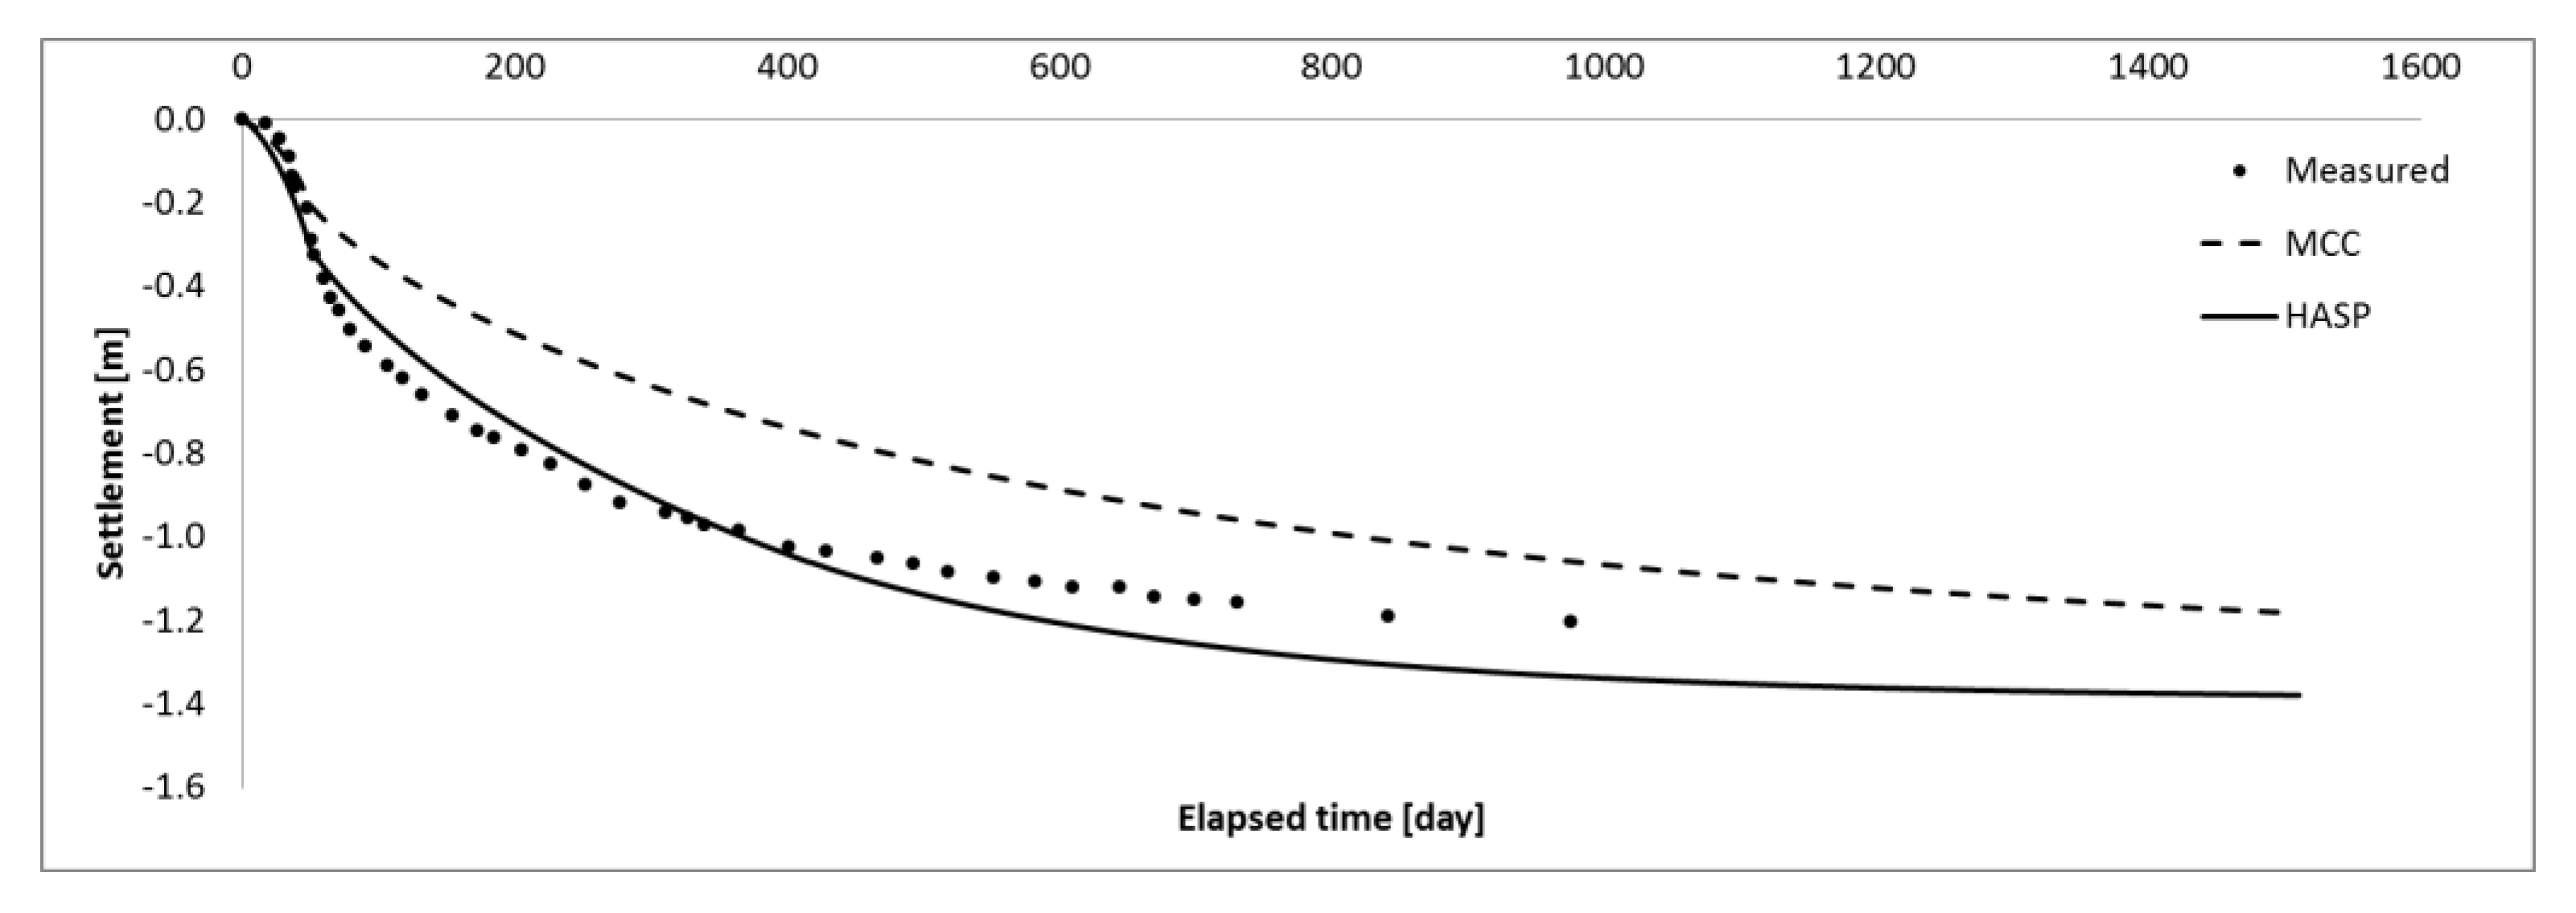
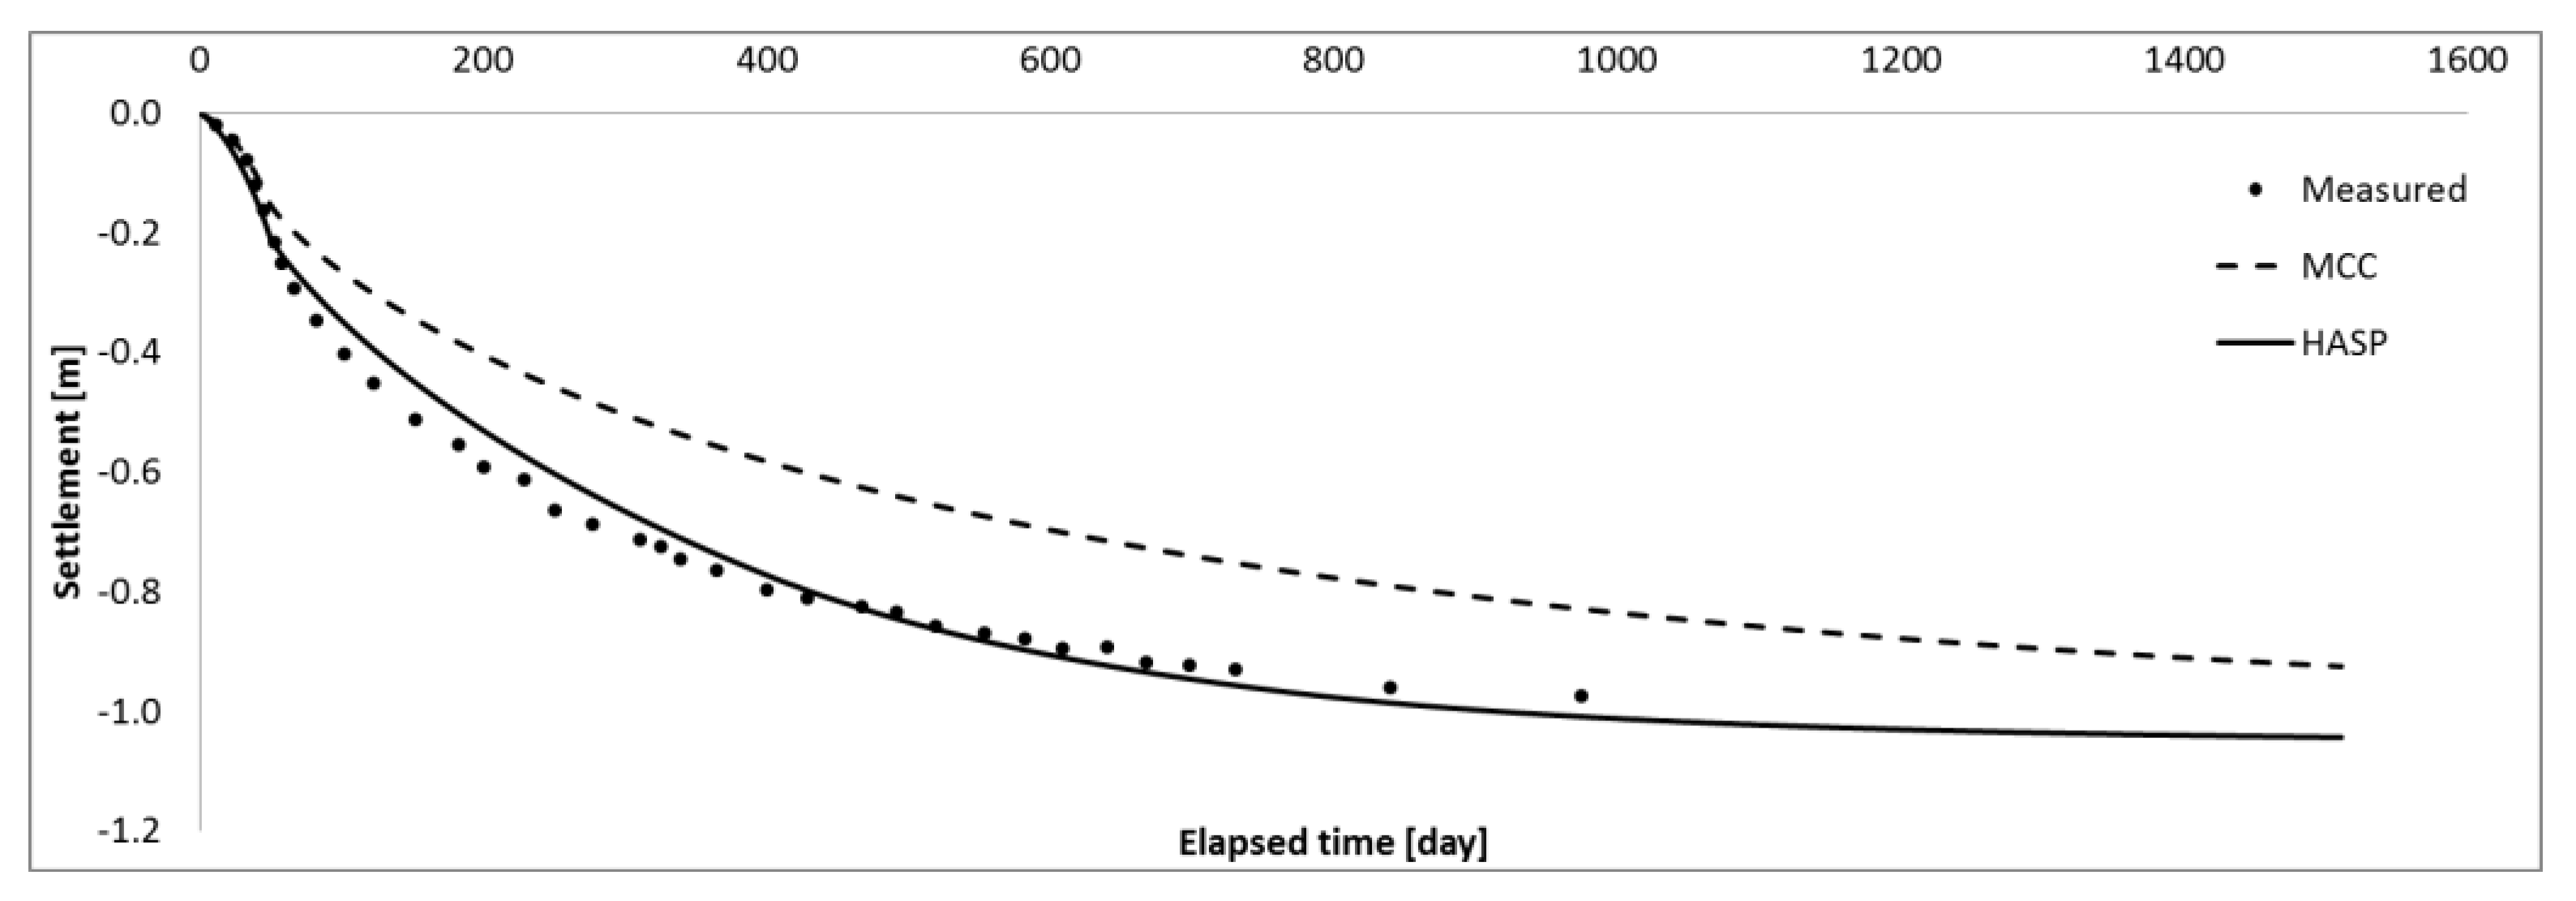
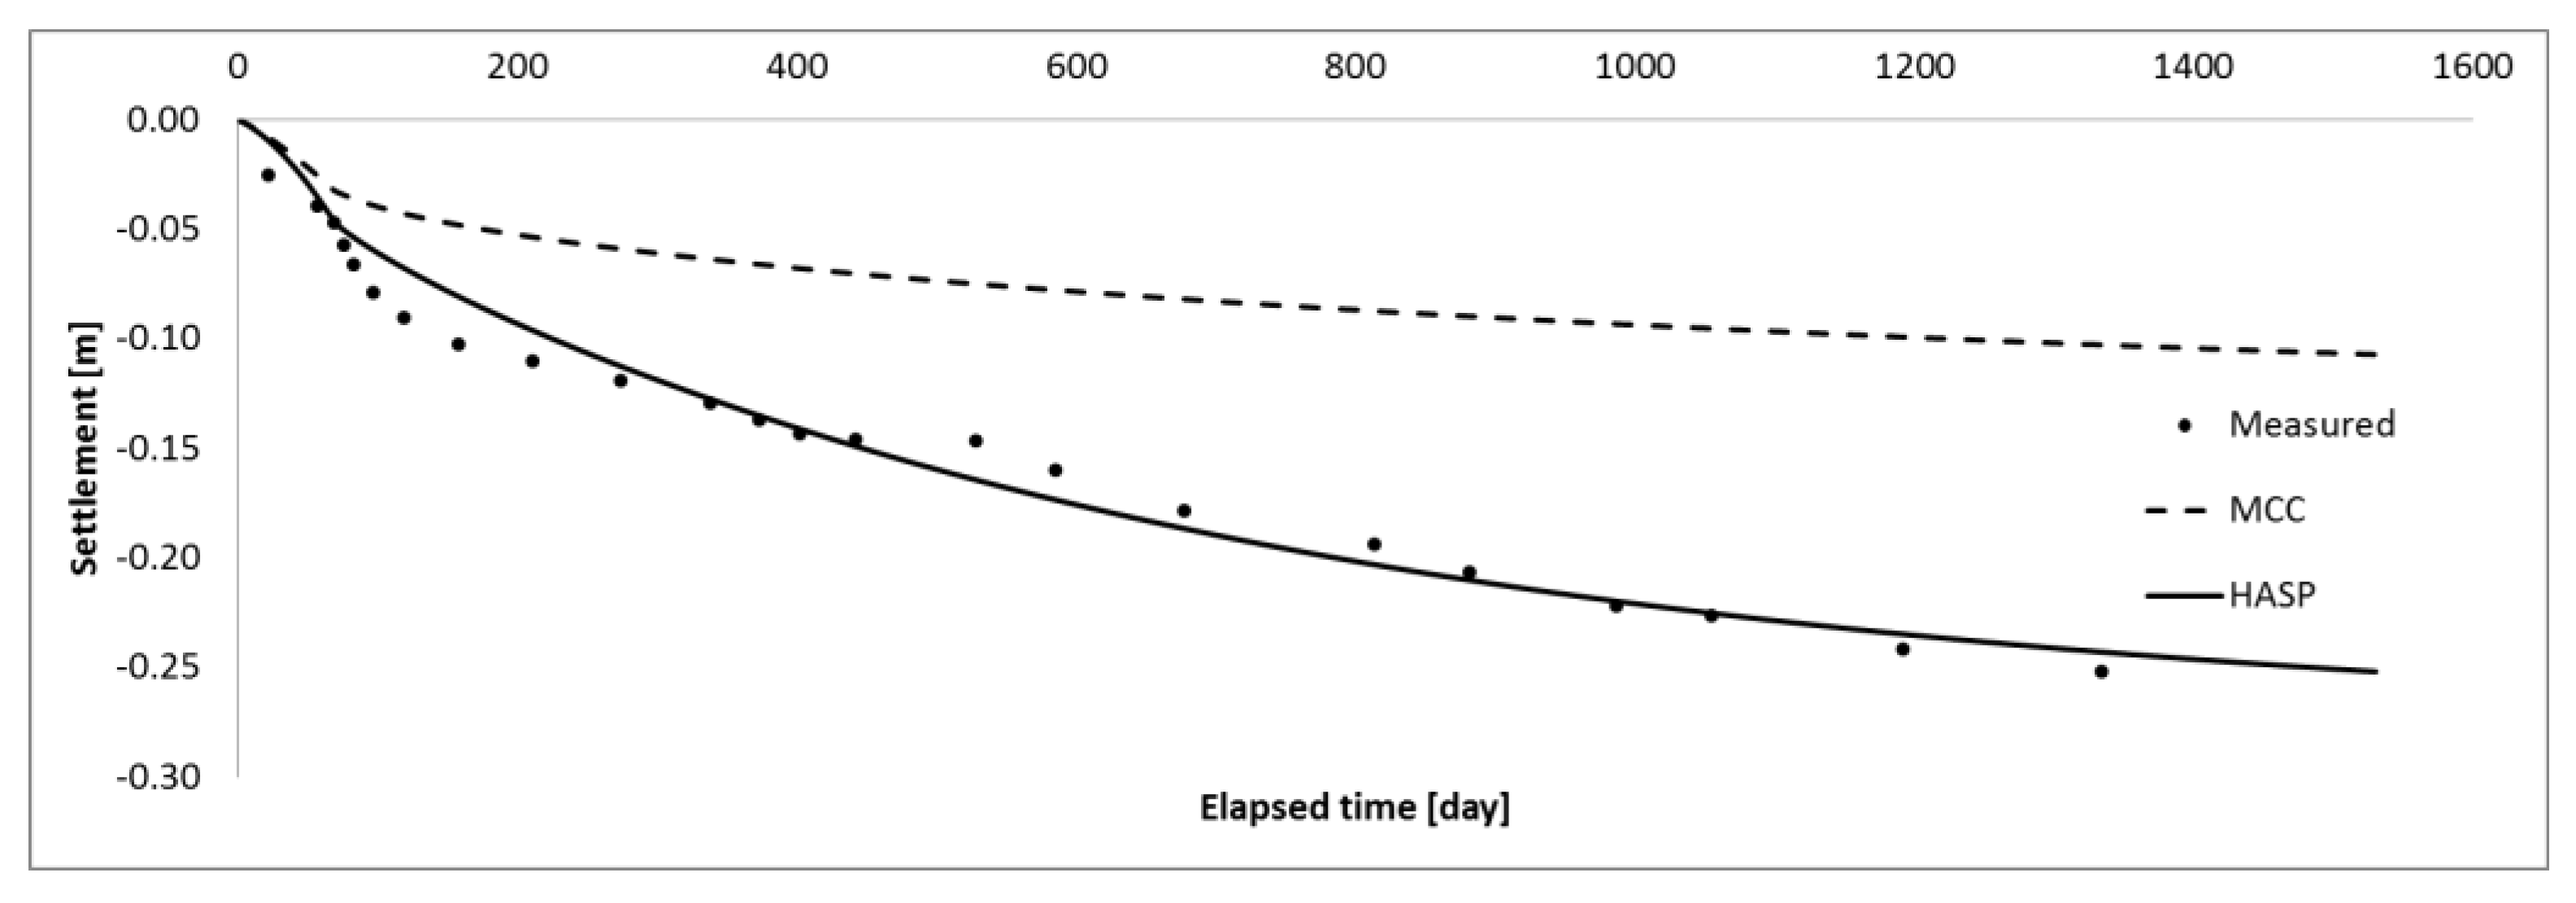
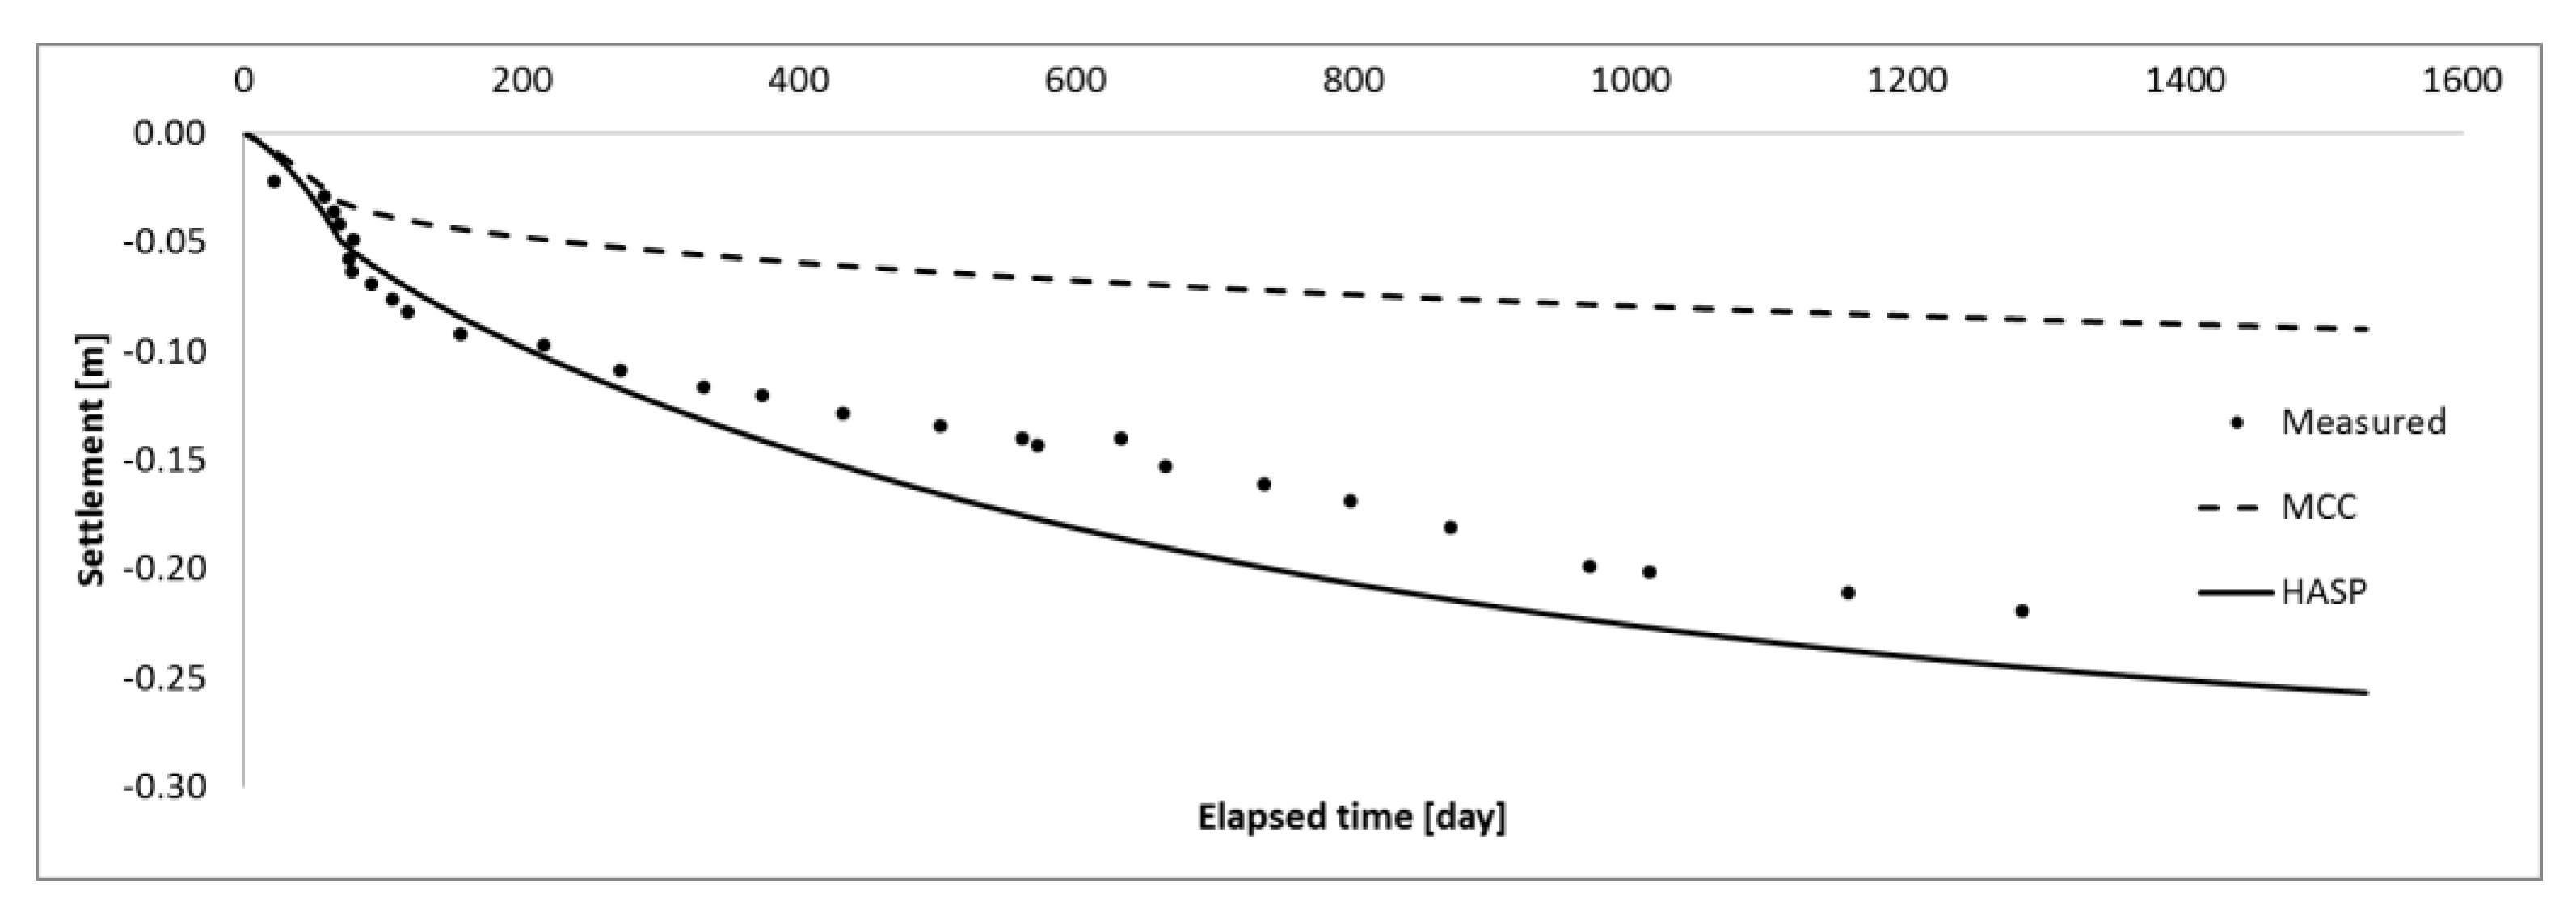
Recorded settlement-time curves are given in Figure 8 and Figure 9 for settlement plates S 0 and S 1 , respectively. As reported in [6], some problems arose for other settlement plates, so those measurements will not be analyzed. From the settlement-time curves it can be seen that the primary consolidation is finished at about three years after the beginning of the construction.
Both soil models predict the end of primary consolidation and flattening of settlement-time curves four years after the beginning of construction. The reasons for the deviation from the registered consolidation time are likely inadequate magnitudes of hydraulic conductivities. In the embankment construction phase, when pore pressures increase and effective pressures decrease, both models predict similar settlement magnitudes that are close to those measured. In the phase of consolidation and dissipation of pore pressures, the MCC model significantly underpredicts the settlements, on average about 20% compared to the measured. The HASP model predicts settlements well, with an average deviation of about 7% for point S 0 and about 4% for point S 1 .
The prediction of the HASP model generally gives higher values of deformations compared to the MCC model. Such results are expected, since the HASP model predicts elastoplastic behavior from the very beginning of the deformation process, while the MCC model predicts only elastic behavior within the initial yield surface (bounding surface for HASP model).
The initial yield surface for the MCC model and the effective stress paths for the HASP and the MCC models are shown in Figure 10. The effective stress path for the MCC model remains in the elastic zone for a certain period, predicting deformations smaller than those measured. On the other hand, within the HASP model a purely elastic region does not exist, because the hardening coefficient ω controls the magnitude of the plastic strains, which allows elastoplastic behavior from the very beginning of the deformation process.

6.1.2. Excess Pore Pressure Predictions

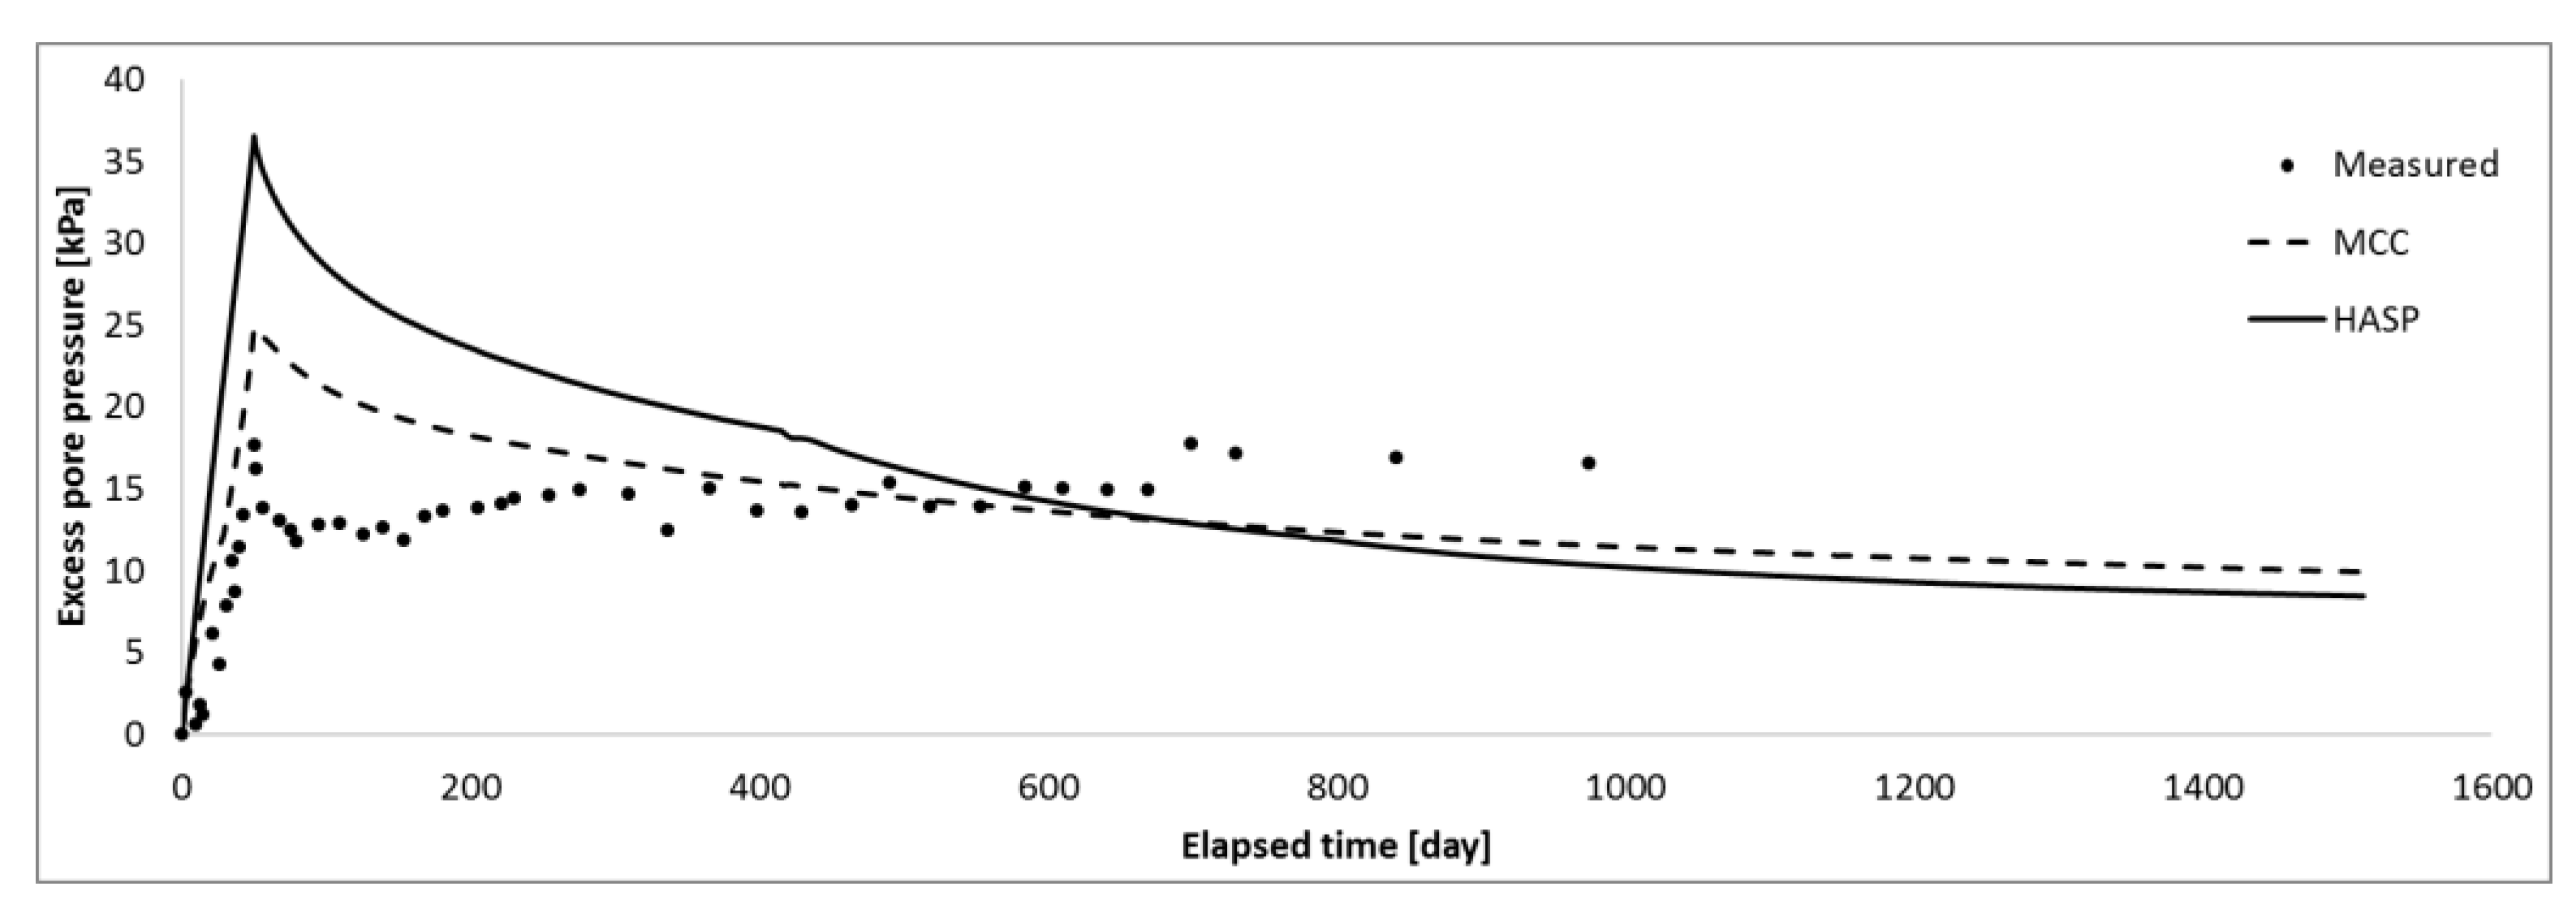
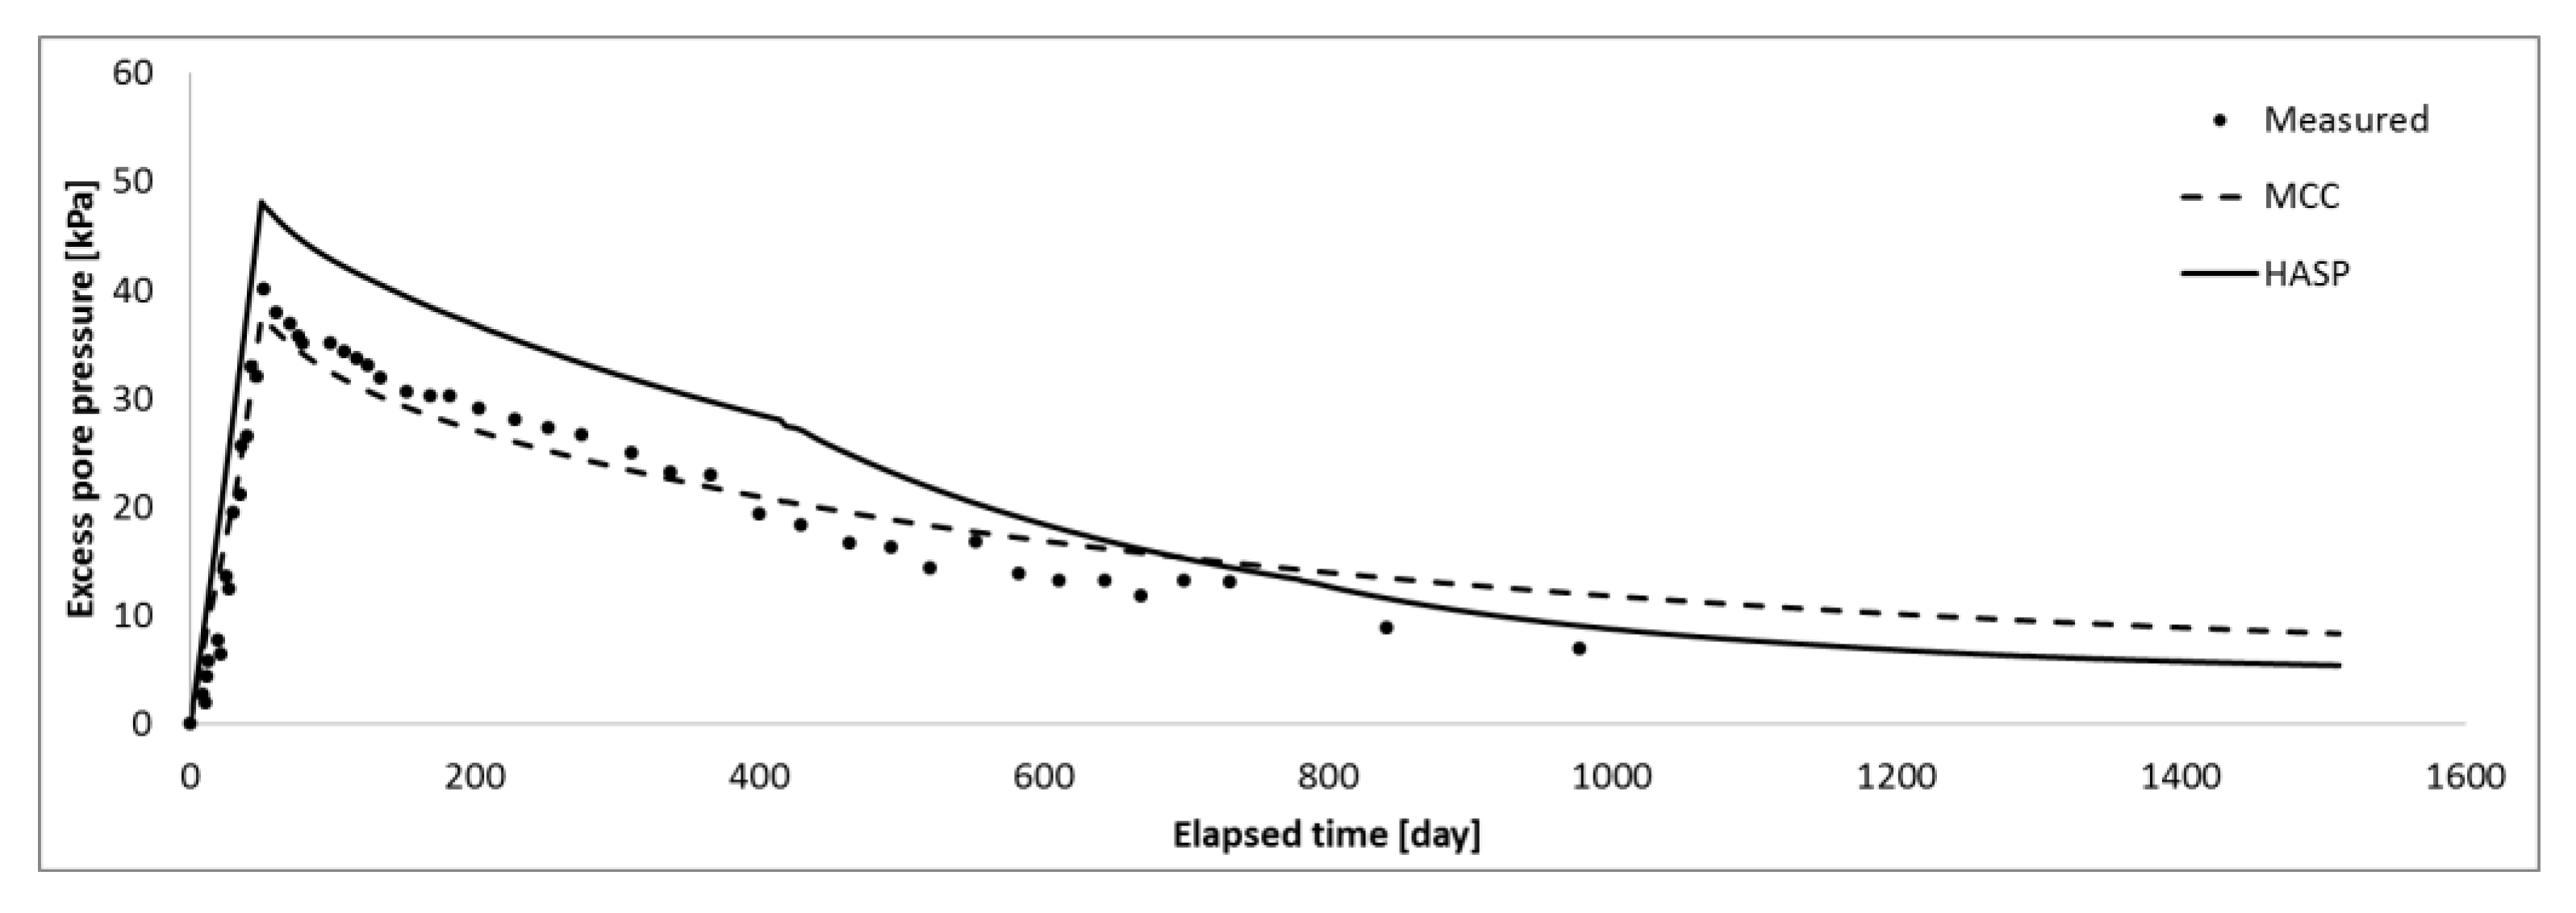
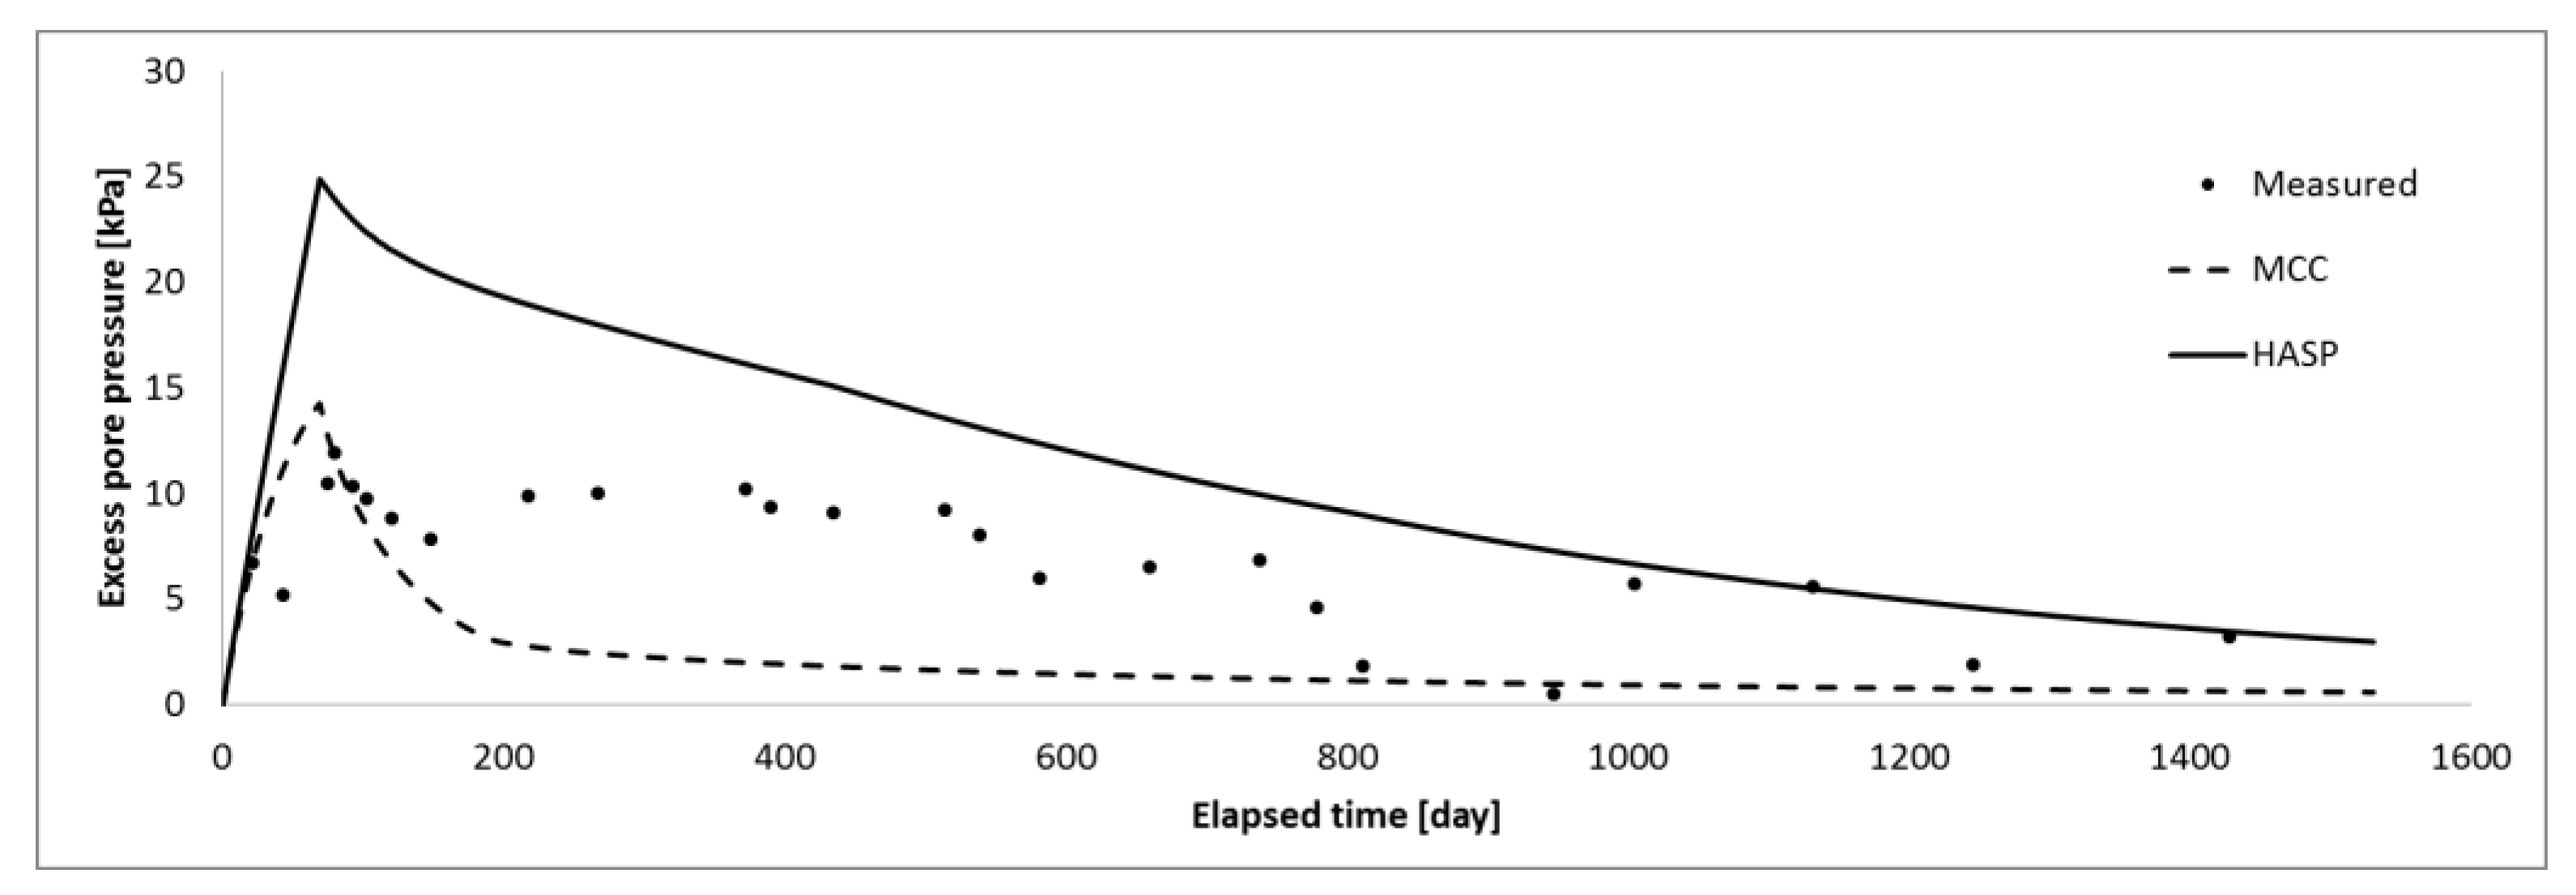
Comparisons of the measured and predicted excess pore water pressures at the pore pressure gauges P 1 , P 2 , and P 3 are shown in Figure 11, Figure 12 and Figure 13, respectively. Very small values of excess pore water pressures were measured at the other gauges so the comparisons are not presented. Both the measured and predicted peak values of excess pore pressures occur at the end of embankment construction. Afterwards, they reduce to their initial values.
Generally, both models provide good predictions of excess pore pressures and their dissipation over time, with a greater deviation for the points below the surface. As a result of the rapid increase of load on the saturated low permeability clay layer, the HASP and the MCC models predict the increase of pore water pressure during the construction of the embankment, followed by full dissipation of the excess pore water pressure in the process of consolidation. After reaching peak values, both models predict a sharp decrease of excess pore pressures. Approaching the end of the calculation process, the difference in predicted values between the two models is steadily reduced.

6.2. Embankment B

6.2.1. Settlement Predictions

Settlement-time curves are given in Figure 14 and Figure 15 for settlement plates at the surface—point A at the center of the embankment and point B 15 m from the center of the embankment, respectively.
The discussion and considerations that apply to Embankment A are applicable to Embankment B. The MCC model highly underpredicts the settlements (60% compared to the measured), while the HASP soil model gives a good prediction for point A and slightly overpredicts for point B. For Embankment B, differences in the strain magnitude are more pronounced for the two models than for Embankment A. An explanation can be found in Figure 16, which illustrates the effective stress paths. The stress path for the MCC model remains in the elastic zone during the entire loading process, which represents one of the main drawbacks of the MCC model for use in analysis with overconsolidated clays. On the other hand, the HASP model predicts the development of plastic deformations from the very beginning of the loading, and its predictions are consistent with the field data.

6.2.2. Excess Pore Pressure Predictions

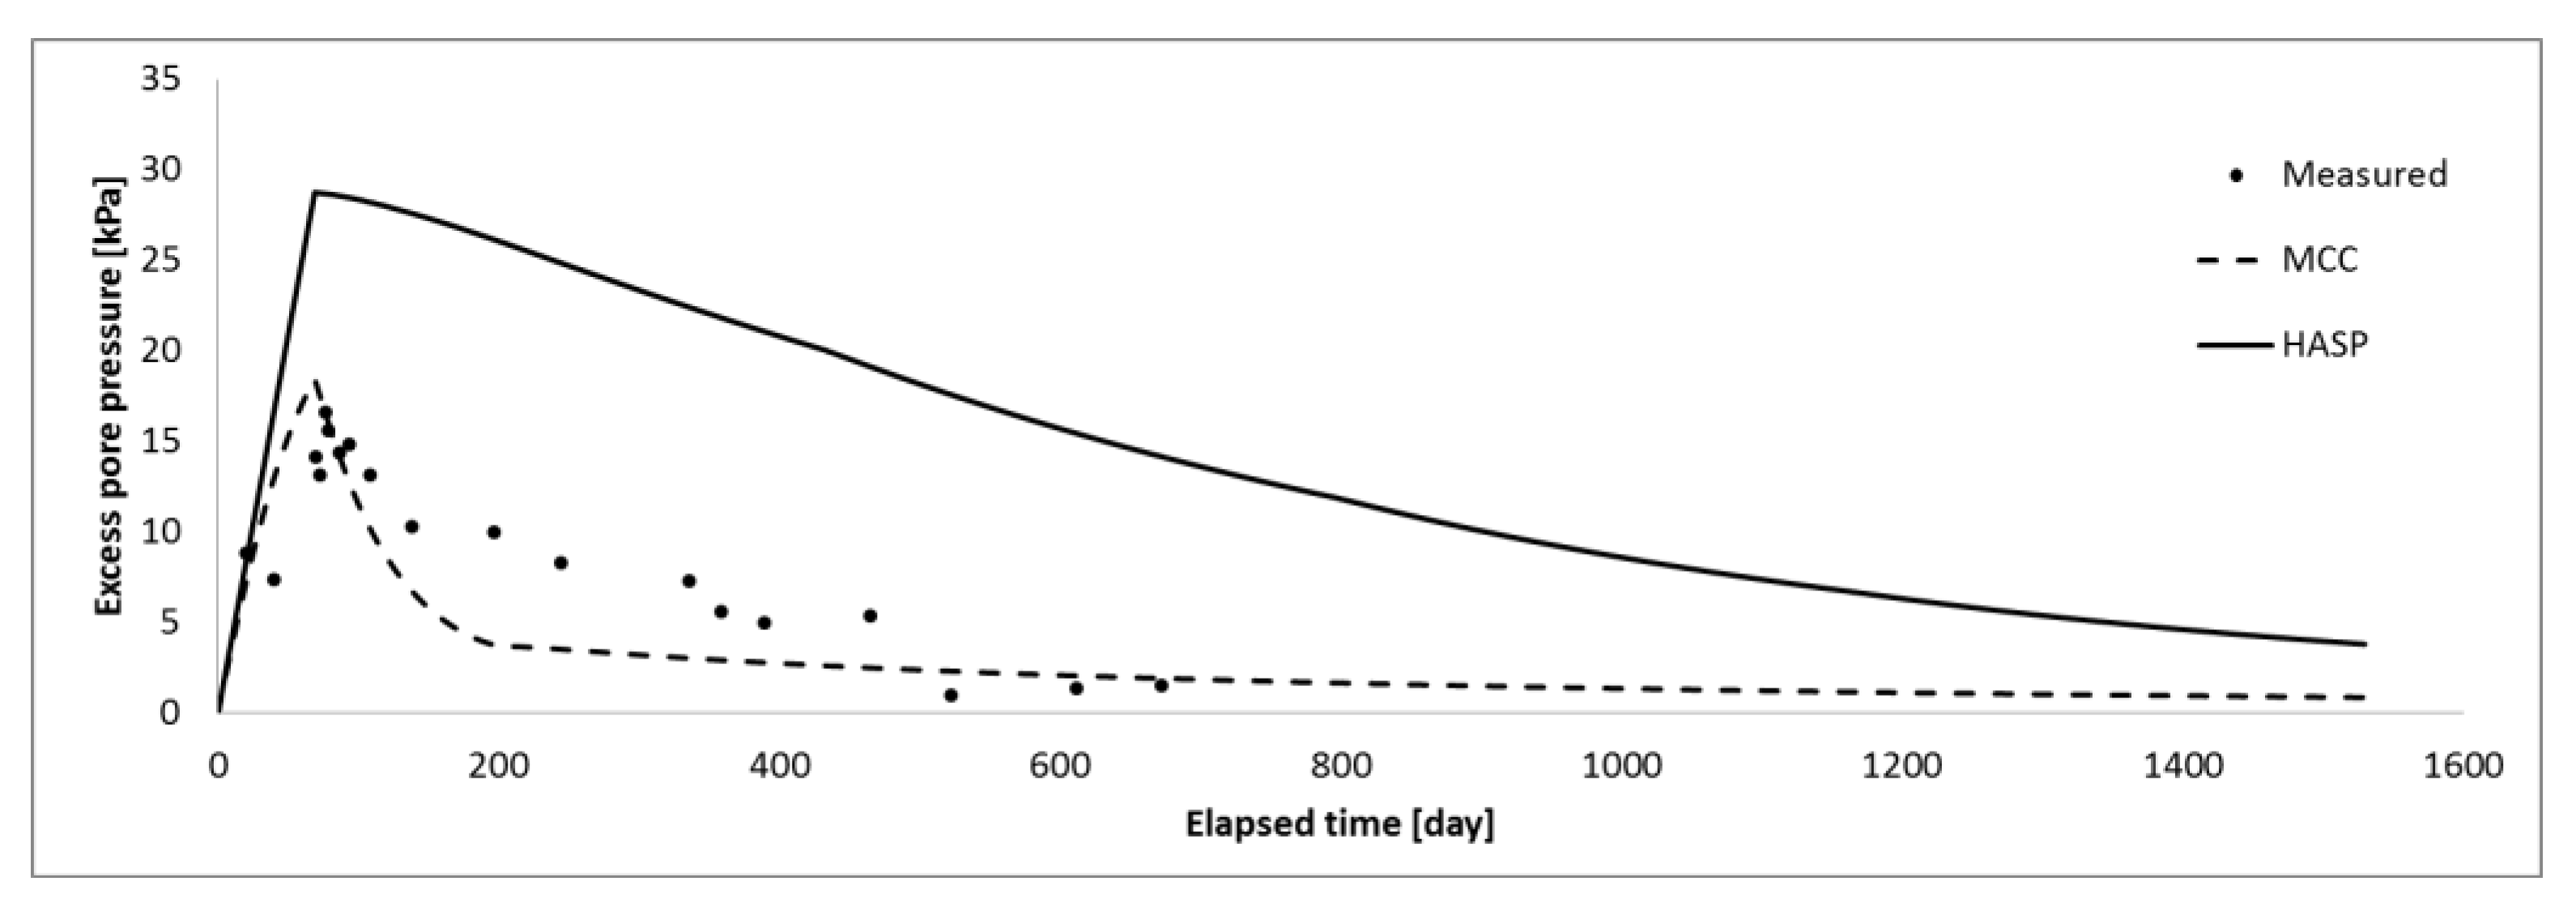
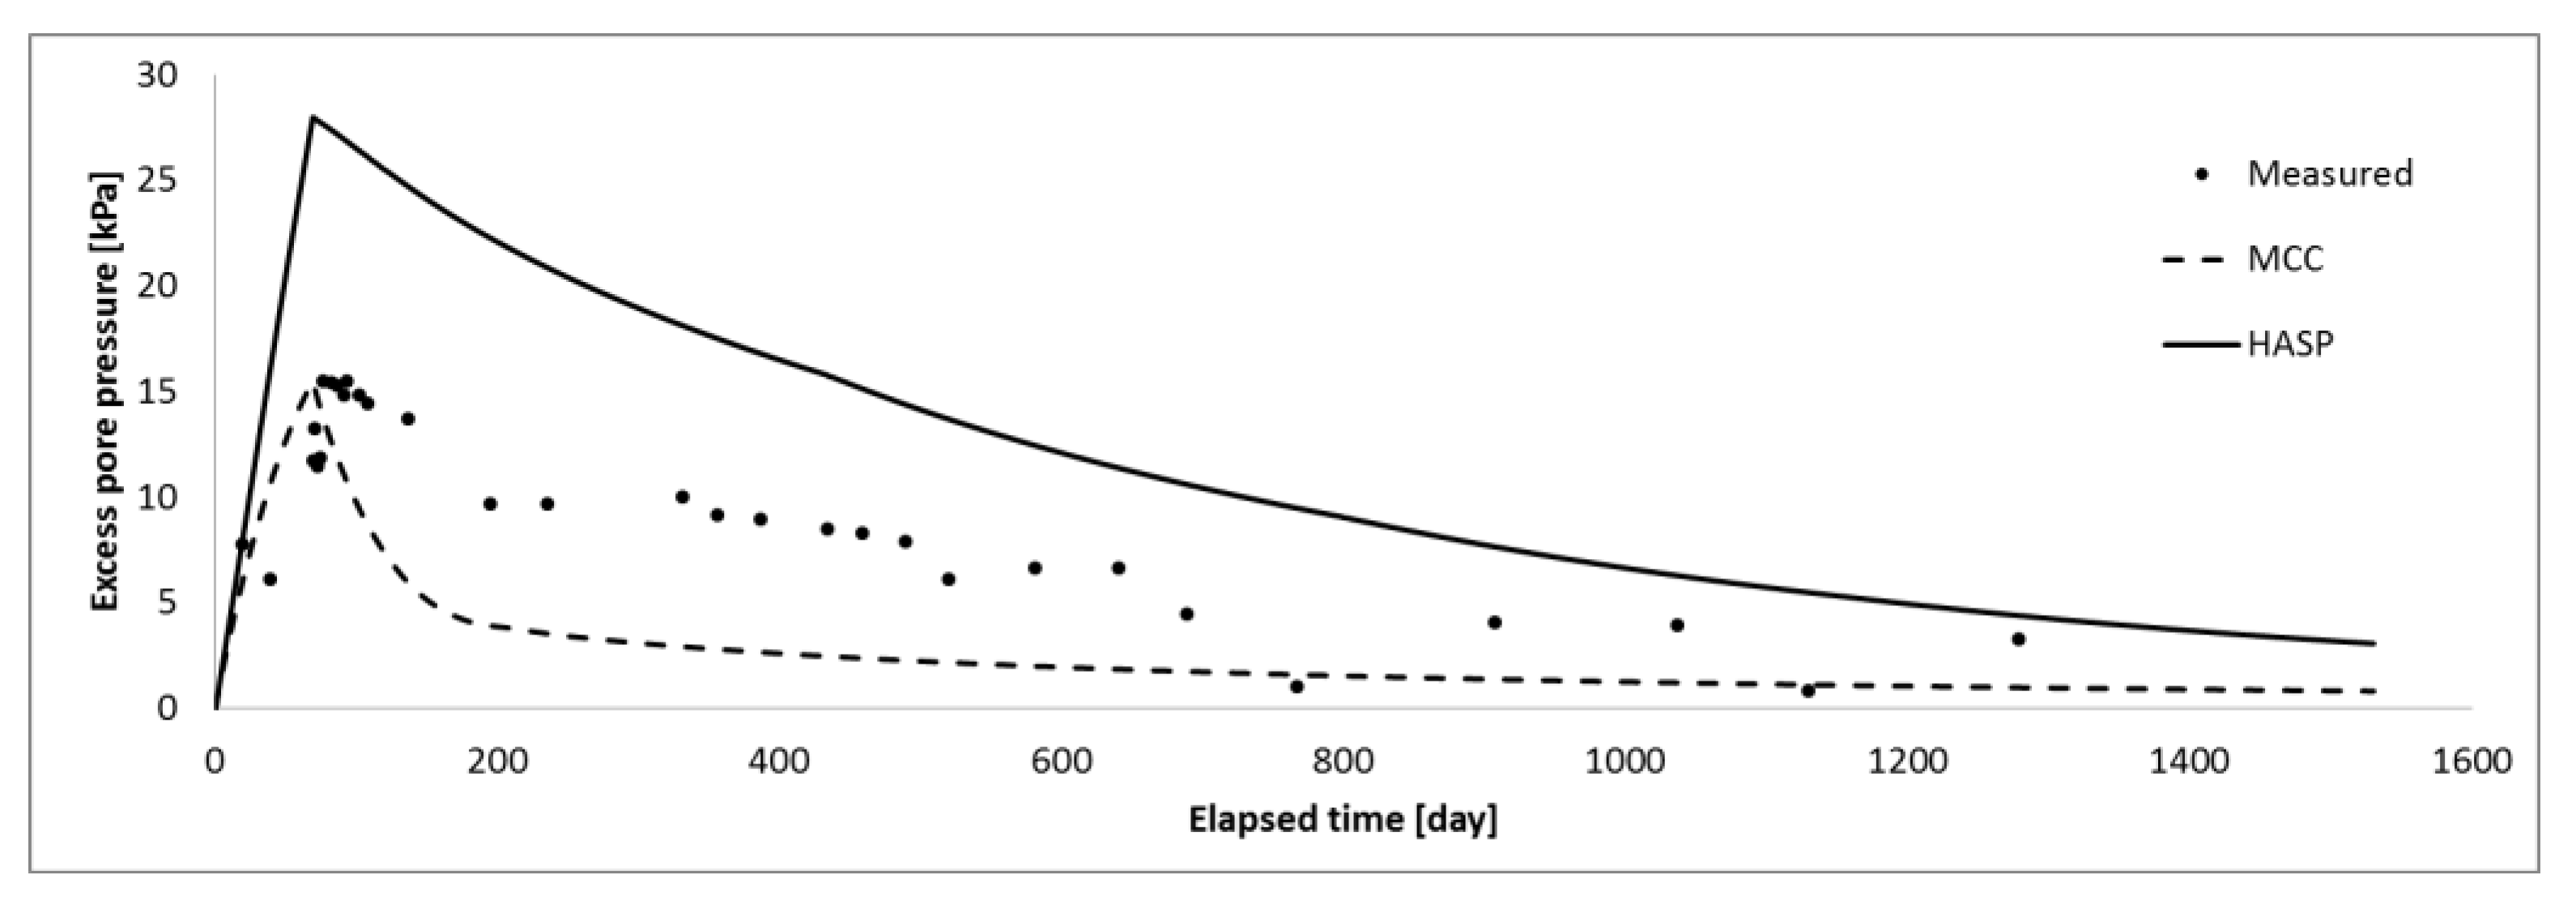
Comparisons of the measured and predicted excess pore water pressures at pore pressures gauges PC2-1, PC2-2, and PC2-3 are shown in Figure 17, Figure 18 and Figure 19. As reported in [8], the measured data at other pore pressure gauges show some inconsistent variations over time, so the comparisons for those are not included. As for the excess pore water pressure—time curves for Embankment A, similar trends are observed.
The same as for Embankment A, both models overpredict the peak excess pore pressures. The HASP soil model markedly overpredicts the excess pore pressures throughout the whole calculation. Since the stress path is completely in the elastic range, the MCC model underpredicts the excess pore pressure through the end of the calculation. It predicts a rapid decrease in the excess pore pressures after reaching its peak values. At the end of the calculation, both models seem to converge to similar values of excess pore pressures. The predicted final values of the excess pore pressures from the MCC model indicates that primary consolidation is ended, e.g., excess pore pressure—time curves have become a flat line, while it still needs more time for total dissipation of the excess pore pressures in the HASP soil model.
As stated in [1], quantitatively accurate predictions of pore pressure variations over time are a challenging task. Discrepancies between measured and predicted values are often noted. There are numerus reasons for this, such as limitations of the constitutive model, the numerical model, the nature of the instrumentation, and inadequate permeability which does not represent the actual behavior of the subsoil [1,6,8].

6.2.3. Settlement of the Ground Surface

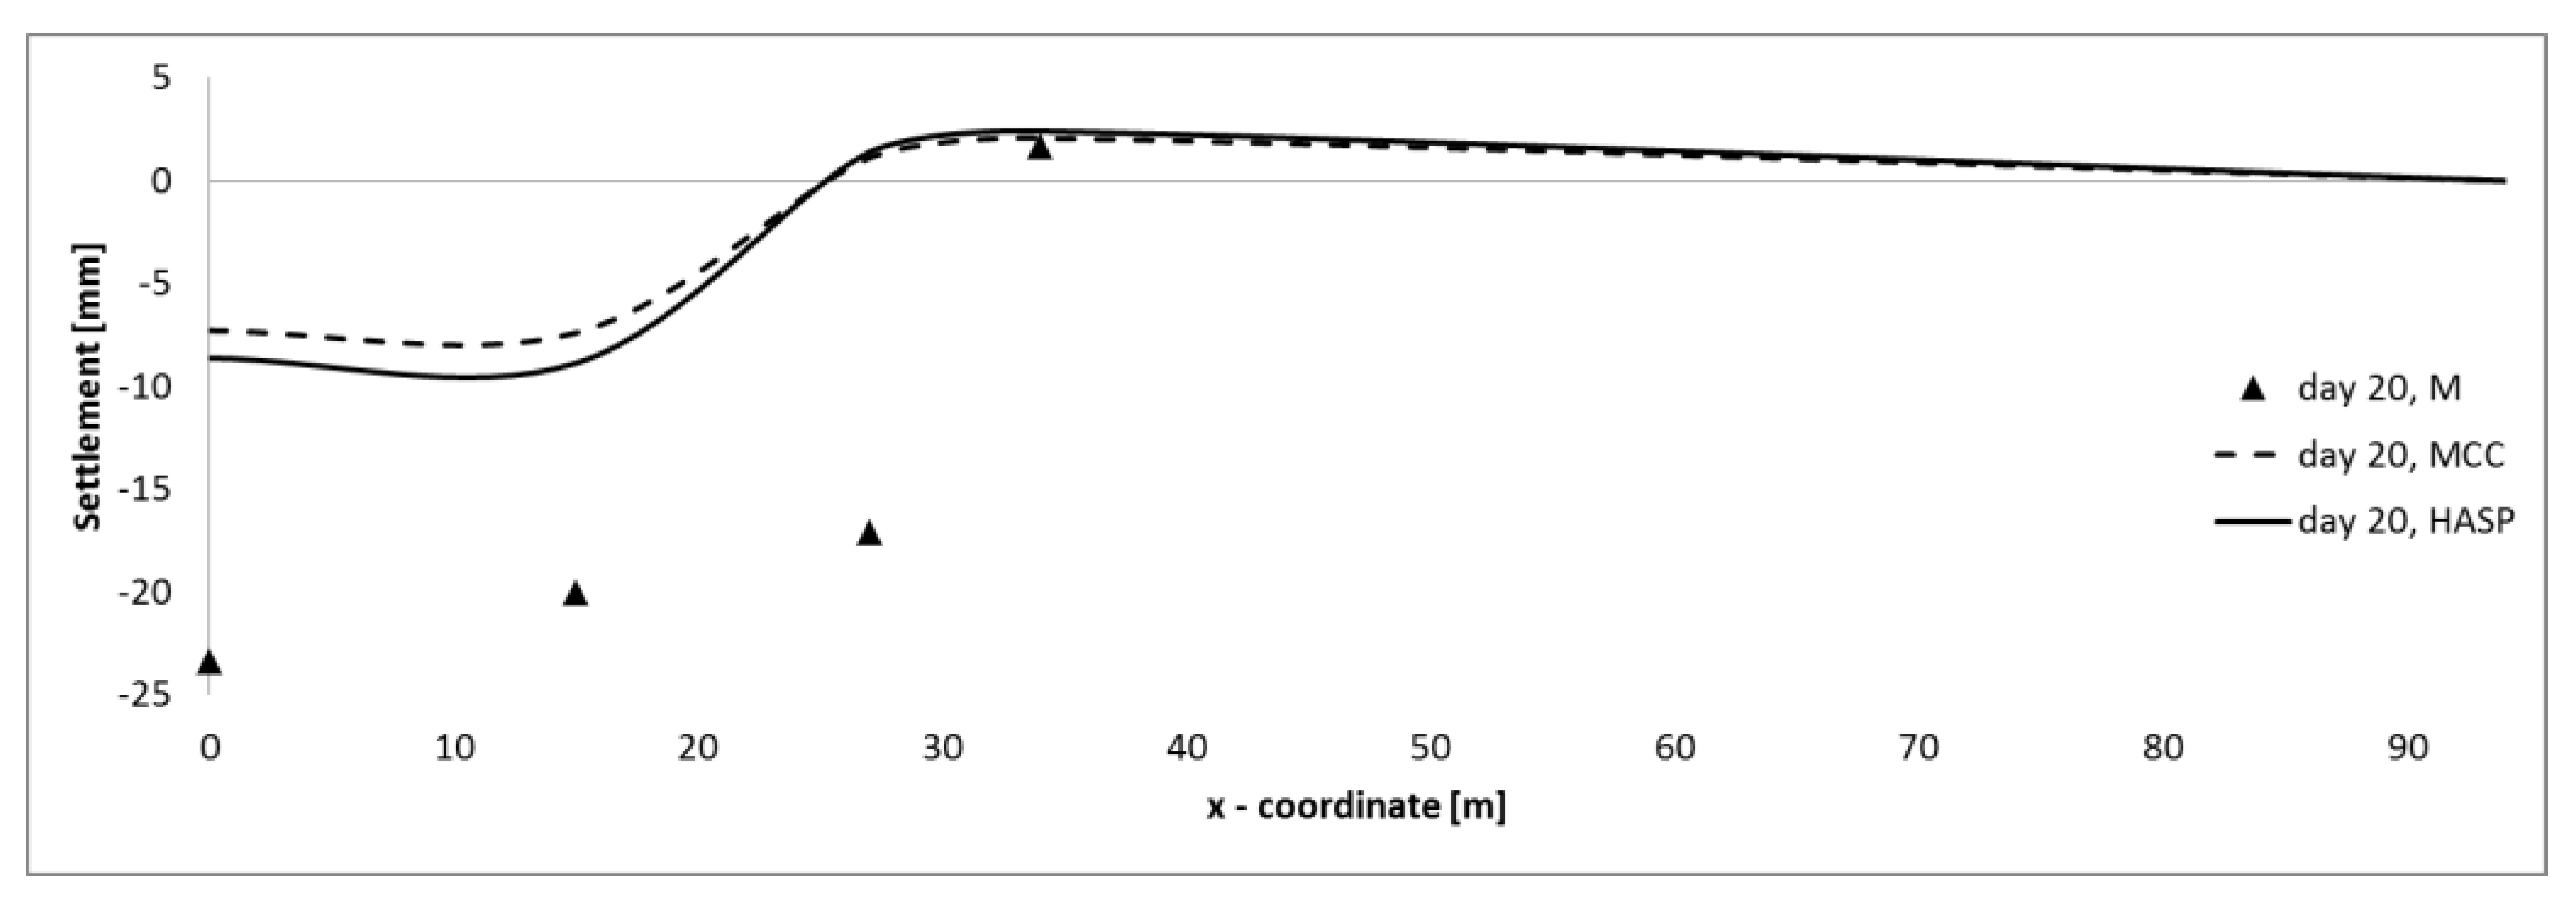
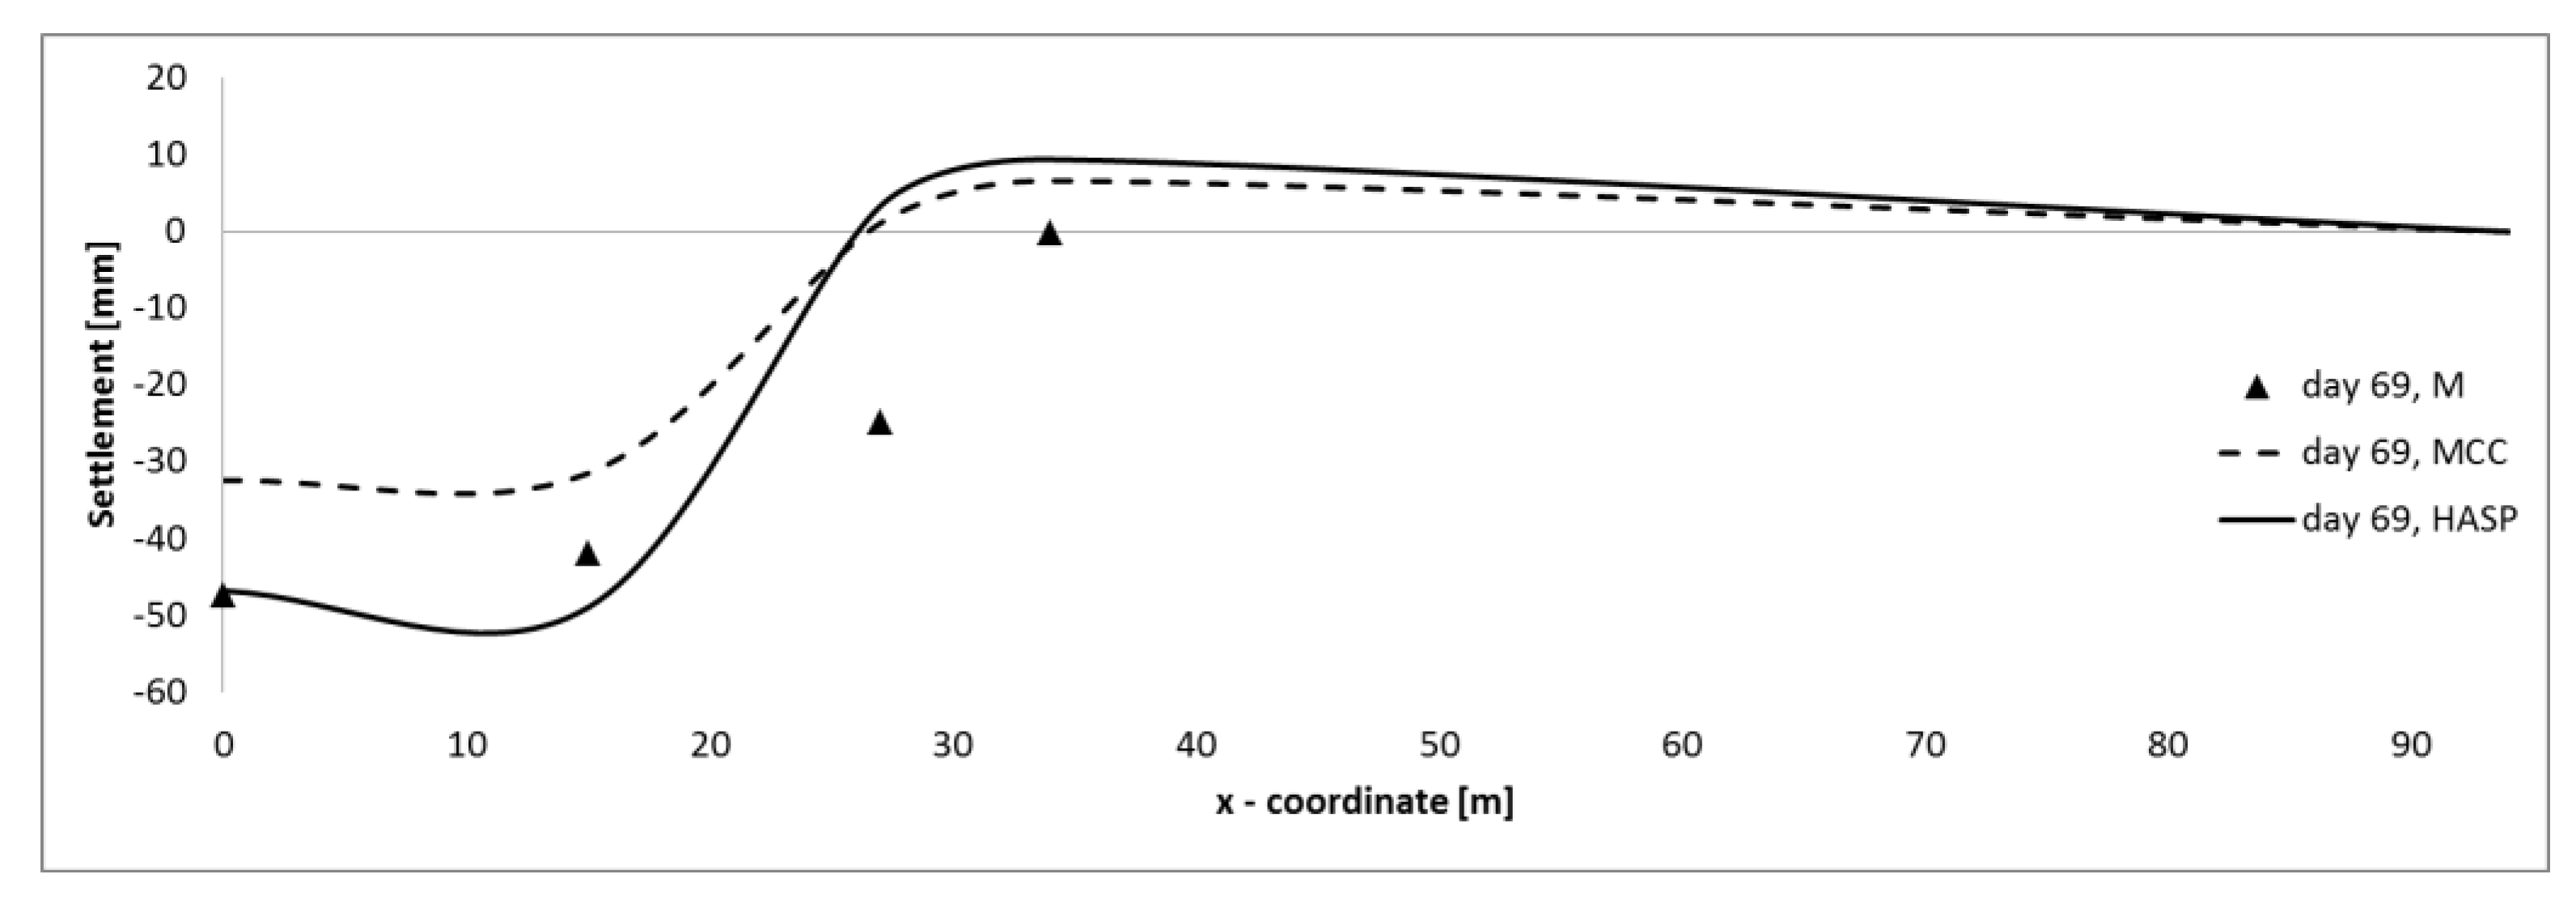
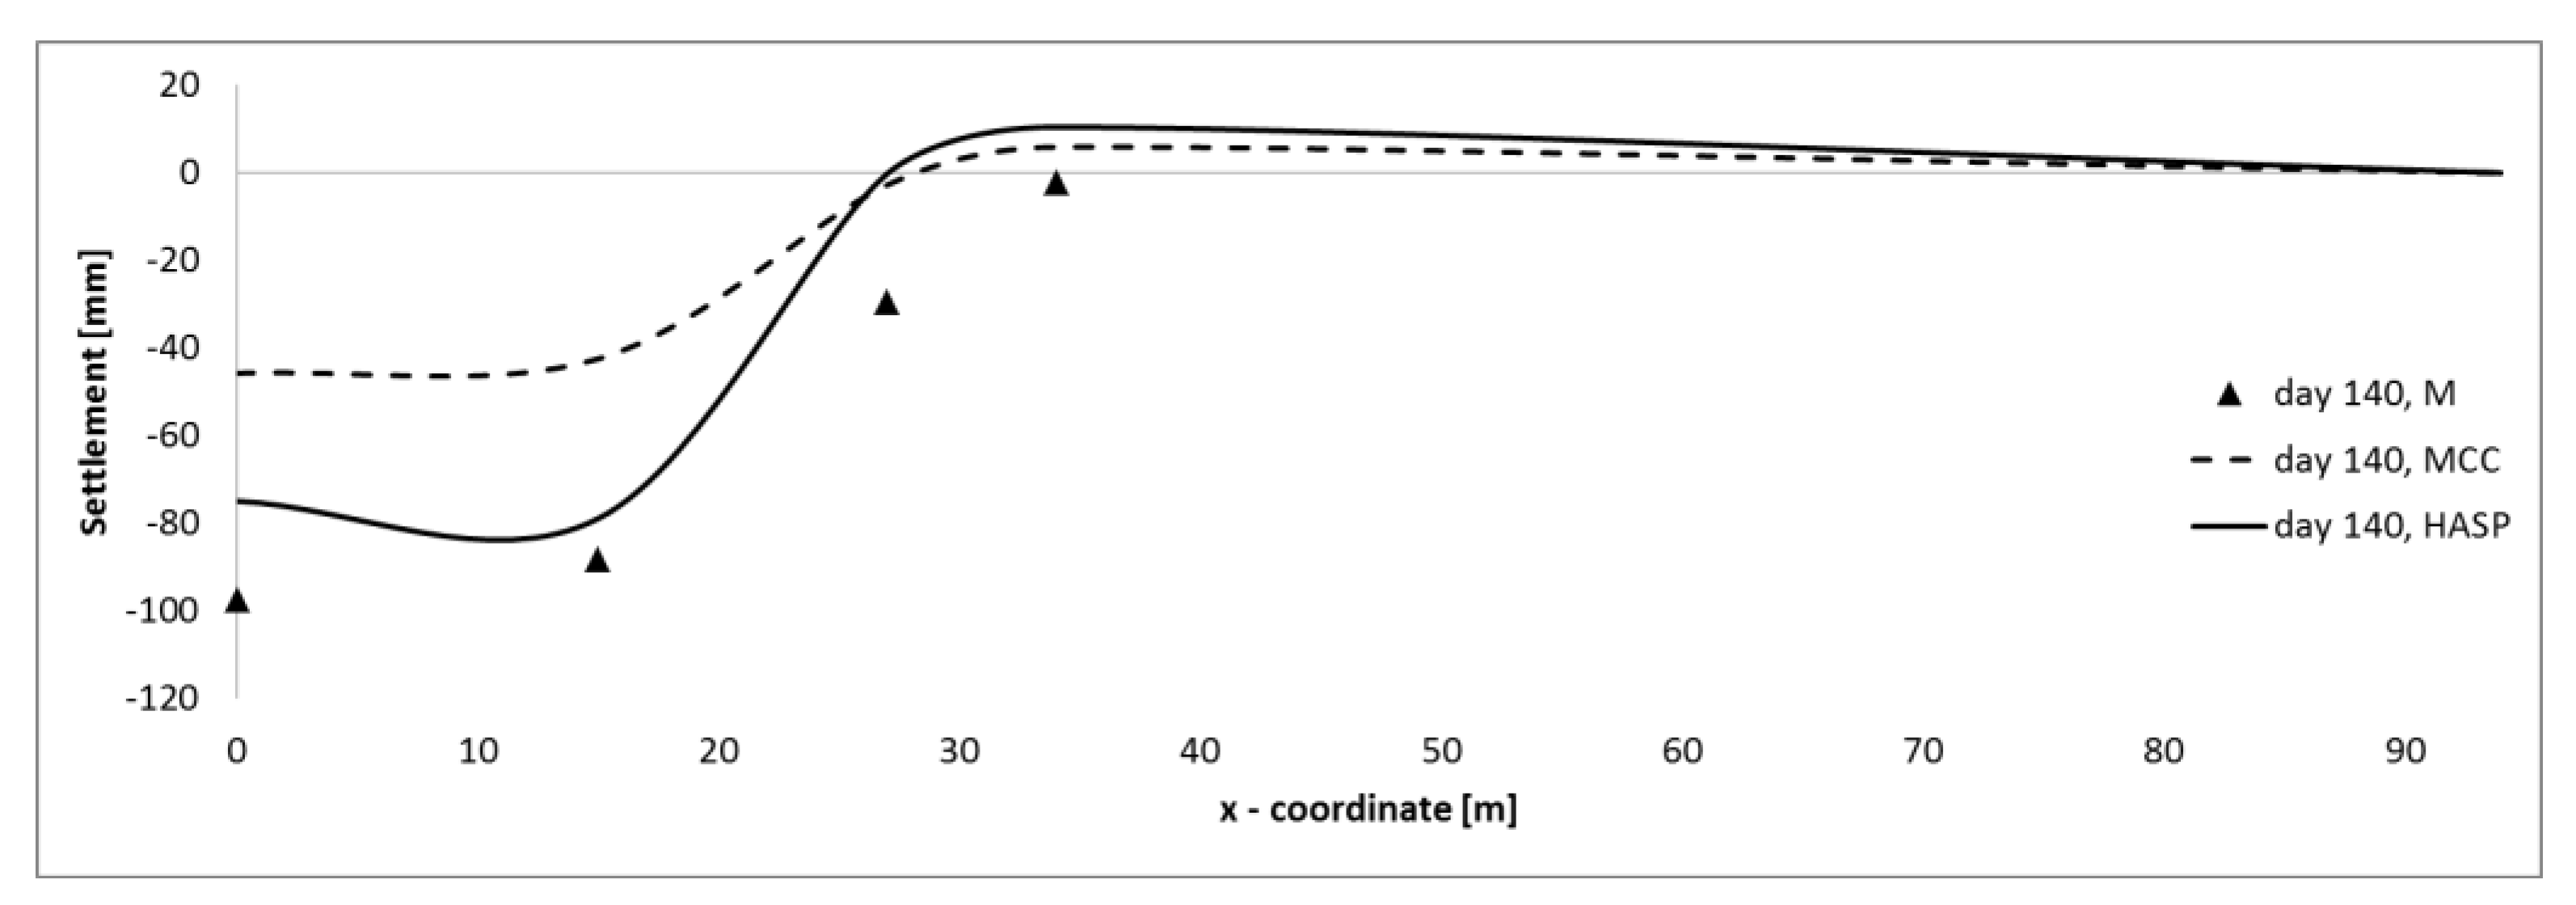
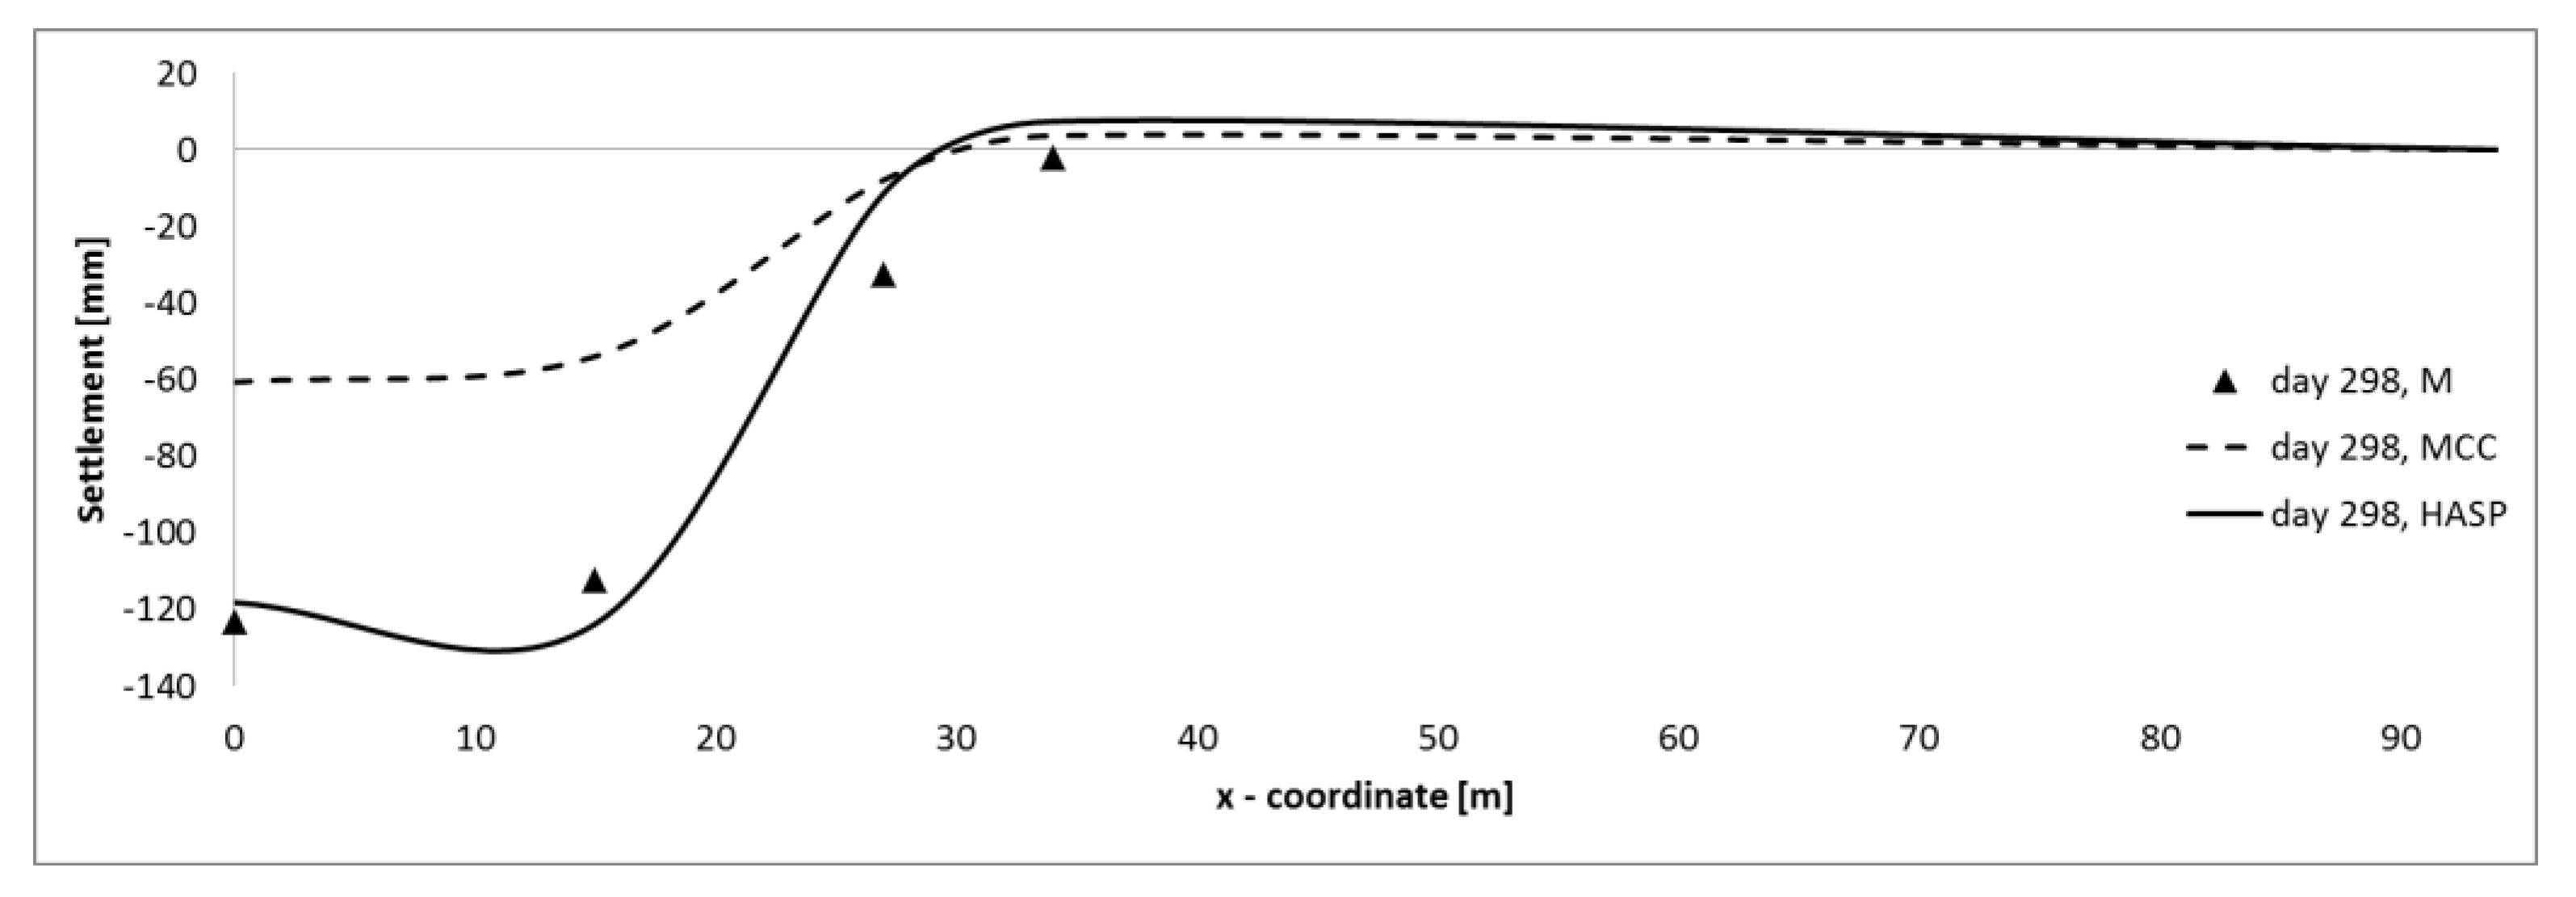
Comparisons of the measured and predicted settlements of the ground surface are given in Figure 20, Figure 21, Figure 22, Figure 23 and Figure 24. Measured settlements were available for settlement plates A, B, C, and D (see Figure 4). Comparisons are given for day 20 (during the embankment construction), day 69 (end of embankment construction), day 140, day 298, and day 1046.
As can be seen in Figure 20, Figure 21, Figure 22, Figure 23 and Figure 24, both models produce the shape of the deformed ground surface similar to the measured one. They both predict that the ground surface outside of the embankment (point D) will first move upwards and then downwards. Both models predict similar positions of zero ground movements.
The MCC model significantly underpredicts the ground surface settlements at points A and B throughout the entire calculation. At point D, the deviation is much smaller, because it is a point outside the embankment, where there are small additional stresses from the embankment construction. The HASP model satisfactorily predicts the ground surface settlement, except during the embankment construction (day 20).
After the end of the embankment’s construction, the HASP model always gives larger settlements than the MCC model. In general, the HASP model again demonstrates that the similar amount of settlement is mobilized as observed experimentally, due to the reasons mentioned above.

7. Conclusions

The application of the HASP constitutive model for the numerical prediction of the soft overconsolidated clay behavior due to embankment loading is presented. A fully coupled flow-deformation analysis was performed in the PLAXIS 2D FEM software package. Additional numerical predictions were conducted using the Modified Cam Clay model for soft overconsolidated clay layers. The obtained results were compared to the field measurements, consisting of settlements, excess pore water pressure recordings, as well as ground surface settlement profiles.
Taking into account the state of the soil and the overconsolidation ratio as important determinants of a soil’s mechanical response, the hardening coefficient of the HASP model is introduced. There is no pure elastic domain, but the hardening coefficient reduces the plastic strains and controls all elements of the mechanical behavior of overconsolidated clays. Without explicitly taking into account anisotropy, destructuration and creep, excellent agreement is obtained between computed values and field observations.
During the construction of the embankment, the HASP model can provide satisfactory settlement predictions, which are qualitatively and quantitatively consistent with the field measurements, while the MCC model fails to provide reasonable predictions. For these two constitutive models, significant differences in the predicted strain magnitudes are observed. Due to the overconsolidation of the surface layers, the MCC model predicts only elastic strains, while the hardening coefficient of the HASP model adequately controls the whole process of clay deformation. Thus, the overconsolidation ratio of the soft soil is the key parameter controlling the amount of deformation of the deposit under the embankment loading. On the other hand, deviations in predicting the development of pore water pressures are observed for Embankment B.
Reliable numerical prediction of the mechanical behavior of embankments for supporting roads, railroads, or for flood protection is an integral part of the infrastructure management policy. The estimation of construction and postconstruction settlement of an embankment is a very important serviceability issue, considering the need to maintain the embankment elevation at the designed level. Given that the parameters of the HASP model are obtained by standard laboratory tests, and that reliable predictions of soil deformations are achieved, the advantage over more complex models is clearly observed. From the results of this study, it can be concluded that the simple HASP soil model can be used for routine geotechnical analyses and conventional design procedures.

Author Contributions

Conceptualization, N.O., S.J. and M.V.; methodology, N.O., S.J. and M.V.; software, N.O.; investigation, N.O.; writing—original draft preparation, N.O.; writing—review and editing, S.J. and M.V.; visualization, N.O. and S.J.; supervision, S.J. and M.V. All authors have read and agreed to the published version of the manuscript.

Funding

This research received no external funding.

Institutional Review Board Statement

Not applicable.

Informed Consent Statement

Not applicable.

Data Availability Statement

Not applicable.

Conflicts of Interest

The authors declare no conflict of interest.

Notation

c k constant
d dilatancy
detdeterminant
d ε q p increment of plastic shear strain
d ε v p increment of plastic volumetric strain
d m i n dilatancy at peak stress ratio
e void ratio
e 0 initial void ratio
k h hydraulic conductivity of soil in horizontal direction
k 0 initial value of hydraulic conductivity of soil
k v hydraulic conductivity of soil in vertical direction
p mean effective stress on yield surface
p ¯ mean effective stress on bounding surface
p 0 size of yield surface—hardening parameter
p 0 ¯ size of bounding surface—hardening parameter
q triaxial deviatoric stress on yield surface
q ¯ triaxial deviatoric stress on bounding surface
G elastic shear modulus
J 2 D second invariant of the deviatoric stress tensor
J 3 D third invariant of the deviatoric stress tensor
K elastic bulk modulus
K 0 N C coefficient of at-rest earth pressure for normally consolidated soil
K 0 O C coefficient of at-rest earth pressure for overconsolidated soil
M gradient of critical state line in q p plane
M f gradient of critical state line in q p plane in triaxial compression
M C maximum stress ratio
M E gradient of critical state line in q p plane in triaxial extension
N reference specific volume for p = 1   k P a on virgin compression line
OCRoverconsolidation ratio
POPpreoverburden pressure
R overconsolidation ratio
X, Y, Zconstants
η stress ratio
θ Lode’s angle
κ slope of an swelling line (URL) in ν ln p plane
λ slope of the virgin compression line (VCL) in ν ln p plane
μ Poisson’s ratio
ν specific volume
ξ parameter in hardening rule which controls the influence of plastic shear strains on hardening parameter
ф C friction angle in triaxial compression
ф E friction angle in triaxial extension
ω hardening coefficient
Γ reference specific volume for p = 1   k P a on critical state line
Ψ state parameter for current stress point
Ψ ¯ state parameter for conjugate stress point

References

  1. Rezania, M.; Ngujen, H.; Zanganeh, H.; Taiebat, M. Numerical analysis of Ballina test embankment on a soft structured clay foundation. Comput. Geotech. 2018, 93, 61–74. [Google Scholar] [CrossRef]
  2. Ming, D.; Lin, G.; Mingfeng, L.; Tian, J. The pore pressure generation and deformation of overconsolidated soft marine clay considering initial static shear effect. Mar. Georesour. Geotechnol. 2022, 40, 922–935. [Google Scholar] [CrossRef]
  3. Parry, R. Overconsolidation in soft clay deposits. Geotechnique 1970, 20, 442–446. [Google Scholar] [CrossRef]
  4. Zdravković, L.; Potts, D.M.; Bodas Freitas, T. Extending the life of existing infrastructure. In Proceedings of the XVII ECSMGE-2019, Reykjavik, Iceland, 1–6 September 2019. [Google Scholar] [CrossRef]
  5. Leroueil, S.; Magnan, J.; Tevenas, F. Embankments on Soft Clays, 1st ed.; Ellis Horwood: New York, NY, USA, 1990; 360p. [Google Scholar]
  6. Chai, J.; Igaya, Y.; Hino, T.; Carter, J. Finite element simulation of an embankment on soft clay—Case Study. Comput. Geotech. 2012, 48, 117–126. [Google Scholar] [CrossRef]
  7. Roscoe, K.H.; Burland, J.B. On the generalized stress-strain behavior of wet clay. In Engineering Plasticity; Cambridge University Press: Cambridge, UK, 1968; pp. 535–609. [Google Scholar]
  8. Huang, W.; Fityus, S.; Bishop, D.; Smith, D.; Sheng, D. Finite-element parametric study of the consolidation behaviour of a trial embankment on soft clay. Int. J. Geomech. 2006, 6, 328–341. [Google Scholar] [CrossRef]
  9. Karstunen, M.; Wiltafsky, C.; Krenn, H.; Scharinger, F.; Schweiger, H.F. Modelling the behavior of an embankment on soft clay with different constitutive models. Int. J. Numer. Anal. Methods Geomech. 2006, 30, 953–982. [Google Scholar] [CrossRef]
  10. Karstunen, M.; Krenn, H.; Wheeler, S.J.; Koskinen, M. Effect of anisotropy and destructuration on the behavior of Murro test embankment. Int. J. Geomech. 2005, 5, 87–97. [Google Scholar] [CrossRef]
  11. Naatanen, A.; Vepsalainen, P.; Lojander, M. Finite element calculations on Haarajoki test embankment. In Proceedings of the Fourth European Conference on Numerical Methods in Geotechnical Engineering Numge98, Udine, Italy, 14–16 October 1998. [Google Scholar]
  12. Tashiro, M.; Noda, T.; Inagaki, M.; Nakano, M.; Asaoka, A. Prediction of settlement in natural deposited clay ground with risk of large residual settlement due to embankment loading. Soils Found. 2011, 51, 133–149. [Google Scholar] [CrossRef]
  13. Zdravković, L.; Potts, D.M.; Hight, D.W. The effect of strength anisotropy on the behavior of embankments on soft ground. Geotechnique 2002, 52, 447–457. [Google Scholar] [CrossRef]
  14. Venda Oliveira, P.J.; Lemos, L.J.L.; Coelho, P. ALF. Behavior of an atypical embankment on soft soil: Field observations and numerical simulation. J. Geotech. Geoenviron. Eng. ASCE 2010, 136, 35–47. [Google Scholar] [CrossRef]
  15. Kim, J.; Yun, S.K.; Im, E.S.; Kang, G. A case study for the behavior of consolidated settlement considering overconsolidated layer. KSCE J. Civ. Eng. 2022, 26, 4302–4316. [Google Scholar] [CrossRef]
  16. Zhiwei, G.; Zhao, J.; Yin, Z.Y. Dilatancy relation for overconsolidated clay. Int. J. Geomech. 2017, 17, 793–799. [Google Scholar] [CrossRef]
  17. Gallikova, Z.; Rehman, Z. Appraisal of the hypoplastic model for the numerical prediction of high-rise building settlement in Neogene clay based on real-scale monitoring data. J. Build. Eng. 2022, 50, 104152. [Google Scholar] [CrossRef]
  18. Vesterberg, B.; Andersson, M. Settlement and pore pressure behavior and predictions of test embankments on an organic clay. J. Geotech. Eng. 2022, 16, 1049–1067. [Google Scholar] [CrossRef]
  19. Karstunen, M.; Amavasai, A. Best Soil: Soft Soil Modelling and Parameter Determination, Research Report for Big Project A2015-06; Chalmers University of Technology: Gothenburg, Sweden, 2017; p. 84. [Google Scholar]
  20. Nallathamby, S.; Rezania, M. The comparison of modelling inherent and evolving anisotropy on the behavior of a full-scale embankment. J. Geotech. Eng. 2017, 11, 343–354. [Google Scholar] [CrossRef]
  21. Venda Oliveira, P.J.; Lemos, L.J.L. Numerical predictions of the behavior of soft clay with two anisotropic elastoplastic models. Comput. Geotech. 2011, 38, 598–611. [Google Scholar] [CrossRef]
  22. Whittle, A.; Kavvadas, M. Formulation of MIT-E3 constitutive model for overconsolidated clays. J. Geotech. Eng. 1994, 120, 173–198. [Google Scholar] [CrossRef]
  23. Venda Oliveira, P.J.; Araujo Santos, L.M.; Almeida e Sousa, J.N.V.; Lemos, L.J.L. Effect of initial stiffness on the behaviour of two geotechnical structures: An embankment and a tunnel. Comput. Geotech. 2021, 136, 104181. [Google Scholar] [CrossRef]
  24. Potts, D.L.; Zdravković, L. Finite Element Analysis in Geotechnical Engineering—Theory, 1st ed.; Thomas Telford Publishing: London, UK, 1999; 440p. [Google Scholar]
  25. Grammatikopoulou, A.L.; Zdravković, L.; Potts, D.M. The effect of the yield and plastic potential deviatoric surfaces on the failure height of an embankment. Geotechnique 2007, 57, 795–806. [Google Scholar] [CrossRef]
  26. Freitas, T.; Bodas, M.; Potts, D.M.; Zdravković, L. A time dependent constitutive model for soil with isotach viscosity. Comput. Geotech. 2011, 38, 809–820. [Google Scholar] [CrossRef]
  27. Jocković, S.; Vukićević, M. Bounding surface model for overconsolidated clays with new state parameter formulation of hardening rule. Comput. Geotech. 2017, 83, 16–29. [Google Scholar] [CrossRef]
  28. Been, K.; Jefferies, M.G. A state parameter for sands. Geotechnique 1982, 35, 99–112. [Google Scholar] [CrossRef]
  29. Jocković, S.; Vukićević, M. Critical state constitutive model for overconsolidated clays—HASP model. In Proceedings of the XVI Danube—European Conference on Geotechnical Engineering, Skopje, North Macedonia, 7–9 June 2018. [Google Scholar]
  30. Jocković, S.; Vukićević, M. Validation and implementation of HASP constitutive model for overconsolidated clays. Build. Mater. Struct. 2018, 61, 91–109. [Google Scholar] [CrossRef]
  31. Potts, D.M.; Zdravković, L. Some Pitfalls when Using Modified Cam Clay; Imperial College: London, UK, 2000; pp. 14p. [Google Scholar]
  32. Van Eekelen, H.A.M. Isotropic yield surfaces in three dimensions for use in soil mechanics. Int. J. Numer. Anal. Methods Geomechani. 1980, 4, 89–101. [Google Scholar] [CrossRef]
  33. Zdravković, L.; Taborda, D.; Potts, D.M.; Abadias, D.; Burd, H.; Byrne, B.; Gavin, K.; Houlsby, G.; Jardine, R.; Martin, C.; et al. Finite-element modelling of laterally loaded piles in a stiff glacial clay till at Cowden. Geotechnique 2020, 70, 999–1013. [Google Scholar] [CrossRef]
  34. Nova, R.; Wood, D.M. A constitutive model for sand in triaxial compression. Int. J. Numer. Anal. Methods Geomechani. 1979, 3, 255–278. [Google Scholar] [CrossRef]
  35. Yao, Y.P.; Hou, W.; Zhou, A.N. UH model:three-dimensional unified hardening model for overconsolidated clays. Geotechnique 2009, 59, 451–469. [Google Scholar] [CrossRef]
  36. PLAXIS Manuals. A Constitutive Model for Overconsolidated Clay Based on the Hardening State Parameter. Available online: https://communities.bentley.com/products/geotech-analysis/w/wiki/46246/oc-clay---plaxis-udsm (accessed on 13 January 2023).
  37. Kojić, M.; Slavković, R.; Grujić, N.; Vukićević, M. Implicit stress integration algorithm for Modified Cam Clay material. Theoretical and Appl. Mech. 1994, 20, 95–119. [Google Scholar]
  38. Kojić, M.; Bathe, K.J. Inelastic Analysis of Solids and Structures, 1st ed.; Springer-Verlag: Berlin/Heidelberg, Germany, 2003; 414p. [Google Scholar]
  39. Schofield, A.; Wroth, P. Critical State Soil Mechanics, 1st ed.; Cambridge University: Cambridge, UK, 1968; pp. 228p. [Google Scholar]
  40. PLAXIS Manuals. Available online: https://communities.bentley.com/products/geotech-analysis/w/wiki/46137/manuals---plaxis (accessed on 13 January 2023).
  41. Zdravković, L.; Potts, D.M.; Jackons, C. Numerical Study of the effect of preloading on undrained bearing capacity. Int. J. Geomech. 2013, 3, 1–10. [Google Scholar] [CrossRef]
  42. Chai, J.-C.; Miura, N. Investigation on some factors affecting vertical drain behavior. J. Geotech. Geoenvironmental Eng. ASCE 1999, 125, 216–226. [Google Scholar] [CrossRef]
  43. Tavenas, F.; Tremblay, M.; Larouche, G.; Lerouei, I.S. In situ measurement of permeability in soft clays. In Proceedings of the ASCE Special Conference on Use of In-Situ Test in Geotechnical Engineering, Blacksburg, VA, USA; 1986. [Google Scholar]
  44. Jaky, J. The coefficient of earth pressure at rest. J. Soc. Hung. Arch. Eng. 1944, 78, 355–358. [Google Scholar]
  45. Wood, D.M. Soil Behavior and Critical State Soil Mechanics, 1st ed.; Press Syndicate of the University of Cambridge: Cambridge, UK, 1990; 461p. [Google Scholar]
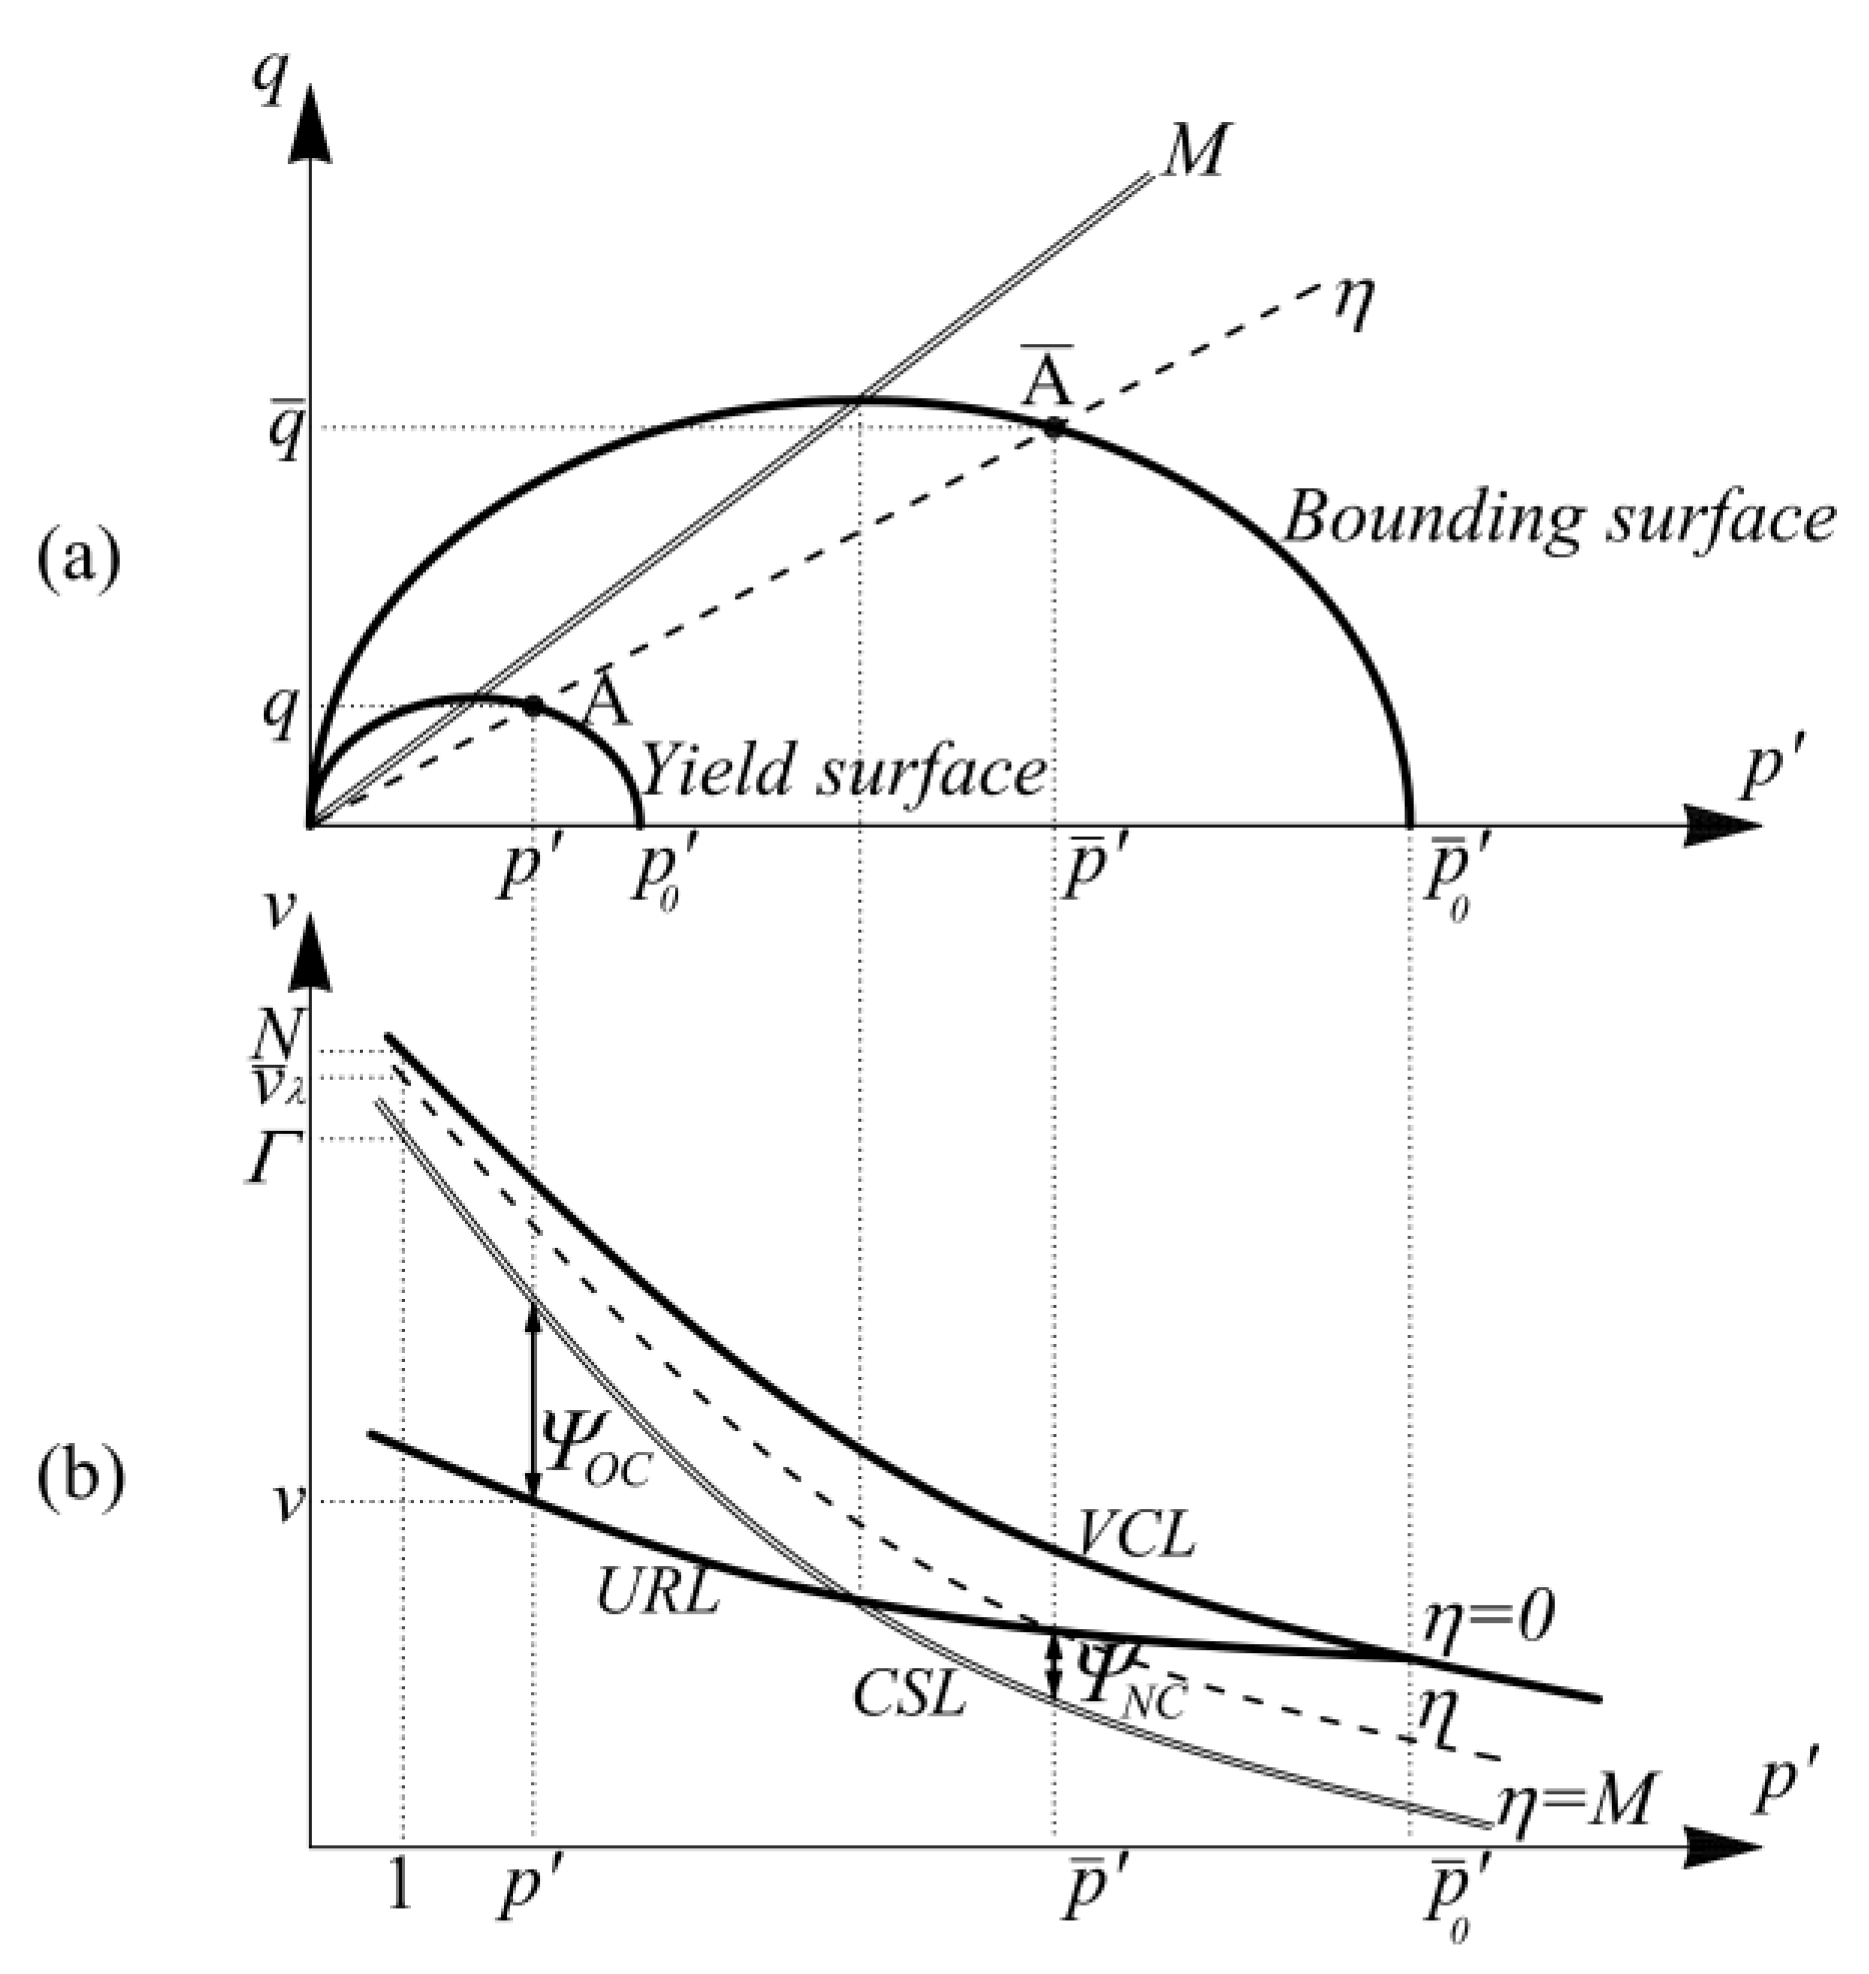
Figure 1. (a) Bounding surface concept; (b) State parameters [27].
Applsci 13 02175 g001
Figure 2. CU triaxial test, Cardiff clay—deviatoric stress-axial strain relations [27]. OCR—overconsolidation ratio.
Applsci 13 02175 g002
Figure 3. Cross section of the embankment and key instrumentation points of Embankment A. (adapted from [6]).
Applsci 13 02175 g003
Figure 4. Cross section of the embankment and key instrumentation points of Embankment B. (adapted from [8]).
Applsci 13 02175 g004
Figure 5. Mesh and boundary conditions—Embankment A.
Applsci 13 02175 g005
Figure 6. Mesh and boundary conditions—Embankment B.
Applsci 13 02175 g006
Figure 7. Variation of OCR with depth for Embankment A [6] (a) and Embankment B [8] (b).
Applsci 13 02175 g007
Figure 8. Comparison of settlement-time curves for Embankment A—Point S 0 (surface).
Applsci 13 02175 g008
Figure 9. Comparison of settlement-time curves for Embankment A—Point S 1 (2.8 m below surface).
Applsci 13 02175 g009
Figure 10. Effective stress paths for HASP and MCC models for center line at 0 and 2 m depth for Embankment A.
Applsci 13 02175 g010
Figure 11. Comparison of excess pore pressure-time curves for Embankment A—Point P 1 (1.4 m below the surface).
Applsci 13 02175 g011
Figure 12. Comparison of excess pore pressure-time curves for Embankment A—Point P 2 (5.0 m below the surface).
Applsci 13 02175 g012
Figure 13. Comparison of excess pore pressure-time curves for Embankment A—Point P 3 (8.3 m below the surface).
Applsci 13 02175 g013
Figure 14. Comparison of settlement-time curves for Embankment B—Point A.
Applsci 13 02175 g014
Figure 15. Comparison of settlement-time curves for Embankment B—Point B.
Applsci 13 02175 g015
Figure 16. Effective stress paths for HASP and MCC models for center line at 0 and 2 m depth for Embankment B.
Applsci 13 02175 g016
Figure 17. Comparison of excess pore pressure-time curves for Embankment B—Point PC2-1 (3.0 m below the surface).
Applsci 13 02175 g017
Figure 18. Comparison of excess pore pressure-time curves for Embankment B—Point PC2-2 (5.0 m below the surface).
Applsci 13 02175 g018
Figure 19. Comparison of excess pore pressure-time curves for Embankment B—Point PC2-3 (7.0 m below the surface).
Applsci 13 02175 g019
Figure 20. Comparison of the settlement of the ground surface for Embankment B—day 20.
Applsci 13 02175 g020
Figure 21. Comparison of the settlement of the ground surface for Embankment B—day 69.
Applsci 13 02175 g021
Figure 22. Comparison of the settlement of the ground surface for Embankment B—day 140.
Applsci 13 02175 g022
Figure 23. Comparison of the settlement of the ground surface for Embankment B—day 298.
Applsci 13 02175 g023
Figure 24. Comparison of the settlement of the ground surface for Embankment B—day 1046.
Applsci 13 02175 g024
Table 1. Numerical model parameters for Embankment A.
Depth   [ m ] Soil Strata γ *
[ k N / m 3 ]
μ
[ ]
e 0
[ ]
P O P
[ k P a ]
K 0 N C
[ ]
K 0 O C
[ ]
k v
[ 10 4 m d a y ]
k h
[ 10 4 m d a y ]
c k
[ ]
0.0–1.5Surface clay layer16.00.151.50400.511.4869.10.6
1.5–4.0Soft silty clay13.10.153.71150.510.7310.415.61.48
4.0–6.019.92.88100.6217.325.91.15
6.0–8.014.12.7250.5516.524.71.09
8.0–9.815.71.91100.58710.60.76
9.8–12.0Clayey Sand18.00.150.8000.43250025000.32
12.0–15.018.00.80250025000.32
15.0–20.019.00.70250025000.32
Embankment19.00.300.8000.43very high-
* Volumetric weight.
Table 2. Numerical model parameters for Embankment B.
Depth   [ m ] Soil Strata γ
[ k N / m 3 ]
μ
[ ]
e 0
[ ]
P O P
[ k P a ]
K 0 N C
[ ]
K 0 O C
[ ]
k v
[ 10 4 m d a y ]
k h
[ 10 4 m d a y ]
c k
[ ]
0.0–1.0Surface clay layer18.940.30.801010.451.4160.48120.960.32
1.0–2.5Soft clay15.080.332.29980.551.161.432.860.92
2.5–3.5410.81
3.5–8.5270.68
8.5–11.5Dense sand19.80.280.6500.5086417280.26
11.5–15.0Firm Clay15.990.301.6960.530.550.61.20.68
15.0–20.040.54
20.0–30.000.53
Embankment18.00.300.500.53very high-
Table 3. Soil model parameters for Embankment A.
Depth   [ m ] Soil StrataMCC ParametersHASP Parameters
κ   [ ] λ   [ ] M   [ ] ф C   [ ] ф E   [ ]
0.0–1.5Surface clay layer0.0250.251.639.17
1.5–4.0Soft silty clay0.1071.071.639.17
4.0–6.00.1191.19
6.0–8.00.0840.84
8.0–9.80.0660.66
9.8–12.0Clayey sandMC parameters: E = 7500   kPa   c = 20   kPa   ф = 35 °   ψ = 5 °
12.0–15.0MC parameters: E = 20 , 000   kPa   c = 20   kPa   ф = 35 °   ψ = 5 °
15.0–20.0MC parameters: E = 37 , 500   kPa   c = 20   kPa   ф = 35 °   ψ = 5 °
EmbankmentMC parameters: E = 5000   kPa   c = 20   kPa   ф = 35 °   ψ = 0 °
Table 4. Soil model parameters for Embankment B.
Depth   [ m ] Soil StrataMCC ParametersHASP Parameters
κ   [ ] λ   [ ] M   [ ] ф C   [ ] ф E   [ ]
0.0–1.0Surface clay layer0.0110.0781.333340.29
1.0–2.5Soft clay0.020.5871.072729.95
2.5–3.5
3.5–8.5
8.5–11.5Dense sandMC parameters: E = 26 , 672   kPa   c = 5   kPa   ф = 30 °   ψ = 0 °
11.5–15.0Firm clay0.0090.1341.112831.41
15.0–20.0
20.0–30.0
EmbankmentMC parameters: E = 5000   kPa   c = 10   kPa   ф = 28 °   ψ = 0 °
Disclaimer/Publisher’s Note: The statements, opinions and data contained in all publications are solely those of the individual author(s) and contributor(s) and not of MDPI and/or the editor(s). MDPI and/or the editor(s) disclaim responsibility for any injury to people or property resulting from any ideas, methods, instructions or products referred to in the content.