Abstract
Patient Safety Culture (PSC) is the cornerstone of quality healthcare. Prior research has highlighted the critical role of a safety culture in healthcare. The Institute of Medicine (IOM) has emphasized its effectiveness in reducing errors and improving patient care. This systematic review investigated variations in how staff at international hospitals perceive PSC. In addition to assessing the status of patient safety, this investigation offers a comprehensive synthesis of research from multiple countries to inform future research endeavors. It focused on studies published between 2010 and 2024 that used the standardized Hospital Survey on Patient Safety Culture (HSOPSC) tool, versions 1.0 and 2.0. By following the Preferred Reporting Items for Systematic Reviews and Meta-Analyses (PRISMA) guidelines, the review identified vital strengths and weaknesses in PSC globally. Despite these variations, two key strengths emerged consistently across studies, particularly in Asia: teamwork within units and a focus on continuous learning. However, healthcare professionals also raised concerns about a punitive environment that discourages error reporting and inadequate staffing levels. Interestingly, nurses held less positive views on some PSC aspects compared to mixed staff. Several PSC areas of concern raised in previous studies have continued to appear in recent studies. These findings highlight the need for a holistic approach to strengthen PSC globally. This includes fostering a just culture that encourages error reporting, addressing staffing shortages, and promoting open communication among all healthcare professionals. Additionally, tailoring interventions to address regional variations is crucial for creating a safer and more supportive environment for patients worldwide.
1. Introduction
Patient safety has been recognized by the Institute of Medicine (IOM) as a significant cornerstone within healthcare systems, emphasizing its crucial role in improving the overall quality of care [1]. IOM has placed significant emphasis on establishing a safety-oriented culture within healthcare organizations, intending to enhance patient safety and the overall quality of care provided. Ensuring patients are safe is one of the most critical aspects of healthcare. According to the World Health Organization (WHO), “First, do no harm”. This principle asserts that patient safety should be the root of healthcare services [2]. Globally, in healthcare systems, there is substantial evidence of avoidable patient harm in both developed and developing countries, carrying primary humanitarian, ethical, and financial implications [3]. Patient safety culture research holds paramount importance for healthcare sectors worldwide, as it addresses a critical global and local concern [2]. A report from the IOM drew broad attention due to its extensive recommendations. Entitled “To Err Is Human: Building a Safer Health System” and “Crossing the Quality Chasm: A New Health System for the 21st Century,” the data presented in those reports highlight the importance of a safety-oriented culture in healthcare [1,4]. Prioritizing safety not only protects patients and reduces errors, but also promotes the well-being of healthcare workers and enhances the overall quality of care within healthcare organizations [1]. Several initiatives are being implemented to address the patient safety issue. One of them is the Global Patient Safety Action Plan 2021–2030. This initiative was adopted in 2021 by the WHO to prevent avoidable harm, promote patient safety across many practice domains, and help countries develop national action plans [5]. This effort emphasizes the importance of healthcare institutions strengthening their policies and strategies rooted in scientific evidence and patient feedback, as well as building national policies consistent with the global goals of a culture of patient safety. The objective is to eradicate risks and preventable harm for patients and healthcare professionals. Investing in people’s quality of life is a central aspect of real investment, and one of the primary steps is to liberate healthcare systems from harm. According to the WHO, investing in safety and productivity is crucial for achieving positive organizational outcomes [3,6].
According to the report of the Health and Safety Commission Advisory Committee [7], safety culture (SC) has been defined as the collective outcome of personal and team beliefs, feelings, viewpoints, skills, and behavioral tendencies that shape the level of dedication, as well as the manner and effectiveness of safety management and an organization’s health. The concept of patient safety culture (PSC) is a crucial element within the realm of organizational safety culture in the healthcare sector. It is defined as the mitigation of potential harm connected with healthcare to a tolerable level [8]. The perception of SC might be confused with the quality of healthcare, where the quality of healthcare is multifaceted and lacks a concise definition due to its susceptibility to the many perspectives and interests of those concerned, as well as the disparity characteristics of healthcare facilities [9]. Hence, the concept of quality of care has been delineated by considering various dimensions, including but not limited to accuracy, empathy, safety, reliability, efficacy, affordability, and effectiveness [10].
Patient safety is a paramount aspect of healthcare, aiming to minimize errors and adverse effects associated with medical care. The IOM has delineated six domains of healthcare quality to enhance this [4]. Safety ensures a risk-free environment and systems to mitigate errors. Effectiveness promotes evidence-based practices to provide appropriate care in a timely manner. Patient-centeredness emphasizes respect and responsiveness to individual patient preferences. Timeliness focuses on reducing delays for both patients and providers. Efficiency maximizes resource use, preventing waste, while Equity ensures consistent quality care across diverse patient demographics. Together, these domains foster a comprehensive approach to PSC, necessitating commitment from all healthcare organization levels and embedding a culture valuing safety, accountability, and continual improvement.
Numerous instruments and frameworks are available for assessing the perceptions of PSC within several healthcare settings [11,12]. One of the most popular instruments in healthcare patient safety research, called the Hospital Survey on Patient Safety Culture (HSOPSC), was developed by the Agency for Healthcare Research and Quality (AHRQ) [13]. This model is a fundamental framework for assessing, improving, and monitoring PSC in healthcare facilities. Also, it identifies essential elements such as leadership commitment to safety, teamwork, organizational learning, open communication, and overall perceptions of patient safety. HSOPSC was first introduced in the 2004 version (1.0) by AHRQ and received an update in the 2019 version (2.0). The first HSOPSC (1.0) assessed PSC across twelve dimensions with 42 subitems. However, the revised HSOPSC (2.0) version streamlined the assessment to ten dimensions with 32 subitems. Both surveys used a 5-point agreement scale from “strongly agree” to “strongly disagree” on some items or a frequency scale from “never” to “always,” as well as an option for “does not apply” or “does not know”. In addition, two items were used as outcome measures [14]. One is to rate the unit’s overall patient safety, which is from poor to excellent, and another item focuses on the number of events reported in the previous 12 months [13]. These will provide a view and analysis of the effects of organizational culture, such as behavior and shared beliefs and values, and their intersections with PSC, identifying strengths and areas for improvement in the culture of patient safety [15,16]. As a result, this will enhance patient outcomes, reduce medical errors, and create a safer environment for patients and healthcare professionals [13,17].
Research on PSC has primarily been conducted within individual countries. A comprehensive view of PSC across continents is still lacking, making it difficult to identify regional trends and best practices that could enhance patient safety culture globally. Also, understanding the multifaceted nature of PSC is essential for its ongoing improvement. Therefore, this study aims to bridge that gap by providing a global perspective on PSC. This systematic review will identify key factors, recognized in previous studies, that contribute to or undermine a strong patient safety culture in hospitals worldwide. The review will offer a comprehensive exploration of these factors by meticulously examining research from diverse countries. Additionally, it will shed light on the current state of PSC worldwide, focusing on identifying variations across different continents and healthcare professional groups. The review will assess these variations by analyzing studies that use the standardized HSOPSC, given its widespread adoption and established psychometric properties [12]. By examining data from various countries, this analysis will provide aggregated results on global PSC variations. Moreover, this comprehensive overview will serve as a valuable foundation for future research and could inform the development of targeted interventions to improve PSC across diverse healthcare settings worldwide.
2. Methodology and Review Questions
This review will analyze global research to identify key factors influencing patient safety culture in hospitals. To ensure the accuracy of the research process and provide a comprehensive view, the Preferred Reporting Items for Systematic Reviews and Meta-Analyses (PRISMA) protocol, as found by Moher [18], will be used to review and report findings. This review is driven by two research questions:
- How do perceptions of patient safety culture vary among hospital providers (nurses, doctors, etc.) across different countries?
- What are the areas of concern and strength identified within the PSC dimensions?
2.1. Data Sources
This study has utilized databases and the ancestry approach as a data source. Several databases were used to collect data for this study, including ProQuest, CINAHL, PubMed, MEDLINE, PsycINFO, and Web Science. Each of these databases has offered insightful information related to PSC in healthcare. In addition to searching through databases, the ancestry approach has been followed by looking through the reference lists of relevant papers to find additional studies for our study.
2.2. Search Strategies
Choosing the appropriate keywords to utilize in published papers in healthcare is essential for maintaining effective search practices, see Table 1. The National Library of Medicine (NLM) established a system of categorization keywords known as Medical Subject Headings (MeSH), which is utilized to make keywords of literature searches more efficient and effective in healthcare publications [19]. Furthermore, associations between “safety culture” and “patient safety culture” with related terms in the literature will be explored by utilizing relevant databases and VOSviewer software (version 1.6.15), a tool for constructing and visualizing bibliometric networks [20].

Table 1.
The keywords employed in this review.
2.3. Eligibility Criteria
The eligibility criteria are designed to guide the selection of papers relevant to this review. Studies will be included in this study if they meet the following criteria: (a) research must be peer-reviewed; (b) published between 2010 and 2024 inclusive; (c) research must be conducted in a hospital setting; and (d) articles must be in English. In contrast, articles were excluded based on the following exclusion criteria: they are (a) not available in full text or open access; (b) do not assess PSC; (c) do not take place in a hospital setting; (d) do not use the HSOPSC 1.0 or 2.0 survey as main instrument; (e) do not report measurements (e.g., Average Positive Response Rate (PRR%) or means) for PSC dimensions or most of them; and (f) include book chapters, views, reports, or opinions. Articles are chosen for full-text reading based on inclusion and exclusion criteria, starting with the titles and moving on to abstracts. In the next step, the quality of the papers should be checked and rated after thoroughly reading the articles, which constitutes the final step of the exclusion criteria, ensuring the papers are suitable for study and avoid bias.
The selection of papers for this review went through several steps following the protocol of PRISMA 2020 [21], as illustrated in Figure 1. The flow diagram demonstrates the details in a structured and transparent manner. The initial studies were identified from databases searching 1154 sources, with the most entries coming from ProQuest 571, followed by PubMed 223, Web of Science 220, MEDLINE 64, CINAHL 59, and PsycINFO 17. The titles and article references were exported to Microsoft Excel so that the titles could be scanned, and duplicate references could be deleted, resulting in the removal of 488 records. The 666 titles and abstracts of papers were reviewed to ensure their relevance to the research question, and irrelevant titles and abstracts were removed, leaving 197 papers. After the scanning result sections, 99 papers were left for a full-text reading. Afterwards, 31 articles were excluded. The ancestry approach included seven studies, adding seven papers for the final number of included studies to be 75 research studies, as shown in Figure 1.
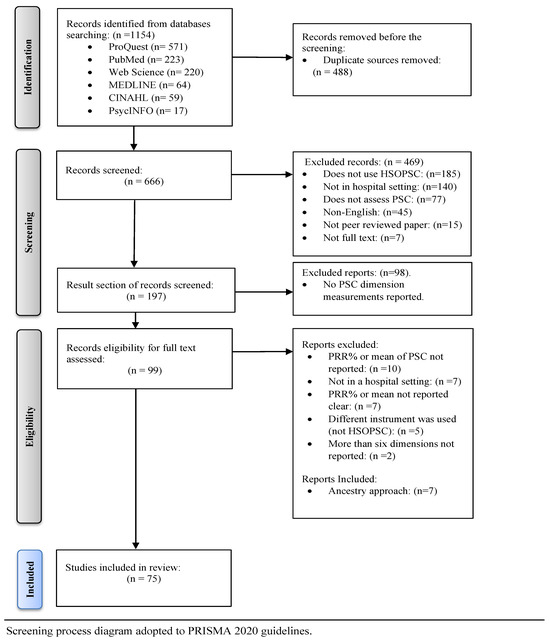
Figure 1.
Flow diagram of the scanning and selection process of studies.
Even the search of various databases yielded 1154 records; however, a total of 469 records were excluded for a variety of reasons, see Figure 1, including 185 that did not use HSOPSC; 140 that were not conducted in the hospital setting; 77 that did not assess PSC; 45 in non-English; 15 that were not peer-reviewed; and seven that did not have full-text availability. In addition, 98 reports were excluded for failing to report PSC dimension measurements for some reason, such as unclear reporting, using different instruments, and lacking required dimension details.
3. Result
3.1. Qualitative and Quantitative Data Extraction
The articles were considered by first author, publication year, continent, country, measurements (PRR% or mean), the 12 dimensions of patient safety culture for HSOSPC 1.0 presented in Supplementary Materials, and the ten dimensions and their Cronbach’s alpha for HSOSPC 2.0, as outlined in Table 2.
Table 2.
Quantitative data of articles used- HSOPSC 2.0.
3.2. The Term “Patient Safety” in the Literature
To investigate the prevalence of “safety culture” concepts in healthcare literature, a co-occurrence analysis was performed on titles and abstracts within the PubMed database and using VOSviewer software (version 1.6.15) [20]. The analysis of words frequently associated with “patient safety” provides valuable insights into the key themes researchers have addressed in this area, as illustrated in Figure 2. The thickness of the lines connecting the keywords in Figure 3 represents the strength of the relationships between patient safety, organizational culture, and its core components, such as leadership and communication.
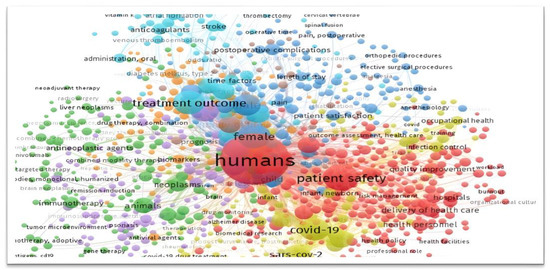
Figure 2.
Co-occurring terms associated with “patient safety” in research.
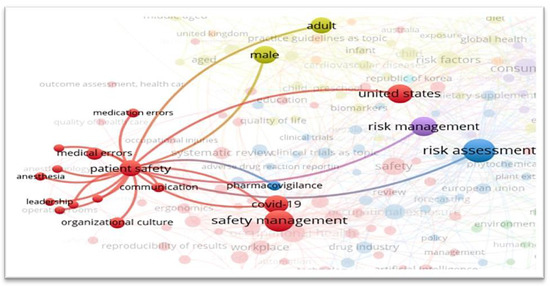
Figure 3.
Strength of relationships between “patient safety” and organizational culture.
3.3. General Characteristics of the Reviewed Studies
To achieve the study’s aim, this review explores key data extracted from included studies, including the use of HSOPSC Versions 1.0 and 2.0, geographical distribution across continents, hospital and respondent characteristics, and perceptions of Patient Safety Culture. By exploring these elements, the analysis will reveal regional variations and key factors influencing patient safety culture on a global scale.
Based on Supplementary Materials and Table 2, this review involved 75 studies from intercontinental locations. Fourteen studies from Europe covered multiple countries, including Croatia, Hungary, Spain [29], Sweden [29,30], Turkey [23,31,32], Slovenia [33], Italy [34], Portugal [35,36], Slovak Republic [37], Bulgaria [38], Romania [39,40], Scotland [41], and the Netherlands [42]. Nine studies from South America encompassed countries such as Brazil [27,43,44,45,46,47,48], Peru [49], and Portuguese [48], with one study covering Argentina, Brazil, Chile, and Colombia [50]. Ten studies from Africa involved countries like Ethiopia [51,52,53,54], Egypt [55,56,57,58], Algeria [59], Morocco [60], and Ghana [61]. One study had a global focus, including Taiwan, the Netherlands, and the United States [42]. Finally, 41 studies from Asia covered a range of countries including Lebanon [62], Oman [63,64,65], China [25,66,67,68,69], Saudi Arabia [26,70,71,72,73,74,75,76,77], Iran [78,79,80,81], Palestine [82,83], Kuwait [84], Jordan [56,85,86], Taiwan [42,87], Philippines [88], Korea [22,89], Pakistan [90], Qatar [91], Indonesia [24,92], Vietnam [93,94,95], Afghanistan [96], India [28], and Indonesia [92].
All 75 studies employed versions of the HSOPSC, either modified or translated, as their primary tool to evaluate PSC. These studies encompassed 2188 hospitals of various types, ranging from individual hospital settings to entire hospitals for national healthcare systems, such as the one examined in Sweden [30]. Most studies involved a mix of healthcare professionals. While 15 focused on nursing staff, 59 included a range of clinical and non-clinical workers. One study examined nurses and other providers separately. The studies included in this analysis were conducted from 2010 to the present year, 2024, with 22 studies conducted between 2010 and 2015, 26 between 2016 and 2020, and 27 from 2021 to 2024.
The majority of studies aimed to evaluate healthcare workers’ perceptions of PSC. Among them, some examined the validity of HSOPSC 1.0 [33,35], while others examined the adaptation and validation of HSOPSC 2.0 [22,23,24,25,27,28]. Additionally, certain studies focused on testing interventions [56,92]. Nearly all studies adopted a descriptive cross-sectional design involving various hospital settings or regions. However, some studies employed mixed methods [29,46,76], with only one utilizing a quasi-experimental approach [56].
3.3.1. The Hospital Survey on Patient Safety Culture Version 1.0 (HSOPSC 1.0)
A comprehensive overview of studies using HSOPSC 1.0 as the primary instrument for assessing PSC across various continents and countries is provided in Supplementary Materials. It highlights global efforts to understand the status of PSC and its enhancement within hospital settings.
This study reviewed several research studies conducted between 2010 and 2023, noting that more than 25 studies were conducted in the recent years of 2021, 2022, and 2023. The studies cover a wide range of geographical regions, including Asia, Europe, South America, and Africa, with countries such as Indonesia, Portugal, Iran, China, Brazil, Qatar, and others. Also, the study participants range from hundreds to over five thousand participants, with some highly exceeding this due to reliance on national data or agencies [26,30,42].
Supplementary Materials shows the scores of twelve PSC dimensions assessed through HSOPSC 1.0. These dimensions include Teamwork within units, Supervisor expectations and actions to promote patient safety, Organizational learning: continuous improvement, Management support for patient safety, Nonpunitive response to error, Feedback and communication about errors, Communication openness, Handoffs and transitions, Teamwork across units, Staffing, Frequency of events reported, and Overall perceptions of patient safety. The studies used two measures to reflect the level of PSC dimensions. The first measure was Mean ± Standard Deviation (M ± S), which relied on the Likert scale. The second measure was Positive Response Rate Percentage (PRR%), which ranged from 0 to 100. High values indicate stronger positive perceptions of patient safety within hospital settings and vice versa.
Our review of the studies revealed variations in methodology. Some studies employed surveys across multiple countries for comparison [29,48,50], or a comprehensive view [40], while others focused on data within hospital settings, with analysis periods ranging from two years [26,39,66,74] to four years [76]. Not all studies examined all 12 dimensions [39,59,61,63,69,89]; some used a modified HSOPSC instrument measuring most dimensions, but not all [60,89]. The PRR% measure was the most common, but some studies used mean and standard deviation [36,52,71,74,81,86,89,92], and only one used safety culture index percentage [47]. Additionally, certain studies published results for both pre- and post-intervention [56,92], while others investigated outcomes across different hospital settings [52,94].
3.3.2. The Hospital Survey on Patient Safety Culture Version 2.0 (HSOPSC 2.0)
Table 2 presents the studies that used the HSOPSC 2.0 as the primary assessment instrument to measure PSC in hospital settings. This study explored seven studies conducted between 2021 and 2024 across some continents, such as Asia, Europe, and South America, assessing the psychometric properties, reliability, and validity of the HSOPSC 2.0 tool in hospital settings of various countries like Korea, Turkey, Indonesia, China, Saudi Arabia, Brazil, and India. Besides evaluating the validity of the instrument, studies also provided the perspectives of hospital workers about PSC dimensions, including Teamwork, Staffing and Work Pace, Organizational Learning—Continuous Improvement, Response to Error, Supervisor Support, Communication About Errors, Communication Openness, Reporting Safety Events, Hospital Management Support, and Handoffs and Information Exchange.
The total number of participants in these studies ranged from 220 to 145,657. As shown in Table 2, the ten dimensions of PSC were measured with PRR% and its alpha value. Cronbach’s alpha (α) measures instrument coherence and consistency in psychometrics. It ranges from 0 to 1, with higher values indicating more excellent reliability [97]. The measure was used across the studies to assess the internal consistency of each dimension. For example, the study in Korea with 526 participants shows moderate to good reliability, particularly for Communication About Error (α = 0.83) [22]. Another study in Turkey reports moderate reliability, peaking at Communication Openness (α = 0.82) [23]. The study conducted in Indonesia, involving 1013 participants, did not report dimension scores but covered a reliability range from (α = 0.671 to 0.805) [24]. Insights from Wu’s study in China and Reis’s study in Brazil reveal variabilities in smaller and larger samples, with the latter indicating a reliability range from α = 0.47 to 0.87 [25,27]. Despite its extensive number of participants, Alaska’s study from Saudi Arabia lacks specific Cronbach’s alpha values [26]. The study from India, with 1603 respondents, highlighted high reliability in Communication Openness (α = 0.85) but a low in Handoffs and Information Exchange (α = 0.45) [28].
3.3.3. Geographical Study Characteristics across Continents
Figure 4 shows the number of studies and participants associated with each continent. This distribution reflects a broad geographical range of studies on PSC that utilized HSOPSC. In Europe, 37,933 participants were involved. South America had 12,026 participants, while Africa contributed with 3663 participants. In Asia, there were 41 studies, with one study covering multiple continents. These studies involved a total of 432,158 participants. Additionally, the United States contributed as part of the study covering mixed continents, which included 196,467 participants.
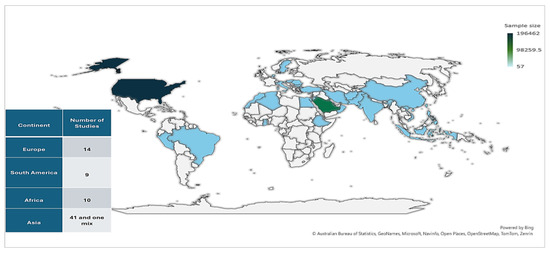
Figure 4.
The geographical distribution of studies and participants.
Figure 5 summarizes the number of surveys conducted per continent and country. Asia accounts for the highest number of surveys at 56, followed by Europe with 21, Africa with 11, and South America with nine. Within Europe, Romania has the most surveys at four, while several other European countries have only one survey each. South America’s data are dominated by Brazil, which has six surveys. A single survey includes four countries: Argentina, Brazil, Chile, and Colombia. In Africa, Ethiopia stands out with five surveys, more than any other African country listed, with Egypt following with three surveys. The remaining African nations show only one survey each. The Asian continent displays a wide distribution of surveys, with Saudi Arabia at the forefront with 15. Other notable counts include China, with six, and Iran, Indonesia, and Vietnam, each with five surveys. The remaining Asian countries have only one or two surveys. Figure 4 and Figure 5 are summaries of some categories of data extracted from the studies included in this research which are detailed in Supplementary Materials, Table 2 and Table 3.
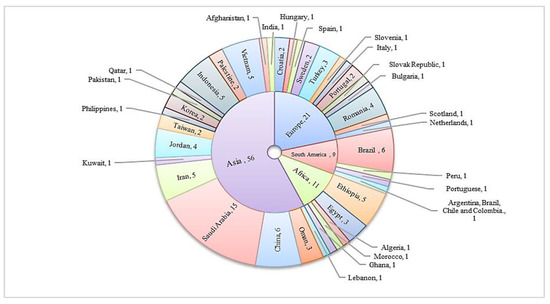
Figure 5.
Distributed surveys across continents and their countries.
Table 3.
Hospital types and responder characteristics of the review studies (n = 75).
3.3.4. Hospital and Respondent Characteristics of the Reviewed Studies
From review studies across multiple continents, including Europe, South America, North America, Africa, and Asia, Table 3 provides detailed data on hospital types and participant characteristics. It reveals that a total of 682,242 participants were involved in all studies. The studies also covered 2188 hospitals. Participants and hospitals from Asia account for 63.3% and 63.7% of the study participants, respectively. North America represents 29% of the hospitals and 29% of the participants. Europe follows with 5.6% of participants and 6.5% of hospitals. Africa and South America have the most minor representation; Africa contributes 0.5% of participants and 0.8% of hospitals, and South America has 1.8% of participants and 0.5% of hospitals.
Hospital types vary, alternating from university and public/governmental hospitals to private and tertiary hospitals. The review studies revealed that Asia dominates hospital types, with 36 university hospitals (2.6%), 66 public/governmental hospitals (4.7%), 11 private hospitals (0.8%), eight acute/general hospitals (0.6%), and all 26 tertiary hospitals (1.9%). Europe contributes with 12 public/governmental hospitals (8.4%), while South America and Africa report fewer hospitals. However, missing data was noteworthy, particularly in Europe (81.8%) and North America (100%).
A demographic analysis of participants indicated that nurses were the most common professionals participating, compared to other clinical and non-clinical staff. However, 93.8% of the education data was missing, indicating a gap in reporting. Gender data was also largely unreported, but where available, there were more female participants. Work hours data indicated that many participants, especially in Asia, worked over 40 h a week. Experience levels varied widely, but again, a large portion of this data was missing. Age data was similarly incomplete, though it suggested a slight predominance of participants over 35 years.
The ‘Missing’ category in Table 3 signifies data that were not reported or were unavailable across the review studies, and its presence is notable in several sections. Among the missing data, there were significant amounts of education levels (93.8%), genders (87.7%), working hours (43.8%), and ages (93.3%), while job positions (0.5%) and experience (28.3%) were better reported with fewer missing data.
The review studies reveal notable gaps in reporting across other continents. In particular, Europe, Asia, and South America have high levels of missing data in education, reported at 98.5%, 91.3%, and 86.4%, respectively, with similar issues in age and gender categories. Conversely, job position and experience data tend to be more reliably reported, with job positions showing the smallest percentage of missing data at just 0.5%. Although Africa and South America generally have fewer issues with data completeness, South America still has a gap in reporting ages and genders.
3.3.5. Exploring Perceptions of Patient Safety Culture across Continents
The studies compiled in Supplementary Materials reveal the widespread adoption of the HSOPSC 1.0 globally. Few studies have implemented the revised version, HSOPSC 2.0, which is currently being evaluated for its validity and adaptation in various hospital settings across countries. Some survey results were discarded, and data conforming to a uniform standard were collected for descriptive exploration, comparing and analyzing variability across different dimensions in study surveys. Therefore, only studies that used HSOPSC 1.0 were included in this section, as well as studies that used the average positive response rate percentage to measure PSC dimensions.
On the other hand, some surveys were excluded because they did not cover all dimensions [39,59,61,63,69,89], and some utilized a customized version of the HSOPSC instrument, which assessed only some dimensions [60,89]. Furthermore, some survey results were not included because they did not directly report the number of participants [40,56,66], and others that only used the mean and standard deviation (SD) as measurement values were also excluded [36,52,71,74,81,86,89,92]. Therefore, the remaining survey results were systematically organized by continents, countries, professionals, and the 12 dimensions response results, as shown in Table 4.
Table 4.
The average positive response rate percentage for PSC dimensions.
One of the main objectives of this study is to assess the strengths and weaknesses within various dimensions of PSC across the multiple studies included in this study. Regarding the evaluation of the survey results, a dimension was considered strong if 75% or more of the responses were positive, while dimensions showing more weakness had fewer than 50%. The range between these thresholds is considered acceptable, yet it necessitates further enhancement [98]. Standard deviation is calculated as a measure of dispersion around the average score of all dimensions that contribute to the overall PSC score. All 12 dimensions of PSC measures included in the survey are averaged up to create the overall perception of PSC, represented in the right column under the mean section in Table 4. Lower scores refer to areas for improvement, while higher scores indicate a more positive perception [13,14].
For example, in Vietnam, the perception of several healthcare professionals indicates the highest mean PRR% at 74.2% [93]. The highest disparity within survey dimensions was recorded at 25.6 [94]. However, the minimum mean PRR% of 35.4 was observed in a survey from Iran [78], while a low SD, averaging 7.2, was reported in a survey from Brazil, reflecting the perception of nurses [47].
As a summary of the previous table, Table 5 presents the perception of PSC across different continents and among different healthcare professionals, categorized into nurses and mixed staff. It displays the mean responses of each dimension across the surveys. The number of participants varied, ranging from 2513 in Africa to 279,750 in Asia. Regarding professionals, 6510 are nurses, and a mixed staff comprising 517,845 individuals. Mean response scores for the PSC dimensions reflect how positively the responders see each dimension. For example, the average score for D3 (Organizational learning: continuous improvement) is highest in Asia at 80%, indicating a more positive view of this aspect of PSC, while Dimension D5 (Nonpunitive response to error) scores lowest in South America at 27.5%. This resulted in an overall average positive response rate across all surveys and SD for each dimension, delivering an overall perception of PSC across continents, which was 55.3% ± 14.2%.
Table 5.
The mean average positive response percentage for PSC dimensions.
Figure 6 illustrates a comparison of continents’ and professionals’ mean response scores of each PSC dimension across all surveys with the mean of all. The difference between continents was noticeable compared to professionals. From Table 4, the descriptive analysis highlights variations in each dimension across all surveys. The highest mean score among dimensions was recorded at 73.4% for D3 (Organizational learning: continuous improvement) and D1 (Teamwork within units) with a score of 73.29%. Conversely, the lowest mean score for dimensions was 35.3% for D5 (Nonpunitive response to error). Furthermore, the highest disparity score was 19 for D4 (Management support for patient safety), while the lowest SD score was 11.4 for D7 (Communication openness).
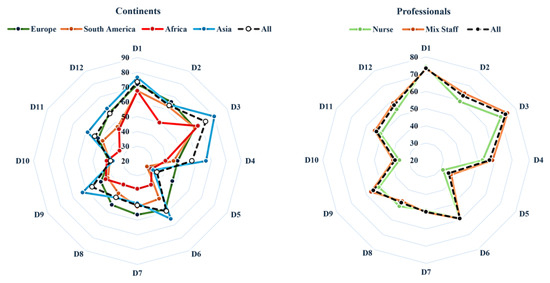
Figure 6.
Continents and professional mean scores of PSC dimension compared to a mean of all.
As shown in Figure 7, distinct patterns across various dimensions were observed. The interquartile ranges for dimensions D2 and D10 were narrower, suggesting relatively consistent responses. Dimensions D4 and D11, on the other hand, displayed more inconsistency around the mean, indicating a more diverse view of these dimensions. Interestingly, dimension D2 demonstrated the highest outliers, followed by D5, D12, D10, D8, and D7 in descending order. Compared to the normative responses, these outliers are noteworthy deviations, indicating that some studies reported the mean much better or less well.
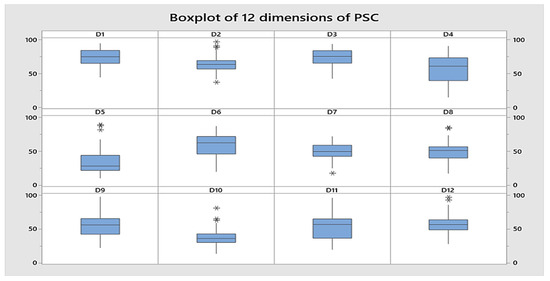
Figure 7.
Boxplot for 12 dimensions of PSC across all responses. *: Indicates dimensions of patient safety culture where some studies reported significantly high or low PRR%, including potential outliers.
3.3.6. Descriptive Exploration of Strength and Weakness Areas in PSC across Continents
In assessing the strengths and weaknesses of various dimensions across study surveys, a dimension was classified as strong when 75% or more of the average positive response rate percentage reflected positivity, indicating strength in that area and labeled with (h) in Table 4 and Table 5. Conversely, dimensions were considered weak if less than 50%, suggesting weak areas that required improvement, and were labeled with (l). The range of less than 75% to 50% represented an acceptable level, but it underscores the need for continued refinement and enhancement efforts [98].
Table 5 categorizes the mean PRR% of PCS dimensions across all surveys by continent and profession, classifying them as strengths, weaknesses, or moderate areas. According to continents, the areas considered weak in Europe were D4, D5, D9, and D10, with a range from 39.3% to 48.3%, resulting in 55.1% ± 12.6 the overall perception of PSC. The total number of participants in surveys from Europe was 35,676. Furthermore, the surveys conducted in South America, which included 9954 participants, yielded an overall PSC score of 49% ± 12.7. Weak areas were observed in D4–D6 and D8–D12, with response scores ranging from 27.5% to 49.5%. In addition, among the 2513 participants surveyed in Africa, weaknesses were noted in the D2 and D4–D12, ranging from 31% to 49.9%. The surveys yielded an overall PSC score of 44.5% ± 9.1. Moreover, the surveys conducted in Asia, which involved the highest number of participants from several countries with a total of 279,750, revealed weaknesses in the D5, D7, and D8 ranges, with response rates ranging from 32.5% to 48.6%. Strengths were noted in D1 and D3, with PRR% of 76.4% and 80%, respectively. The overall PSC score was 58.4% ± 13.5.
According to professionals, some studies have been conducted to evaluate healthcare workers’ perceptions regarding PSC. From the perspective of nurses, weak areas were identified in D5, D7, and D10, with mean PRR percentages of 31.4%, 49.4%, and 35.5%, respectively. However, surveys involving diverse professionals highlighted weaknesses, specifically in D5, D8, and D10, with mean PRR percentages of 36.9%, 47.6%, and 39.1%.
According to Table 5, when closely analyzing the dimensions of PSC, distinct differences within the survey results have emerged. Some surveys indicate strong areas within certain dimensions, while others reveal weaknesses. Additionally, several dimensions fall between the two extremes, indicating potential areas for enhancement. Table 6 gives a comprehensive summary of the frequency of survey results that have reported dimensions as either strong, weak, or moderate.
Table 6.
Summary of strengths and weaknesses dimensions across surveys.
Regarding Table 6, across all surveys, 35 surveys consistently reported D1 and D3 as strength areas, with most of them from Asia. However, weakness areas ranging from 46% to 83% of surveys in D5 and D10 were identified as weaknesses, highlighted by 58% and 59%, respectively, reported from all continents. Following these, 36% and 34% of surveys also noted D7 and D8 weaknesses. Lastly, in the scope of opportunity for improvement within the previous two categories, D2 and D12 were identified as moderate areas needing improvement, with 48 and 44 surveys, respectively (see Table 4).
Table 6 also summarizes weakness areas by continent and survey time period, highlighting weakness areas for each dimension of PSC. For continents, Europe (19%) in D10, South America (13%) in D5, all nine studies (9%) in Africa reported weakness in D9, and Asia (46%) in D5 and D10 have the highest percentages of participants reporting these areas as weakness. Looking at time periods, surveys conducted between 2010–2014 have the highest weakness in D5 (27%), followed by 2015–2019 with weakness in D5 and D10 (23%), and lastly, 2020–2023 with the highest weakness in D10 (36%).
On the other hand, the dimensions of strengths are also emphasized. Among continents, Europe (7%) in D1, South America (4%) in D1, and Asia (36% and 46%) in D1 and D3, respectively, show the strongest dimensions. When considering time periods, surveys conducted between 2010 and 2014 showed the highest strengths in dimensions D1 and D3, at 13% and 14%, respectively. This was followed by surveys conducted between 2015 and 2019, which also exhibited strong in D1 (19%) and D3 (13%). The most recent surveys, from 2020 to 2023, showed the strongest yet in D3 (27%), with D1 maintaining 19%.
4. Discussion
As a summary of key findings, the review of PSC highlights that Asia has the highest utilization of HSOPSC instruments, with 63.3% of participants and 63.7% of hospitals. Europe and South America have less representation, while Africa is the least represented. Nurses are the most frequently surveyed group. However, there are significant gaps in hospital and respondent characteristics data, particularly in education (93.8% missing), gender (87.7% missing), and age (93.3% missing). These omissions could potentially affect the overall analysis and our ability to gain a deep understanding of PSC.
Regarding the overall positive perception of PSC across continents, it stands at 55.3%. Asia demonstrates strengths in teamwork and organizational learning but shows weaknesses in responses to errors. Europe and South America exhibit notable weaknesses across multiple PSC dimensions.
Numerous developed countries have embarked on a journey characterized by strategic initiatives, systematic approaches, and collaborative efforts within their healthcare systems in pursuit of patient safety [99]. However, healthcare sectors worldwide, whether in developed or developing countries, encounter the common challenge of enhancing PSC [100]. In response to this challenge, healthcare providers are working to create supportive environments that empower staff to understand and implement this critical concept effectively [99,101]. By assessing PSC, an organization becomes aware of the various aspects of patient safety that need to be addressed. It also allows hospitals and healthcare providers to identify their organizational culture’s strengths and weaknesses in terms of patient safety, as well as any existing problems [13,15,16]. Hence, this study contributed to assessing variations in PSC dimensions across continents and professions based on geographical and temporal factors, using studies that employed the HSOPSC. The findings offered valuable insights into the strengths and weaknesses of PSC dimensions, highlighting areas for targeted improvement within global healthcare systems. This review has discerned that the predominant approach among various countries in assessing patient safety culture involves using the HSOPSC 1.0, which was widely acknowledged for its adaptability and efficacy [37]. The utilization of the HSOPSC 2.0 tool is relatively limited in studies, and mainly employed to check the tool’s adaptation and validation in a different cultural context. Avoiding the fact that some studies showed low scores in internal consistency in some dimensions [27,28], it could be the promise of a fairer and improved measurement instrument for assessing PSC in the future [102].
The studies covered in this review primarily focused on cross-sectional assessments of perception, with limited exploration of interventions or psychometric tool analyses. Furthermore, according to a demographic analysis, participants were predominantly nurses, females, working over 40 h a week, and having more than ten years of experience. Notably, the reviewed studies lacked information regarding hospitals and respondents’ characteristics. This omission could result in a less comprehensive view and reduced transparency in viewpoints, ultimately leading to inconsistencies among studies on safety culture. For example, one study utilized secondary data from 2008 data from the HSOPSC Comparative Database [42]. This database is notable for its comprehensive detail and the multitude of factors it contains. However, the study merely presented the average positive responses for the United States, overlooking other pertinent factors. This absence underscores the significance of reporting, as reviewed in Table 3, which highlights a substantial data loss.
4.1. A Global Perspective of PSC
Mian findings showed that the means of the responses for the different dimensions of PSC across all continents were 55.3%, ranging from 35.3% to 73.4%. This underscores the necessity for focused enhancements in healthcare systems worldwide to bolster patient safety. It is clear that the current state of hospital patient safety systems falls considerably short of meeting the recommendations outlined by the IOM [1]. Research conducted in Europe revealed a mean overall patient safety score of 55.1%. This does not seem consistent with a positive safety culture, which could be the result of national culture or prevailing health policies that permit variation in health system structures [29]. Similarly, in South America, the overall score was found to be 49%, aligning with recent study findings [103]. However, Africa displayed the lowest rate among continents, at 44.5%, underlining the necessity for urgent intervention, potentially stemming from insufficient human resources, budget, and leadership [104]. Conversely, Asia demonstrated the highest overall rate at 58.4%, though there is room for improvement to reach satisfactory levels [105,106].
4.2. Strengths and Weaknesses of Patient Safety Culture
There was consistency in the identification of “Teamwork within units” and “Organizational Learning: Continuous Improvement” as strengths of PSC across continents. Most responses from Asian studies reported these dimensions as strengths of their healthcare systems, while few studies in Europe, South America, and Africa did so. Strong scores in Teamwork within units indicate that healthcare providers globally value collaboration for patient safety. Effective teamwork improves communication, coordination, and decision-making, leading to better patient outcomes [107,108]. Similarly, strong “Organizational Learning: Continuous Improvement” scores reflect a faithful commitment to continually learning from errors and implementing improvements [109]. This proactive approach is vital for identifying and addressing safety concerns, and mitigating the risk of adverse events. Therefore, the increasing demand and complexity of healthcare services make this vital. Patient safety and treatment experiences need continuous improvement through innovative solutions. Instead of aiming for “as few things as possible go wrong,” we should strive for “as many things as possible go right.” Inspired by Hollnagel [110], this approach emphasizes the importance of everyone within the healthcare system working together to create a safe environment. It aligns perfectly with the idea of strong teamwork within units and the continuous improvement that comes from organizational learning.
However, the consistent emergence of “Non-punitive Response to Error” and “Staffing” as weaknesses across continents presents a significant challenge to healthcare systems worldwide. Low scores in “Non-punitive Response to Error” suggest a potential fear of punishment for reporting errors. Encouraging a non-punitive approach towards errors in healthcare settings can help alleviate the fear of punishment linked to reporting mistakes [110,111]. This fear blocks open communication and hinders efforts to identify and address safety issues. A lack of blame-free environments conducive to honest reporting of errors is a persistent problem in healthcare.
Therefore, promoting a “Just Culture” is required, which values learning over assigning blame and empowers healthcare providers to report errors freely, enabling ongoing improvement and ultimately enhancing patient safety [110,112]. Moreover, implementing a patient safety incident reporting system should positively impact PSC [113]. Furthermore, inadequate staffing levels could be the main reason for receiving a low score in the “Staffing” dimension, which can directly impact the quality and safety of patient care. An understaffed or overworked environment may result in compromised worker well-being, lowered standards, and a higher risk of errors [85,114]. These findings are also highlighted in other studies [115,116].
Considering the time, previous studies have thoroughly examined both the strength and weakness dimensions of PSC. Recent research emphasized that these aspects persist, indicating that the ongoing challenges in addressing weaknesses and enhancing them have yet to be effectively overcome.
4.3. The Global Nurses’ Perspective on PSC
The nursing profession plays a critical role in keeping patients safe, since positive work environments and nurses’ knowledge influence patients’ experiences [117]. The study reviewed several studies conducted exclusively on nurses. Based on the view of 6510 workers, nurses’ perceptions of the culture of patient safety generally tended to be moderate, with the exception of three specific dimensions. The lowest was “Non-punitive Response to Error,” while the next was “Staffing,” which allied with mixed professionals’ mean response scores as weakness areas. The third observation was in “Communication Openness.” The findings suggest a possible standard level of communication inherent in many healthcare environments, illustrating the importance of open communication in enhancing patient safety, promoting effective teamwork, and facilitating error reporting [118].
5. Limitations and Future Research Directions
This study has several limitations. Only the articles that utilized the HSOPSC as the main instrument were included, leading to the exclusion of other tools used to assess patient safety culture, as well as studies conducted in non-hospital settings. This may limit the scope of the findings across other healthcare environments and measurement approaches. The differences in cultural background, or how studies are conducted, as well as the weight of each study, were not considered. The analysis was applied to the studies that had PRR% as the main measure. The scanning process was influenced by the English language inclusion criterion, which excluded papers from East Asian countries like South Korea and China, and Spanish-language papers from South America. Even though this analysis provides an overview of the state of PSC across different countries, the analysis relied on 70 surveys, which might not represent all countries globally.
In terms of future work, this study offers several recommendations. To advance research on PSC fields, studies should be detailed and adhere to AHRQ guidelines [102]. Establishing a standardized protocol for conducting PSC research is recommended to facilitate comparisons. The differences found in PSC scores across continents imply that customized improvement strategies may be needed for each region. To gain a deeper understanding of the evolution of patent safety culture, a comprehensive analysis should be conducted over time in order to improve the quality of healthcare outcomes, follow trends, identify the factors that influence patient safety, and apply interventions based on evidence. Although the HSOPSC instrument is widely utilized on a global scale, there is a notable lack of studies employing this instrument within the Australian healthcare context, suggesting the need for future research to address this gap.
6. Conclusions
In conclusion, ensuring patient safety is crucial in healthcare structures. The IOM emphasizes the importance of a safety-oriented culture in healthcare organizations to protect patients, reduce errors, promote worker well-being, and improve care quality. Several organizations have taken steps to address patient safety concerns, including the WHO’s Global Patient Safety Action Plan and the AHRQ’s HSOPSC for assessing PSC.
This systematic review used rigorous methodology to examine PSC across international hospitals, focusing on research from 2010 to 2024. The HSOPSC tool (version 1.0 or 2.0) provided consistent data collection, while the PRISMA guidelines ensured a transparent and replicable search strategy.
Data from over 75 studies revealed PSC variations across continents, with Africa showing the lowest average scores, highlighting the need for targeted interventions. While teamwork and continuous learning were global strengths, common weaknesses included non-punitive error responses and staffing issues. Nurses, in particular, reported lower positive views on communication openness and staffing. To address these challenges, a holistic approach is needed to strengthen PSC, including fostering a just culture, addressing staffing shortages, and promoting open communication. Tailored strategies, such as regular safety briefings, encouraging error reporting without blame, continuous training, and leadership support, can improve patient safety and healthcare quality worldwide.
Supplementary Materials
The following supporting information can be downloaded at: https://www.mdpi.com/article/10.3390/app14188496/s1.
Author Contributions
H.A.: methodology and writing, including the original draft and revisions; W.K.: conceptualization, writing (review and revisions), editing, and supervision. All authors have read and agreed to the published version of the manuscript.
Funding
The UCF College of Engineering and Computer Science provided article processing charges on 18 September 2024.
Institutional Review Board Statement
Not applicable.
Acknowledgments
The use of Zotero for managing and maintaining references throughout this work is acknowledged. For proofreading purposes, Google Gemini, Grammarly, and ChatGPT were utilized to enhance the clarity, flow, and simplification of complex sentences within the text.
Conflicts of Interest
The authors declare no conflict of interest.
References
- Institute of Medicine. To Err Is Human: Building a Safer Health System; National Academies Press: Washington, DC, USA, 2000; p. 9728. [Google Scholar] [CrossRef]
- World Health Organization. The Conceptual Framework for the International Classification for Patient Safety. Available online: https://www.who.int/publications/i/item/WHO-IER-PSP-2010.2 (accessed on 25 April 2024).
- World Health Organization. Patient Safety. Available online: https://www.who.int/news-room/fact-sheets/detail/patient-safety (accessed on 7 March 2024).
- Medicine and America. Crossing the Quality Chasm: A New Health System for the 21st Century; National Academies Press: Washington, DC, USA, 2001; p. 10027. [Google Scholar] [CrossRef]
- World Health Organization. Global Patient Safety Action Plan 2021–2030. Available online: https://www.who.int/publications/i/item/9789240032705 (accessed on 7 March 2024).
- Slawomirski, L.; Auraaen, A.; Klazinga, A.; Klazinga, N. The Economics of Patient Safety: Strengthening a Value-Based Approach to Reducing Patient Harm at National Level; OECD Health Working Papers 96; OECD: Paris, France, 2017. [Google Scholar] [CrossRef]
- Health and Safety Commission Advisory Committee. Organizing for safety. In Third Report of the ACSNI (Advisory Committee on the Safety of Nuclear Installations) Study Group on Human Factors; HSE Books: Sudbury, UK, 1993. [Google Scholar]
- Runciman, W.; Hibbert, P.; Thomson, R.; Van Der Schaaf, T.; Sherman, H.; Lewalle, P. Towards an International Classification for Patient Safety: Key concepts and terms. Int. J. Qual. Health Care 2009, 21, 18–26. [Google Scholar] [CrossRef] [PubMed]
- Lee, S.E.; Scott, L.D.; Dahinten, V.S.; Vincent, C.; Lopez, K.D.; Park, C.G. Safety Culture, Patient Safety, and Quality of Care Outcomes: A Literature Review. West. J. Nurs. Res. 2019, 41, 279–304. [Google Scholar] [CrossRef] [PubMed]
- Mosadeghrad, A.M. Healthcare service quality: Towards a broad definition. Int. J. Health Care Qual. Assur. 2013, 26, 203–219. [Google Scholar] [CrossRef] [PubMed]
- Azyabi, A.; Karwowski, W.; Davahli, M.R. Assessing Patient Safety Culture in Hospital Settings. IJERPH 2021, 18, 2466. [Google Scholar] [CrossRef] [PubMed]
- Bartonickova, D.; Kalankova, D.; Ziakova, K. How to Measure Patient Safety Culture? A Literature Review of Instruments. Acta Medica Martiniana 2021, 21, 69–79. [Google Scholar] [CrossRef]
- Sorra, J.; Nieva, V.F. Hospital Survey on Patient Safety Culture; Agency for Healthcare Research and Quality: Rockville, MD, USA, 2004. [Google Scholar]
- Agency for Healthcare Research and Quality. Hospital Survey on Patient Safety Culture. Available online: https://www.ahrq.gov/sops/surveys/hospital/index.html (accessed on 13 January 2024).
- Gershon, R.R.; Karkashian, C.D.; Grosch, J.W.; Murphy, L.R.; Escamilla-Cejudo, A.; Flanagan, P.A.; Bernacki, E.; Kasting, C.; Martin, L. Hospital safety climate and its relationship with safe work practices and workplace exposure incidents. Am. J. Infect. Control 2000, 28, 211–221. [Google Scholar] [CrossRef]
- Scott, T.; Mannion, R.; Marshall, M.; Davies, H. Does organisational culture influence health care performance? A review of the evidence. J. Health Serv. Res. Policy 2003, 8, 105–117. [Google Scholar] [CrossRef]
- Agency for Healthcare Research and Quality. What Is Patient Safety Culture? Available online: https://www.ahrq.gov/sops/about/patient-safety-culture.html (accessed on 25 April 2024).
- Moher, D.; Liberati, A.; Tetzlaff, J.; Altman, D.G.; The PRISMA Group. Preferred Reporting Items for Systematic Reviews and Meta-Analyses: The PRISMA Statement. PLoS Med. 2009, 6, e1000097. [Google Scholar] [CrossRef]
- National Library of Medicine. MeSH—NCBI. Available online: https://www.ncbi.nlm.nih.gov/mesh (accessed on 25 April 2024).
- Van Eck, N.J.; Waltman, L. Visualizing Bibliometric Networks. In Measuring Scholarly Impact; Ding, Y., Rousseau, R., Wolfram, D., Eds.; Springer International Publishing: Cham, Switzerland, 2014; pp. 285–320. [Google Scholar] [CrossRef]
- Page, M.J.; McKenzie, J.E.; Bossuyt, P.M.; Boutron, I.; Hoffmann, T.C.; Mulrow, C.D.; Shamseer, L.; Tetzlaff, J.M.; Akl, E.A.; Brennan, S.E.; et al. The PRISMA 2020 statement: An updated guideline for reporting systematic reviews. BMJ 2021, 372, 71. [Google Scholar] [CrossRef]
- Lee, S.E.; Dahinten, V.S. Adaptation and validation of a Korean-language version of the revised hospital survey on patient safety culture (K-HSOPSC 2.0). BMC Nurs. 2021, 20, 12. [Google Scholar] [CrossRef]
- Filiz, E.; Yeşildal, M. Turkish adaptation and validation of revised Hospital Survey on Patient Safety Culture (TR—HSOPSC 2.0). BMC Nurs. 2022, 21, 325. [Google Scholar] [CrossRef] [PubMed]
- Suryani, L.; Letchmi, S.; Said, F.B.M. Cross-culture adaptation and validation of the Indonesian version of the Hospital Survey on Patient Safety Culture (HSOPSC 2.0). Belitung Nurs. J. 2022, 8, 169–175. [Google Scholar] [CrossRef] [PubMed]
- Wu, Y.; Hua, W.; Zhu, D.; Onishi, R.; Yang, Y.; Hasegawa, T. Cross-cultural adaptation and validation of the Chinese version of the revised surveys on patient safety cultureTM (SOPS®) hospital survey 2.0. BMC Nurs. 2022, 21, 369. [Google Scholar] [CrossRef] [PubMed]
- Alaska, Y.A.; Alkutbe, R.B. What Do We Know About Patient Safety Culture in Saudi Arabia? A Descriptive Study. J. Patient Saf. 2023, 19, 517–524. [Google Scholar] [CrossRef] [PubMed]
- Reis, C.T.; Laguardia, J.; Andreoli, P.B.d.A.; Júnior, C.N.; Martins, M. Cross-cultural adaptation and validation of the Hospital Survey on Patient Safety Culture 2.0—Brazilian version. BMC Health Serv. Res. 2023, 23, 32. [Google Scholar] [CrossRef]
- Aileen, J.; Pushpanjali, K.; Federico, F.; Joseph, L.; Manjunath, U. Psychometric Analysis of the Indian Version of the Patient Safety Culture Tool (I-HSOPSC 2.0) Validation. J. Health Manag. 2024, 26, 109–115. [Google Scholar] [CrossRef]
- Granel-Giménez, N.; Palmieri, P.A.; Watson-Badia, C.E.; Gómez-Ibáñez, R.; Leyva-Moral, J.M.; Bernabeu-Tamayo, M.D. Bernabeu-Tamayo. Patient Safety Culture in European Hospitals: A Comparative Mixed Methods Study. Int. J. Environ. Res. Public Health 2022, 19, 939. [Google Scholar] [CrossRef]
- Danielsson, M.; Nilsen, P.; Rutberg, H.; Årestedt, K. A National Study of Patient Safety Culture in Hospitals in Sweden. J. Patient Saf. 2019, 15, 328–333. [Google Scholar] [CrossRef]
- Güneş, Ü.Y.; Gürlek, Ö.; Sönmez, M. A survey of the patient safety culture of hospital nurses in Turkey. Collegian 2016, 23, 225–232. [Google Scholar] [CrossRef]
- Top, M.; Tekingündüz, S. Patient Safety Culture in a Turkish Public Hospital: A Study of Nurses’ Perceptions About Patient Safety. Syst. Pract. Action Res. 2015, 28, 87–110. [Google Scholar] [CrossRef]
- Robida, A. Hospital Survey on Patient Safety Culture in Slovenia: A psychometric evaluation. Int. J. Qual. Health Care 2013, 25, 469–475. [Google Scholar] [CrossRef] [PubMed]
- Bagnasco, A.; Tibaldi, L.; Chirone, P.; Chiaranda, C.; Panzone, M.S.; Tangolo, D.; Aleo, G.; Lazzarino, L.; Sasso, L. Patient safety culture: An Italian experience. J. Clin. Nurs. 2011, 20, 1188–1195. [Google Scholar] [CrossRef] [PubMed]
- Eiras, M.; Escoval, A.; Grillo, I.M.; Silva-Fortes, C. The hospital survey on patient safety culture in Portuguese hospitals: Instrument validity and reliability. Int. J. Health Care Qual. Assur. 2014, 27, 111–122. [Google Scholar] [CrossRef]
- Brás, C.P.D.C.; Ferreira, M.M.C.; Figueiredo, M.D.C.A.B.D.; Duarte, J.C. Patient safety culture in nurses’ clinical practice. Rev. Latino-Am. Enfermagem 2023, 31, e3837. [Google Scholar] [CrossRef]
- Kalankova, D.; Bartonickova, D.; Ziakova, K.; Gurkova, E.; Kurucova, R. Assessment of the Safety Climate at University Hospitals in the Slovak Republic from the Nurses’ Perspective. Acta Medica Martiniana 2020, 20, 27–38. [Google Scholar] [CrossRef]
- Stoyanova, R.; Dimova, R.; Tornyova, B.; Mavrov, M.; Elkova, H. Perception of patient safety culture among hospital staff. Slov. J. Public Health 2021, 60, 97–104. [Google Scholar] [CrossRef]
- Tereanu, C.; Noll, A. Trends in the Staff’s Perception of Patient Safety Culture in Romanian Hospitals. Curr. Health Sci. J. 2020, 3, 236–243. [Google Scholar] [CrossRef]
- Tereanu, C.; Ghelase, M.S. Measuring Patient Safety Culture in Romania Using the Hospital Survey on Patient Safety Culture (HSOPSC). Curr. Health Sci. J. 2017, 1, 31–40. [Google Scholar] [CrossRef]
- Agnew, C.; Flin, R.; Mearns, K. Patient safety climate and worker safety behaviours in acute hospitals in Scotland. J. Saf. Res. 2013, 45, 95–101. [Google Scholar] [CrossRef]
- Wagner, C.; Smits, M.; Sorra, J.; Huang, C.C. Assessing patient safety culture in hospitals across countries. Int. J. Qual. Health Care 2013, 25, 213–221. [Google Scholar] [CrossRef]
- Gil Prates, C.; Caregnato, R.C.A.; de Magalhães, A.M.M.; Pai, D.D.; Urbanetto, J.d.S.; de Moura, G.M.S.S. Evaluation of patient safety culture in a private general hospital: A case study in Brazil. IJHCQA 2021, 34, 110–121. [Google Scholar] [CrossRef] [PubMed]
- Galvão, T.F.; Lopes, M.C.C.; Oliva, C.C.C.; Araújo, M.E.d.A.; Silva, M.T. Patient safety culture in a university hospital. Rev. Lat.-Am. Enferm. 2018, 26, e3014. [Google Scholar] [CrossRef] [PubMed]
- Okuyama, J.H.H.; Galvão, T.F.; Crozatti, M.T.L.; Silva, M.T. Health professionals’ perception of patient safety culture in a university hospital in São Paulo: A cross-sectional study applying the Hospital Survey on Patient Safety Culture. Sao Paulo Med. J. 2019, 137, 216–222. [Google Scholar] [CrossRef]
- Passos, A.C.d.B.; dos Santos, D.B.; Fonteles, M.M.d.F. Patient Safety Culture: From Perception to Assessment. JYP 2021, 13, 291–297. [Google Scholar] [CrossRef]
- Tavares, A.P.M.; Moura, E.C.C.; Avelino, F.V.S.D.; Lopes, V.C.A.; Nogueira, L.T. Patient safety culture from the perspective of the nursing team. Rev. Rene 2018, 19, 3152. [Google Scholar] [CrossRef]
- Fassarella, C.S.; Camerini, F.G.; Henrique, D.d.M.; de Almeida, L.F.; Figueiredo, M.D.C.B. Evaluation of patient safety culture: Comparative study in university hospitals. Rev. Esc. Enferm. USP 2018, 52, e03379. [Google Scholar] [CrossRef]
- Arrieta, A.; Suarez, G.; Hakim, G. Assessment of patient safety culture in private and public hospitals in Peru. Int. J. Qual. Health Care 2018, 30, 186–191. [Google Scholar] [CrossRef]
- Pedroso, A.C.; Fernandes, F.P.; Tuma, P.; Vernal, S.; Pellizzari, M.; Seisdedos, M.G.; Prieto, C.; Wilckens, B.O.; Villamizar, O.J.S.; Olaya, L.A.C.; et al. Patient safety culture in South America: A cross-sectional study. BMJ Open Qual. 2023, 12, e002362. [Google Scholar] [CrossRef] [PubMed]
- Ayisa, A.; Getahun, Y.; Yesuf, N. Patient Safety Culture and Associated Factors Among Health-Care Providers in the University of Gondar Comprehensive Specialized Hospital, Northwest Ethiopia. DHPS 2021, 13, 141–150. [Google Scholar] [CrossRef]
- Ayanaw, T.; Worede, E.A.; Alemayehu, M.; Worku, W.; Abere, G.; Betew, B.D. Patient safety culture and associated factors among health care providers in government and private hospitals, Bahir Dar City Northwest, Ethiopia, 2022: A comparative cross-sectional study. BMC Health Serv. Res. 2023, 23, 765. [Google Scholar] [CrossRef]
- Mekonnen, A.B.; McLachlan, A.J.; Brien, J.-A.E.; Mekonnen, D.; Abay, Z. Hospital survey on patient safety culture in Ethiopian public hospitals: A cross-sectional study. Saf. Health 2017, 3, 11. [Google Scholar] [CrossRef]
- Kumbi, M.; Hussen, A.; Lette, A.; Nuriye, S.; Morka, G. Patient Safety Culture and Associated Factors Among Health Care Providers in Bale Zone Hospitals, Southeast Ethiopia: An Institutional Based Cross-Sectional Study. DHPS 2020, 12, 1–14. [Google Scholar] [CrossRef] [PubMed]
- Aboul-Fotouh, A.; Ismail, N.; Elarab, H.E.; Wassif, G. Assessment of patient safety culture among healthcare providers at a teaching hospital in Cairo, Egypt. East. Mediterr. Health J. 2012, 18, 372–377. [Google Scholar] [CrossRef]
- AbuAlRub, R.F.; Abu Alhijaa, E.H. The Impact of Educational Interventions on Enhancing Perceptions of Patient Safety Culture Among Jordanian Senior Nurses: Patient Safety Culture. Nurs. Forum 2014, 49, 139–150. [Google Scholar] [CrossRef]
- El-Sherbiny, N.A.; Ibrahim, E.H.; Abdel-Wahed, W.Y. Assessment of patient safety culture among paramedical personnel at general and district hospitals, Fayoum Governorate, Egypt. J. Egypt. Public Health Assoc. 2020, 95, 4. [Google Scholar] [CrossRef]
- Ali, H.M.A.; Abdul-Aziz, A.M.; Darwish, E.A.F.; Swelem, M.S.; Sultan, E.A. Assessment of patient safety culture among the staff of the University Hospital for Gynecology and Obstetrics in Alexandria, Egypt. J. Egypt. Public Health Assoc. 2022, 97, 20. [Google Scholar] [CrossRef]
- Boughaba, A.; Aberkane, S.; Fourar, Y.-O.; Djebabra, M. Study of safety culture in healthcare institutions: Case of an Algerian hospital. IJHCQA 2019, 32, 1081–1097. [Google Scholar] [CrossRef]
- Fassi, C.F.; Mourajid, Y.; Chahboune, M.; Hilali, A. Patient Safety Culture Perception among Moroccan Healthcare professionals: Cross-Sectional Study in Public Hospitals. Ethiop. J. Health Sci. 2023, 33, 2. [Google Scholar] [CrossRef] [PubMed]
- Abuosi, A.A.; Akologo, A.; Anaba, E.A. Determinants of patient safety culture among healthcare providers in the Upper East Region of Ghana. J. Patient Saf. Risk Manag. 2020, 25, 35–43. [Google Scholar] [CrossRef]
- El-Jardali, F.; Jaafar, M.; Dimassi, H.; Jamal, D.; Hamdan, R. The current state of patient safety culture in Lebanese hospitals: A study at baseline. Int. J. Qual. Health Care 2010, 22, 386–395. [Google Scholar] [CrossRef]
- Alrahbi, H.H.; Al-Toqi, S.K.; Sony, S.; Al-Abri, N. Assessment of Patient Safety Culture among Healthcare Providers. GJHS 2020, 13, 59. [Google Scholar] [CrossRef]
- Ammouri, A.; Tailakh, A.; Muliira, J.; Geethakrishnan, R.; Al Kindi, S. Patient safety culture among nurses. Int. Nurs. Rev. 2015, 62, 102–110. [Google Scholar] [CrossRef] [PubMed]
- Al-Mandhari, A.; Al-Zakwani, I.; Al-Kindi, M.; Tawilah, J.; Dorvlo, A.S.; Al-Adawi, S. Patient Safety Culture Assessment in Oman. Oman Med. J. 2014, 29, 264–270. [Google Scholar] [CrossRef]
- Hao, H.-S.; Gao, H.; Li, T.; Zhang, D. Assessment and Comparison of Patient Safety Culture Among Health-Care Providers in Shenzhen Hospitals. RMHP 2020, 13, 1543–1552. [Google Scholar] [CrossRef]
- Zhong, X.; Song, Y.; Dennis, C.; Slovensky, D.J.; Wei, L.Y.; Chen, J.; Ji, J. Patient safety culture in Peking University Cancer Hospital in China: Baseline assessment and comparative analysis for quality improvement. BMC Health Serv. Res. 2019, 19, 1008. [Google Scholar] [CrossRef]
- He, H.; Chen, X.; Tian, L.; Long, Y.; Li, L.; Yang, N.; Tang, S. Perceived patient safety culture and its associated factors among clinical managers of tertiary hospitals: A cross-sectional survey. BMC Nurs. 2023, 22, 329. [Google Scholar] [CrossRef] [PubMed]
- Nie, Y.; Mao, X.; Cui, H.; He, S.; Li, J.; Zhang, M. Hospital survey on patient safety culture in China. BMC Health Serv. Res. 2013, 13, 228. [Google Scholar] [CrossRef]
- Alahmadi, H.A. Assessment of patient safety culture in Saudi Arabian hospitals. BMJ Qual. Saf. 2010, 19, e17. [Google Scholar] [CrossRef]
- Hazazi, M.A.; Qattan, A.M.N. Exploring Strength Areas of Patient Safety Culture Improvement in KAMC, Makkah, Saudi Arabia. AJNR 2020, 9, 20–28. [Google Scholar] [CrossRef]
- Aboshaiqah, A.E.; Baker, O.G. Assessment of Nurses’ Perceptions of Patient Safety Culture in a Saudi Arabia Hospital. J. Nurs. Care Qual. 2013, 28, 272–280. [Google Scholar] [CrossRef]
- Al-Awa, B.; Al Mazrooa, A.; Rayes, O.; El Hati, T.; Devreux, I.; Al-Noury, K.; Habib, H.; El-Deek, B.S. Benchmarking the post-accreditation patient safety culture at King Abdulaziz University Hospital. Ann. Saudi Med. 2012, 32, 143–150. [Google Scholar] [CrossRef] [PubMed]
- Alswat, K.; Abdalla, R.A.M.; Titi, M.A.; Bakash, M.; Mehmood, F.; Zubairi, B.; Jamal, D.; El-Jardali, F. Improving patient safety culture in Saudi Arabia (2012–2015): Trending, improvement and benchmarking. BMC Health Serv. Res. 2017, 17, 516. [Google Scholar] [CrossRef]
- El-Jardali, F.; Sheikh, F.; A Garcia, N.; Jamal, D.; Abdo, A. Patient safety culture in a large teaching hospital in Riyadh: Baseline assessment, comparative analysis and opportunities for improvement. BMC Health Serv. Res. 2014, 14, 122. [Google Scholar] [CrossRef]
- Titi, M.A.; Baksh, M.M.; Zubairi, B.; Abdalla, R.A.M.; Alsaif, F.A.; Amer, Y.S.; Jamal, D.; El-Jardali, F. Staying ahead of the curve: Navigating changes and maintaining gains in patient safety culture—A mixed-methods study. BMJ Open 2021, 11, e044116. [Google Scholar] [CrossRef]
- Alquwez, N.; Cruz, J.P.; Almoghairi, A.M.; Al-Otaibi, R.S.; Almutairi, K.O.; Alicante, J.G.; Colet, P.C. Nurses’ Perceptions of Patient Safety Culture in Three Hospitals in Saudi Arabia. J. Nurs. Sch. 2018, 50, 422–431. [Google Scholar] [CrossRef] [PubMed]
- Moussavi, F.; Moghri, J.; Gholizadeh, Y.; Karami, A.; Najjari, S.; Mehmandust, R.; Asghari, M.; Asghari, H. Assessment of patient safety culture among personnel in the hospitals associated with Islamic Azad University in Tehran in 2013. Electron. Physician 2013, 5, 664–671. [Google Scholar] [CrossRef] [PubMed]
- Bahrami, M.A.; Chalak, M.; Montazeralfaraj, R.; Tafti, A.D. Iranian Nurse Association Perception of Patient Safety Culture. Iran. Red. Crescent Med. J. 2014, 16, 4. [Google Scholar] [CrossRef]
- Davoodi, R.; Shabestari, M.M.; Takbiri, A.; Soltanifar, A.; Sabouri, G.; Rahmani, S.; Moghiman, T. Patient Safety Culture Based on Medical Staff Attitudes in Khorasan Razavi Hospitals, Northeastern Iran. Iran. J. Public. Health 2013, 42, 1292–1298. [Google Scholar]
- Majidi, S.A.; Fakoorfard, Z.; Safarmohammadi, H.; Leily, E.K. The Relationship between Moral Intelligence and Patient Safety Culture in Nurses. J. Caring Sci. 2023, 12, 241–247. [Google Scholar] [CrossRef]
- Hamdan, M.; Saleem, A.A. Assessment of patient safety culture in Palestinian public hospitals. Int. J. Qual. Health Care 2013, 25, 167–175. [Google Scholar] [CrossRef]
- Zabin, L.M.; Abu Zaitoun, R.S.; Abdullah, A.A. Patient safety culture in Palestine: University hospital nurses’ perspectives. BMC Nurs. 2022, 21, 204. [Google Scholar] [CrossRef] [PubMed]
- Ali, H.; Ibrahem, S.Z.; Al Mudaf, B.; Al Fadalah, T.; Jamal, D.; El-Jardali, F. Baseline assessment of patient safety culture in public hospitals in Kuwait. BMC Health Serv. Res. 2018, 18, 158. [Google Scholar] [CrossRef] [PubMed]
- Khater, W.; Akhu-Zaheya, L.; Al-Mahasneh, S.; Khater, R. Nurses’ perceptions of patient safety culture in J ordanian hospitals. Int. Nurs. Rev. 2015, 62, 82–91. [Google Scholar] [CrossRef]
- Mrayyan, M.T. Predictors and outcomes of patient safety culture: A cross-sectional comparative study. BMJ Open Qual. 2022, 11, e001889. [Google Scholar] [CrossRef]
- Chen, I.-C.; Li, H.-H. Measuring patient safety culture in Taiwan using the Hospital Survey on Patient Safety Culture (HSOPSC). BMC Health Serv. Res. 2010, 10, 152. [Google Scholar] [CrossRef]
- Ramos, R.R.; Calidgid, C.C. Patient safety culture among nurses at a tertiary government hospital in the Philippines. Appl. Nurs. Res. 2018, 44, 67–75. [Google Scholar] [CrossRef]
- Cho, S.M.; Choi, J. Patient Safety Culture Associated With Patient Safety Competencies Among Registered Nurses. J. Nurs. Sch. 2018, 50, 549–557. [Google Scholar] [CrossRef] [PubMed]
- Hameed, S.; Humayun, A.; Yaqoob, M.; Rehm, M.H. Patient Safety Culture: A Healthcare Provider’s Prospect. Cureus 2023, 15, e49989. [Google Scholar] [CrossRef]
- Abdulla, M.A.; Habas, E.; Al Halabi, A.; Hassan, M.; Sohail, F.; Alajmi, J.; Ghazouani, H. An Evaluation of Healthcare Safety Culture Among Healthcare Professionals in Secondary and Tertiary Public Hospitals in the Middle East Region. Cureus 2023, 15, e35299. [Google Scholar] [CrossRef]
- Wijaya, M.I.; Mohamad, A.R.; Hafizurrachman, M. Shift schedule realignment and patient safety culture. IJHCQA 2020, 33, 145–157. [Google Scholar] [CrossRef]
- Tran, L.H.; Pham, Q.T.; Nguyen, D.H.; Tran, T.N.H.; Bui, T.T.H. Assessment of Patient Safety Culture in Public General Hospital in Capital City of Vietnam. Health Serv. Insights 2021, 14, 117863292110363. [Google Scholar] [CrossRef] [PubMed]
- Thu, N.T.H.; Anh, B.T.M.; Ha, N.T.T.; Tien, D.N.T.; Giang, P.H.; Nga, T.T.; Nam, N.H.; Hung, P.T. Health staff perceptions of patient safety and associated factors in hospitals in Vietnam. Front. Public Health 2023, 11, 1149667. [Google Scholar] [CrossRef] [PubMed]
- Luong, Q.D. Assessing the Perceptions of the Health Care Workforce Toward the Patient Safety Culture in Vietnamese Hospitals. Int. Surg. 2019, 104, 590–607. [Google Scholar] [CrossRef]
- Jabarkhil, A.Q.; Tabatabaee, S.S.; Jamali, J.; Moghri, J. Assessment of Patient Safety Culture Among Doctors, Nurses, and Midwives in a Public Hospital in Afghanistan. RMHP 2021, 14, 1211–1217. [Google Scholar] [CrossRef]
- Tavakol, M.; Dennick, R. Making sense of Cronbach’s alpha. Int. J. Med. Educ. 2011, 2, 53–55. [Google Scholar] [CrossRef]
- Reis, C.T.; Paiva, S.G.; Sousa, P. The patient safety culture: A systematic review by characteristics of Hospital Survey on Patient Safety Culture dimensions. Int. J. Qual. Health Care 2018, 30, 660–677. [Google Scholar] [CrossRef]
- Johnson, M.O. The Shifting Landscape of Health Care: Toward a Model of Health Care Empowerment. Am. J. Public Health 2011, 101, 265–270. [Google Scholar] [CrossRef]
- Longo, D.R.; Hewett, J.E.; Ge, B.; Schubert, S. The Long Road to Patient Safety: A Status Report on Patient Safety Systems. JAMA 2005, 294, 2858. [Google Scholar] [CrossRef]
- Gottlieb, L.N.; Gottlieb, B.; Bitzas, V. Creating Empowering Conditions for Nurses with Workplace Autonomy and Agency: How Healthcare Leaders Could Be Guided by Strengths-Based Nursing and Healthcare Leadership (SBNH-L). JHL 2021, 13, 169–181. [Google Scholar] [CrossRef]
- Agency for Healthcare Research and Quality, Rockville, MD. Hospital Survey Version 2.0: Background and Information for Translators. Available online: https://www.ahrq.gov/sops/international/hospital/translators-version-2.html (accessed on 5 July 2024).
- Camacho-Rodríguez, D.E.; Carrasquilla-Baza, D.A.; Dominguez-Cancino, K.A.; Palmieri, P.A. Patient Safety Culture in Latin American Hospitals: A Systematic Review with Meta-Analysis. IJERPH 2022, 19, 14380. [Google Scholar] [CrossRef]
- Oleribe, O.E.; Momoh, J.; Uzochukwu, B.S.; Mbofana, F.; Adebiyi, A.; Barbera, T.; Williams, R.; Robinson, S.D.T. Identifying Key Challenges Facing Healthcare Systems In Africa And Potential Solutions. IJGM 2019, 12, 395–403. [Google Scholar] [CrossRef] [PubMed]
- Behzadifar, M.; Behzadifar, M.; Jahanpanah, F.; Bragazzi, N.L. Patient safety culture assessment in Iran using the ‘Hospital survey on patient safety culture’ tool: A systematic review and meta-analysis. Clin. Epidemiol. Glob. Health 2019, 7, 641–647. [Google Scholar] [CrossRef]
- Kang, S.; Ho, T.T.T.; Lee, N.-J. Comparative Studies on Patient Safety Culture to Strengthen Health Systems Among Southeast Asian Countries. Front. Public Health 2021, 8, 600216. [Google Scholar] [CrossRef]
- O’Daniel, M.; Rosenstein, A. Professional Communication and Team Collaboration. In Patient Safety and Quality: An Evidence-Based Handbook for Nurses; Hughes, R.G., Ed.; Agency for Healthcare Research and Quality (US): Rockville, MD, USA, 2008; Chapter 33. Available online: https://www.ncbi.nlm.nih.gov/books/NBK2637/ (accessed on 5 July 2024).
- Rosen, M.A.; DiazGranados, D.; Dietz, A.S.; Benishek, L.E.; Thompson, D.; Pronovost, P.J.; Weaver, S.J. Teamwork in healthcare: Key discoveries enabling safer, high-quality care. Am. Psychol. 2018, 73, 433–450. [Google Scholar] [CrossRef] [PubMed]
- De Long, D.W.; Fahey, L. Diagnosing cultural barriers to knowledge management. AMP 2000, 14, 113–127. [Google Scholar] [CrossRef]
- Marx, D. Patient Safety and the ‘Just Culture’: A Primer for Health Care Executives; Report for Columbia University under a grant provided by the National Heart; Lung and Blood Institute: Bethesda, MD, USA, 2001. [Google Scholar]
- Sorra, J.; Nieva, V.; Fastman, B.R.; Kaplan, H.; Schreiber, G.; King, M. Staff attitudes about event reporting and patient safety culture in hospital transfusion services. Transfusion 2008, 48, 1934–1942. [Google Scholar] [CrossRef]
- Copeland, D. Targeting the Fear of Safety Reporting on a Unit Level. JONA: J. Nurs. Adm. 2019, 49, 121–124. [Google Scholar] [CrossRef]
- Kuosmanen, A.; Tiihonen, J.; Repo-Tiihonen, E.; Eronen, M.; Turunen, H. Changes in patient safety culture: A patient safety intervention for Finnish forensic psychiatric hospital staff. J. Nurs. Manag. 2019, 27, 848–857. [Google Scholar] [CrossRef]
- Lasater, K.B.; Aiken, L.H.; Sloane, D.M.; French, R.; Martin, B.; Reneau, K.; Alexander, M.; McHugh, M.D. Chronic hospital nurse understaffing meets COVID-19: An observational study. BMJ Qual. Saf. 2021, 30, 639–647. [Google Scholar] [CrossRef]
- Aiken, L.H.; Cerón, C.; Simonetti, M.; Lake, E.T.; Galiano, A.; Garbarini, A.; Soto, P.; Bravo, D.; Smith, H.L. Hospital nurse staffing and patient outcomes. Rev. Médica Clínica Las Condes 2018, 29, 322–327. [Google Scholar] [CrossRef]
- You, L.-M.; Aiken, L.H.; Sloane, D.M.; Liu, K.; He, G.-P.; Hu, Y.; Jiang, X.-L.; Li, X.-M.; Liu, H.-P.; Shang, S.-M.; et al. Hospital nursing, care quality, and patient satisfaction: Cross-sectional surveys of nurses and patients in hospitals in China and Europe. Int. J. Nurs. Stud. 2013, 50, 154–161. [Google Scholar] [CrossRef] [PubMed]
- Kutney-Lee, A.; McHugh, M.D.; Sloane, D.M.; Cimiotti, J.P.; Flynn, L.; Neff, D.F.; Aiken, L.H. Nursing: A Key To Patient Satisfaction: Patients’ reports of satisfaction are higher in hospitals where nurses practice in better work environments or with more favorable patient-to-nurse ratios. Health Aff. 2009, 28 (Suppl. 3), w669–w677. [Google Scholar] [CrossRef] [PubMed]
- Mazurenko, O.; Richter, J.; Swanson-Kazley, A.; Ford, E. Examination of the relationship between management and clinician agreement on communication openness, teamwork, and patient satisfaction in the US hospitals. JHA 2016, 5, 20. [Google Scholar] [CrossRef]
Disclaimer/Publisher’s Note: The statements, opinions and data contained in all publications are solely those of the individual author(s) and contributor(s) and not of MDPI and/or the editor(s). MDPI and/or the editor(s) disclaim responsibility for any injury to people or property resulting from any ideas, methods, instructions or products referred to in the content. |
© 2024 by the authors. Licensee MDPI, Basel, Switzerland. This article is an open access article distributed under the terms and conditions of the Creative Commons Attribution (CC BY) license (https://creativecommons.org/licenses/by/4.0/).