

Analysis of the Load-Bearing Capacity of Pebble Aggregates

Abstract
1. Introduction
2. Numerical Simulations of the Randomly Shaped Pebbles
2.1. DEM-Based Shape Reconstruction Method for Irregularly Shaped Pebbles
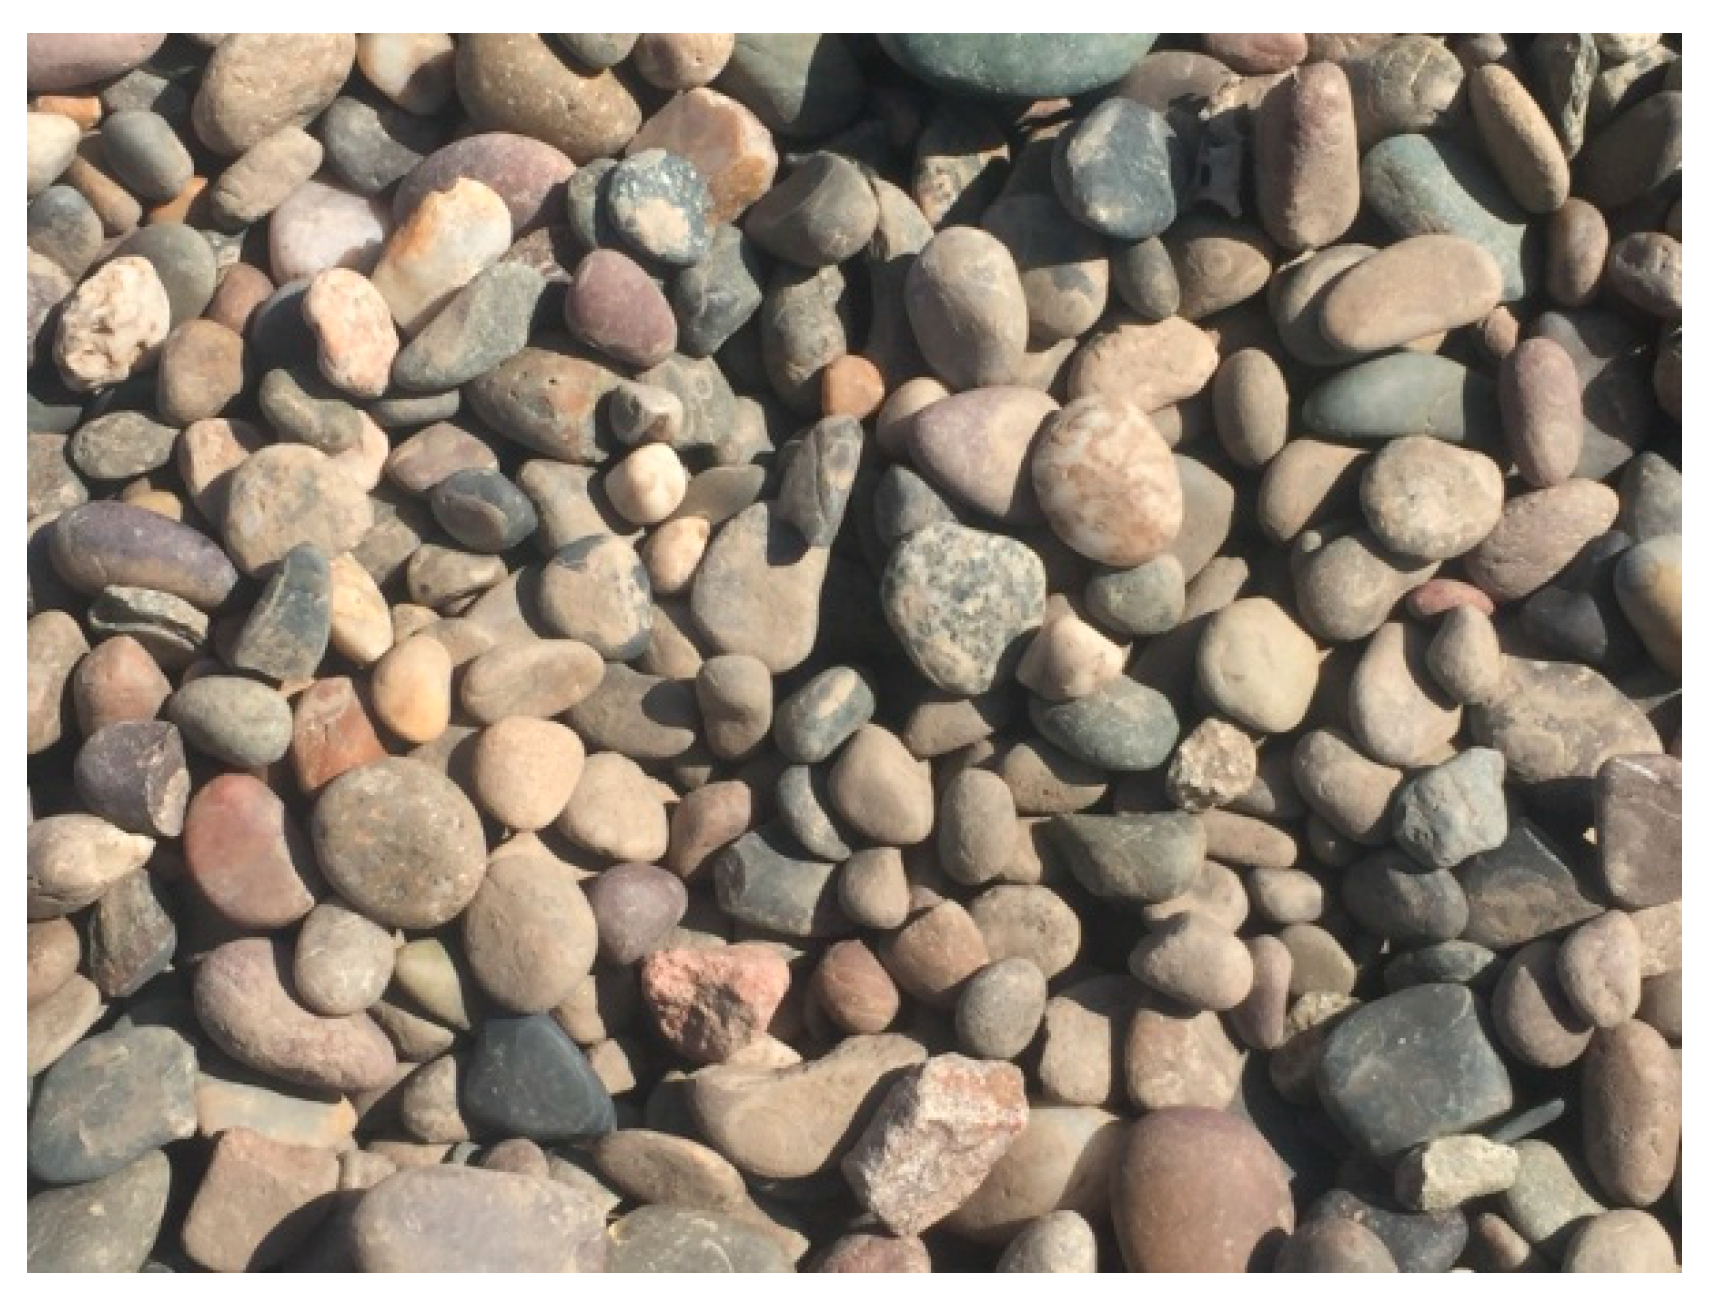
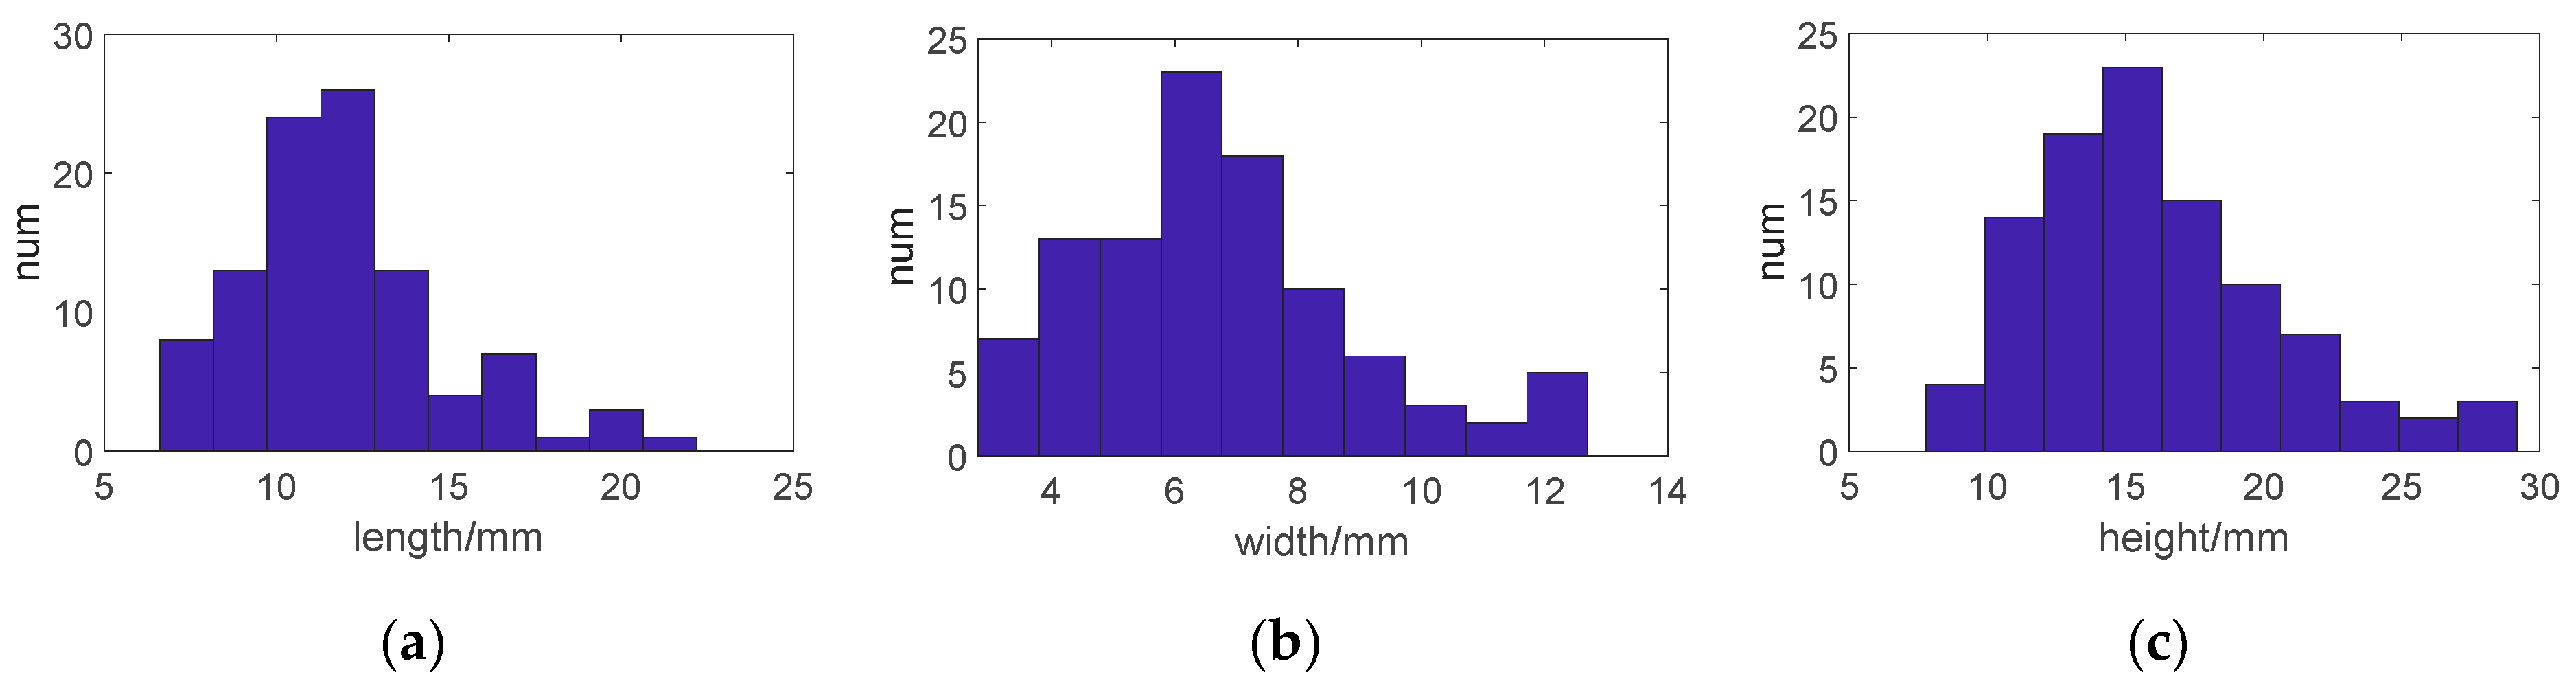
2.1.1. Materials
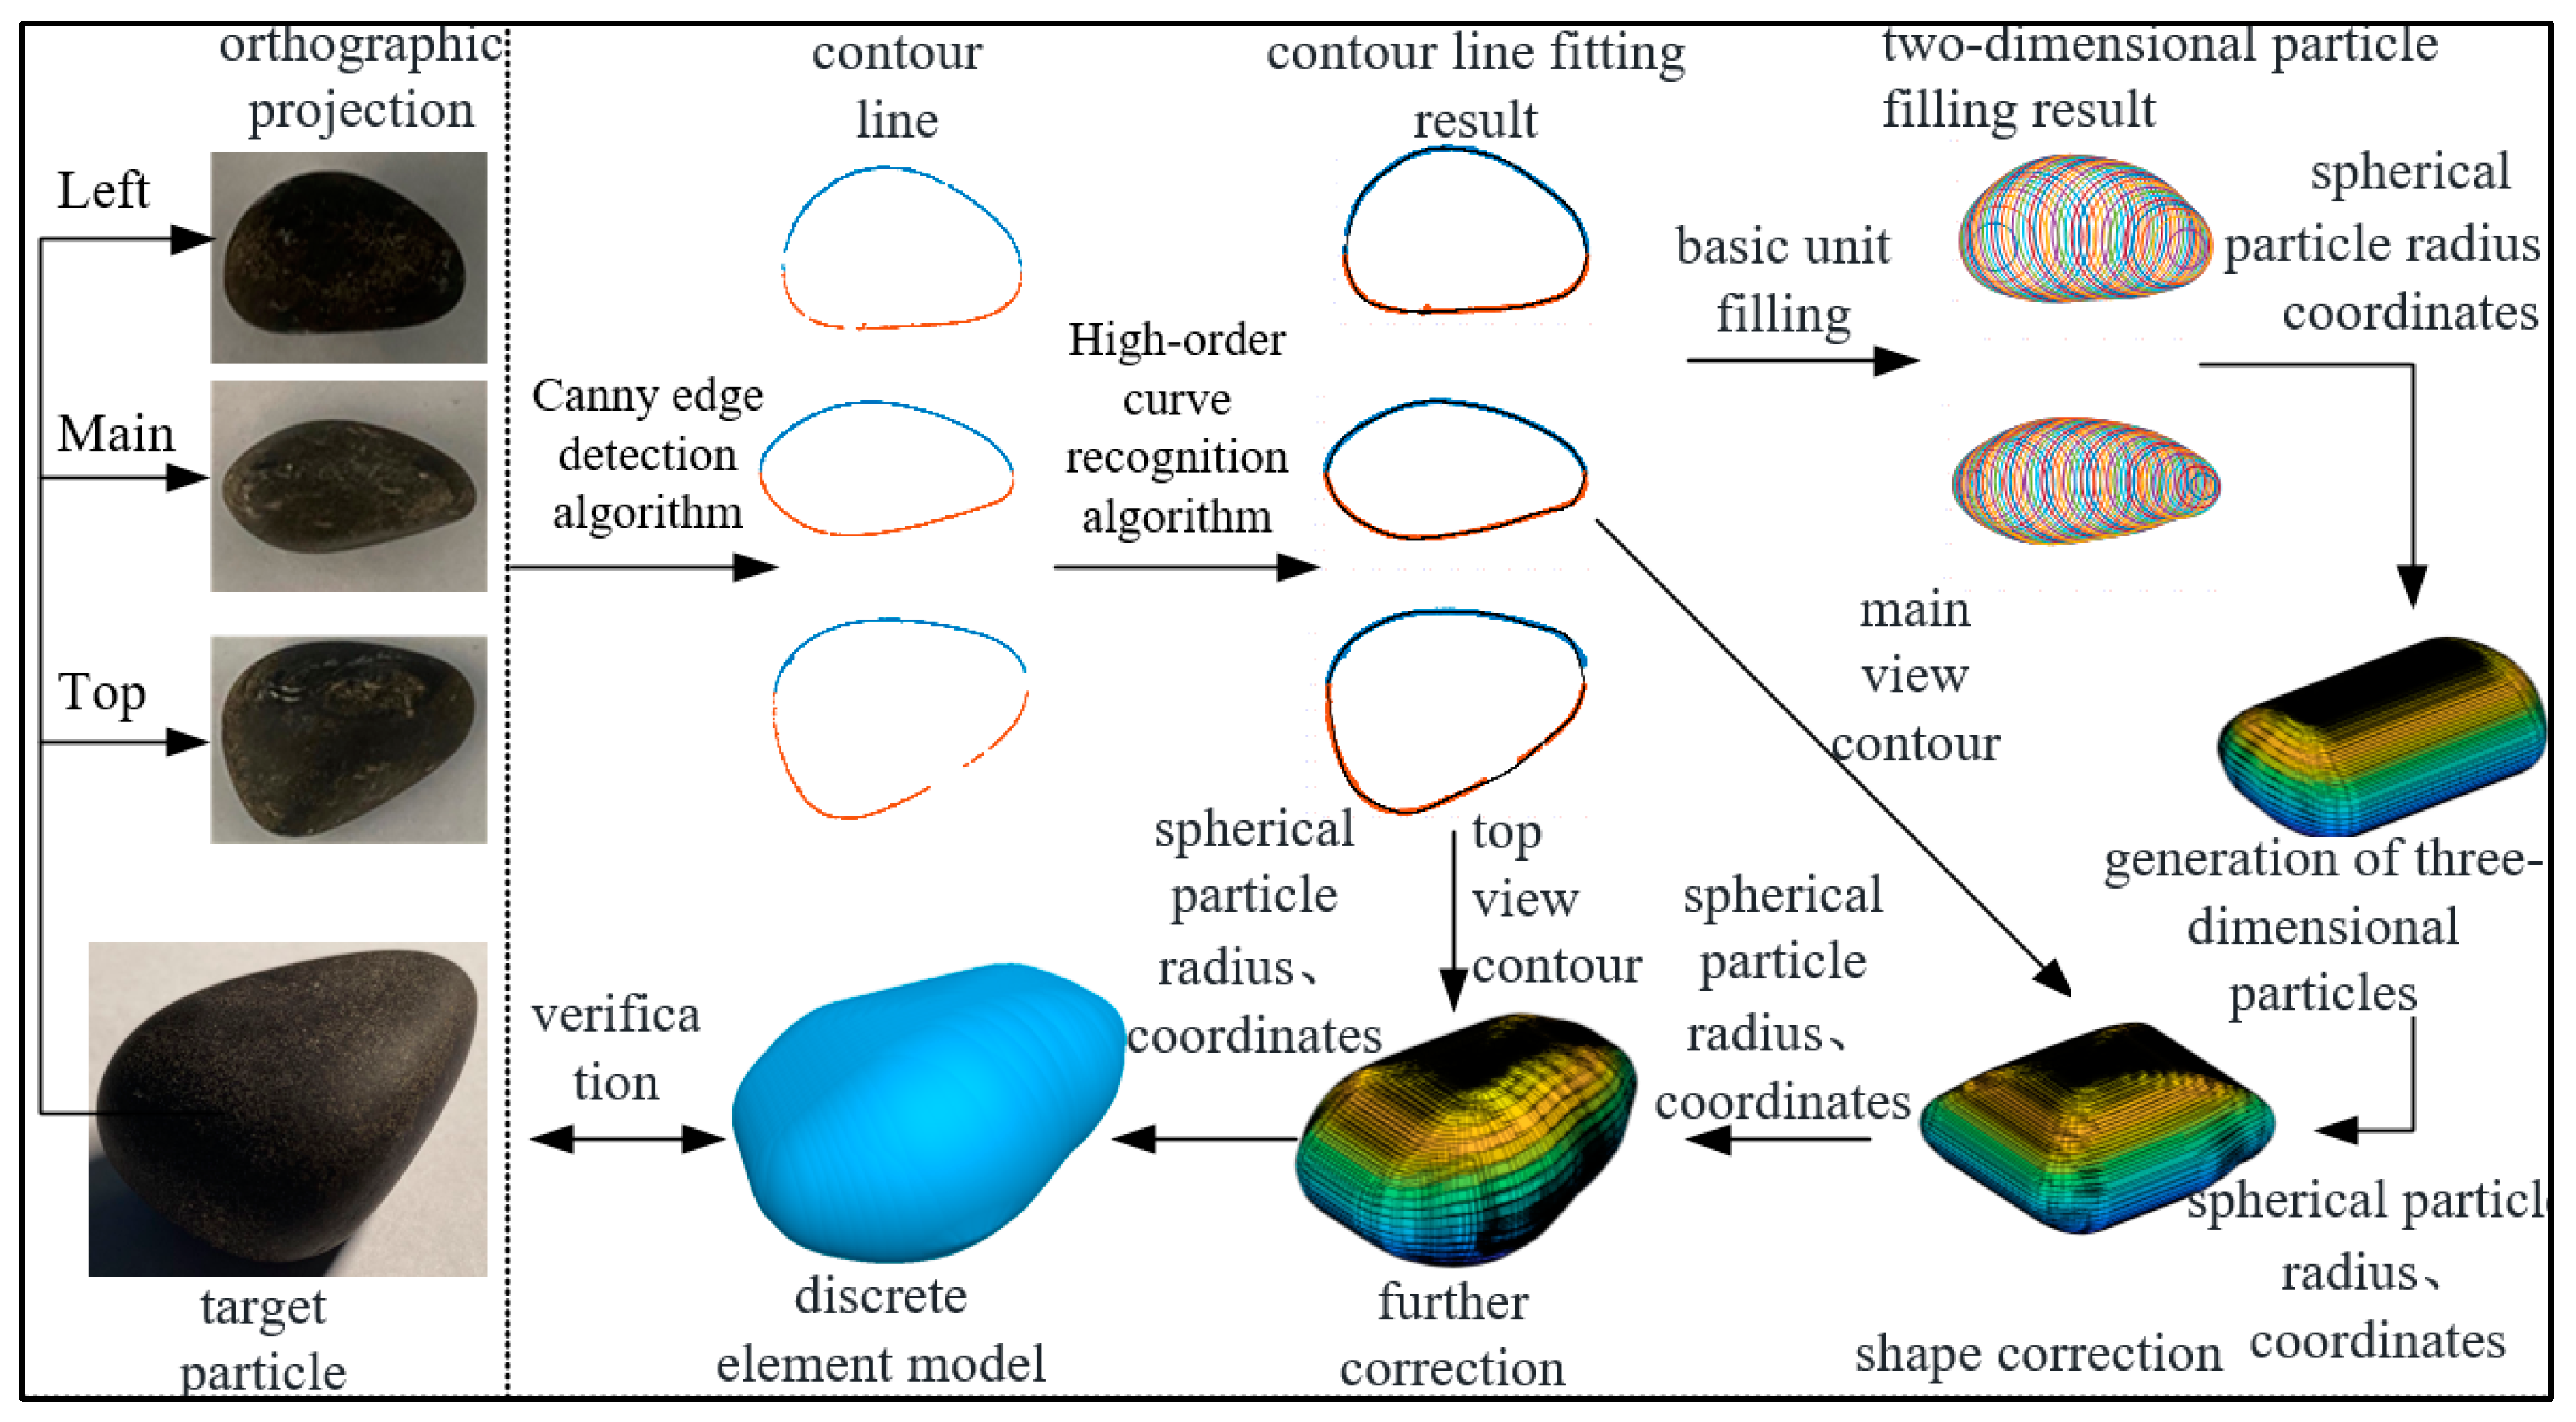
2.1.2. Shape Reconstruction Method for the Irregularly Shaped Pebbles
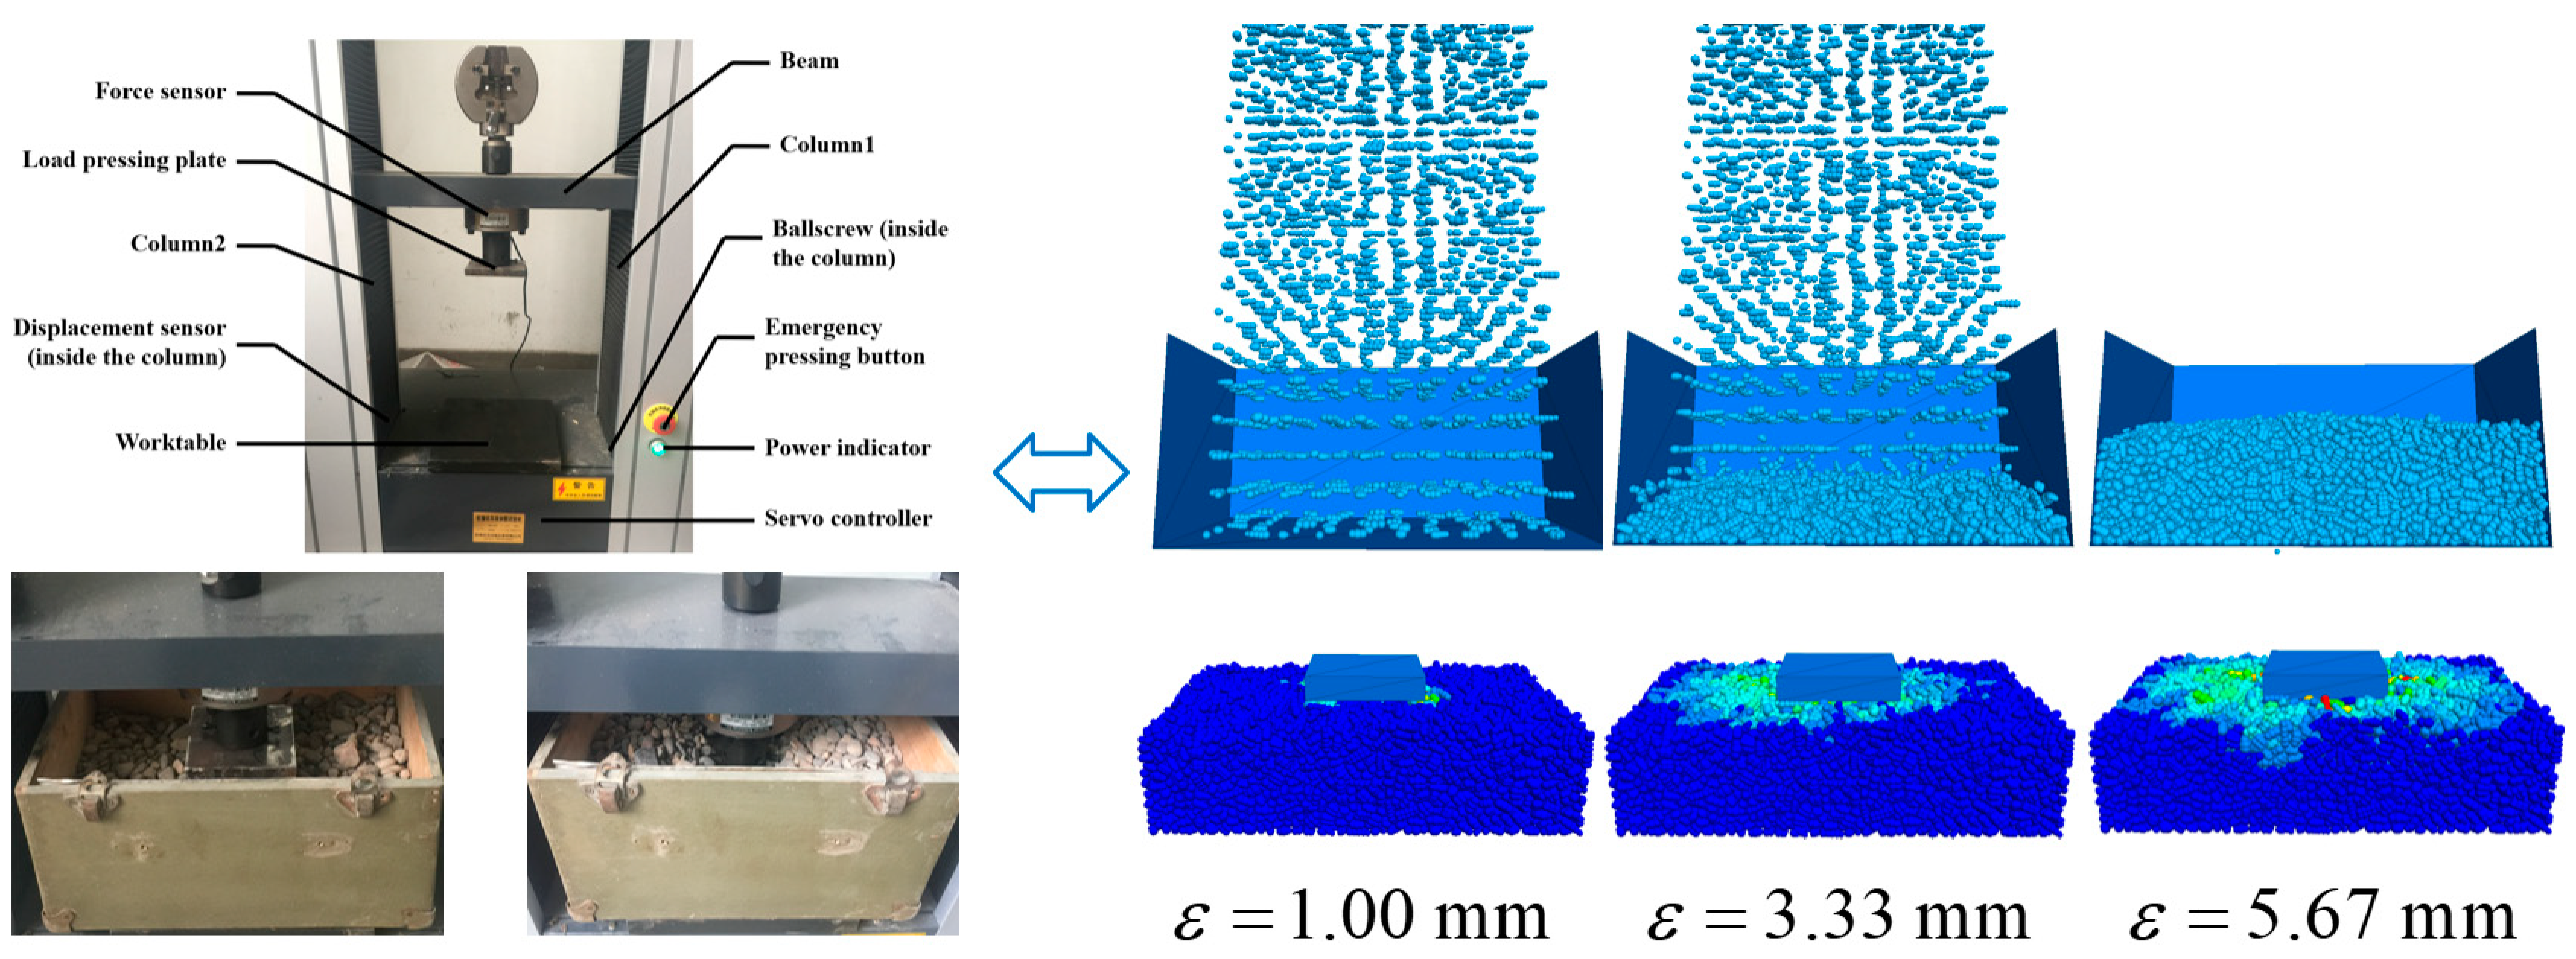
2.2. Pebble DEM Model Parameter Calibration and Model Validation
3. Simulation Results and Analysis
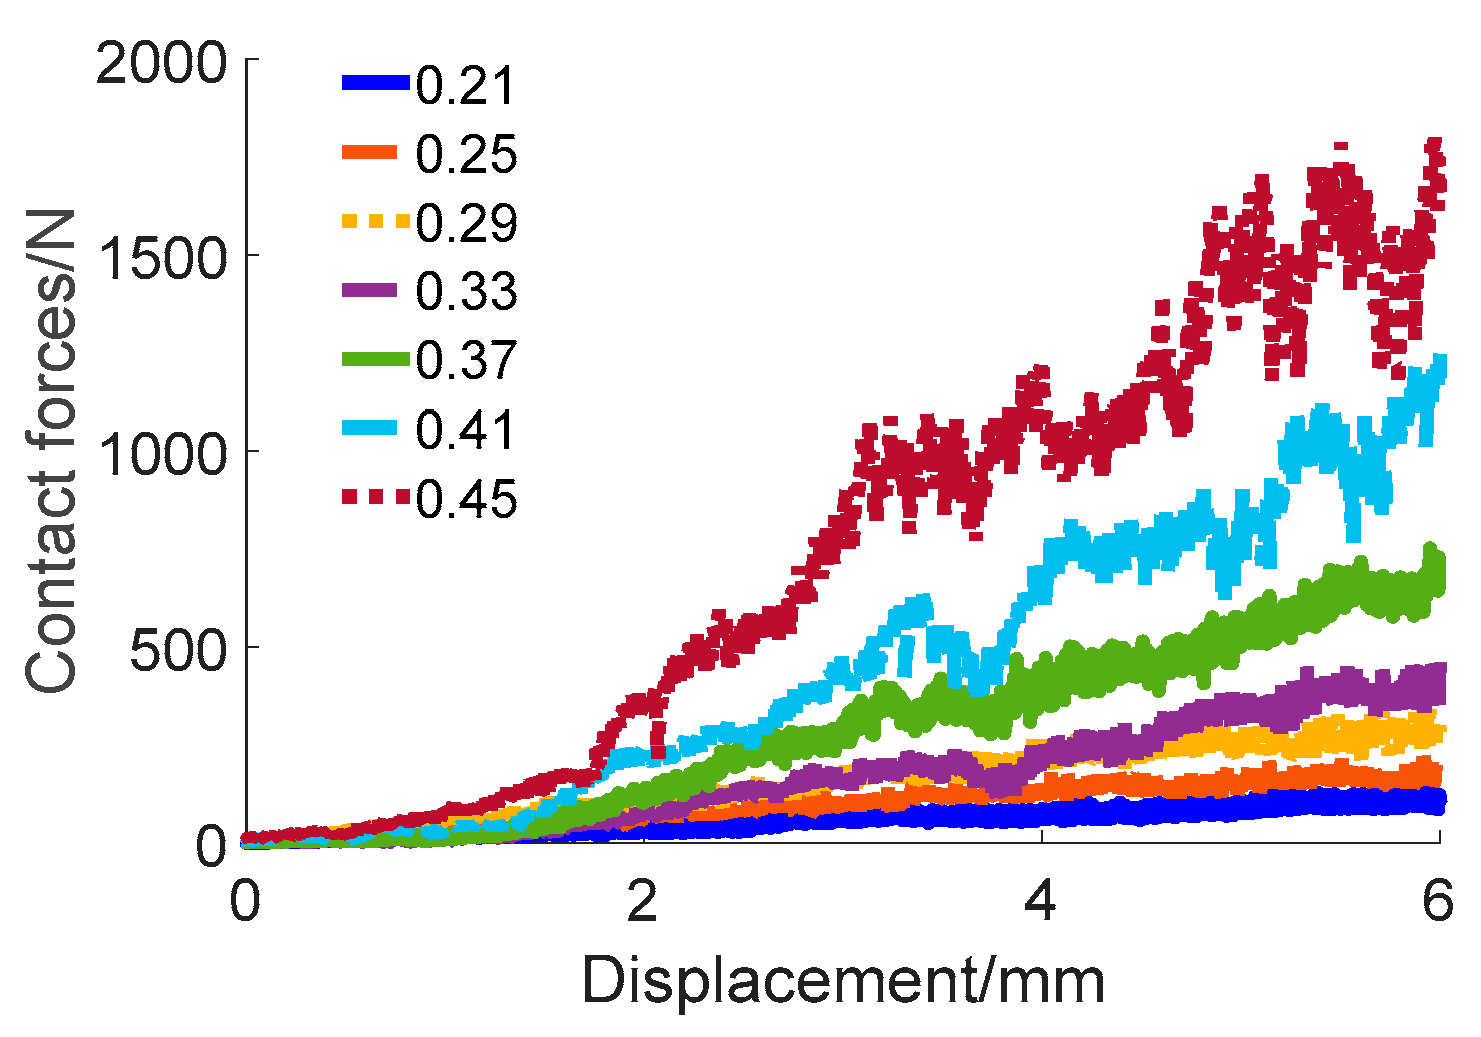
3.1. Macroscopic Behaviour
3.2. Microscopic Behaviour
- (1)
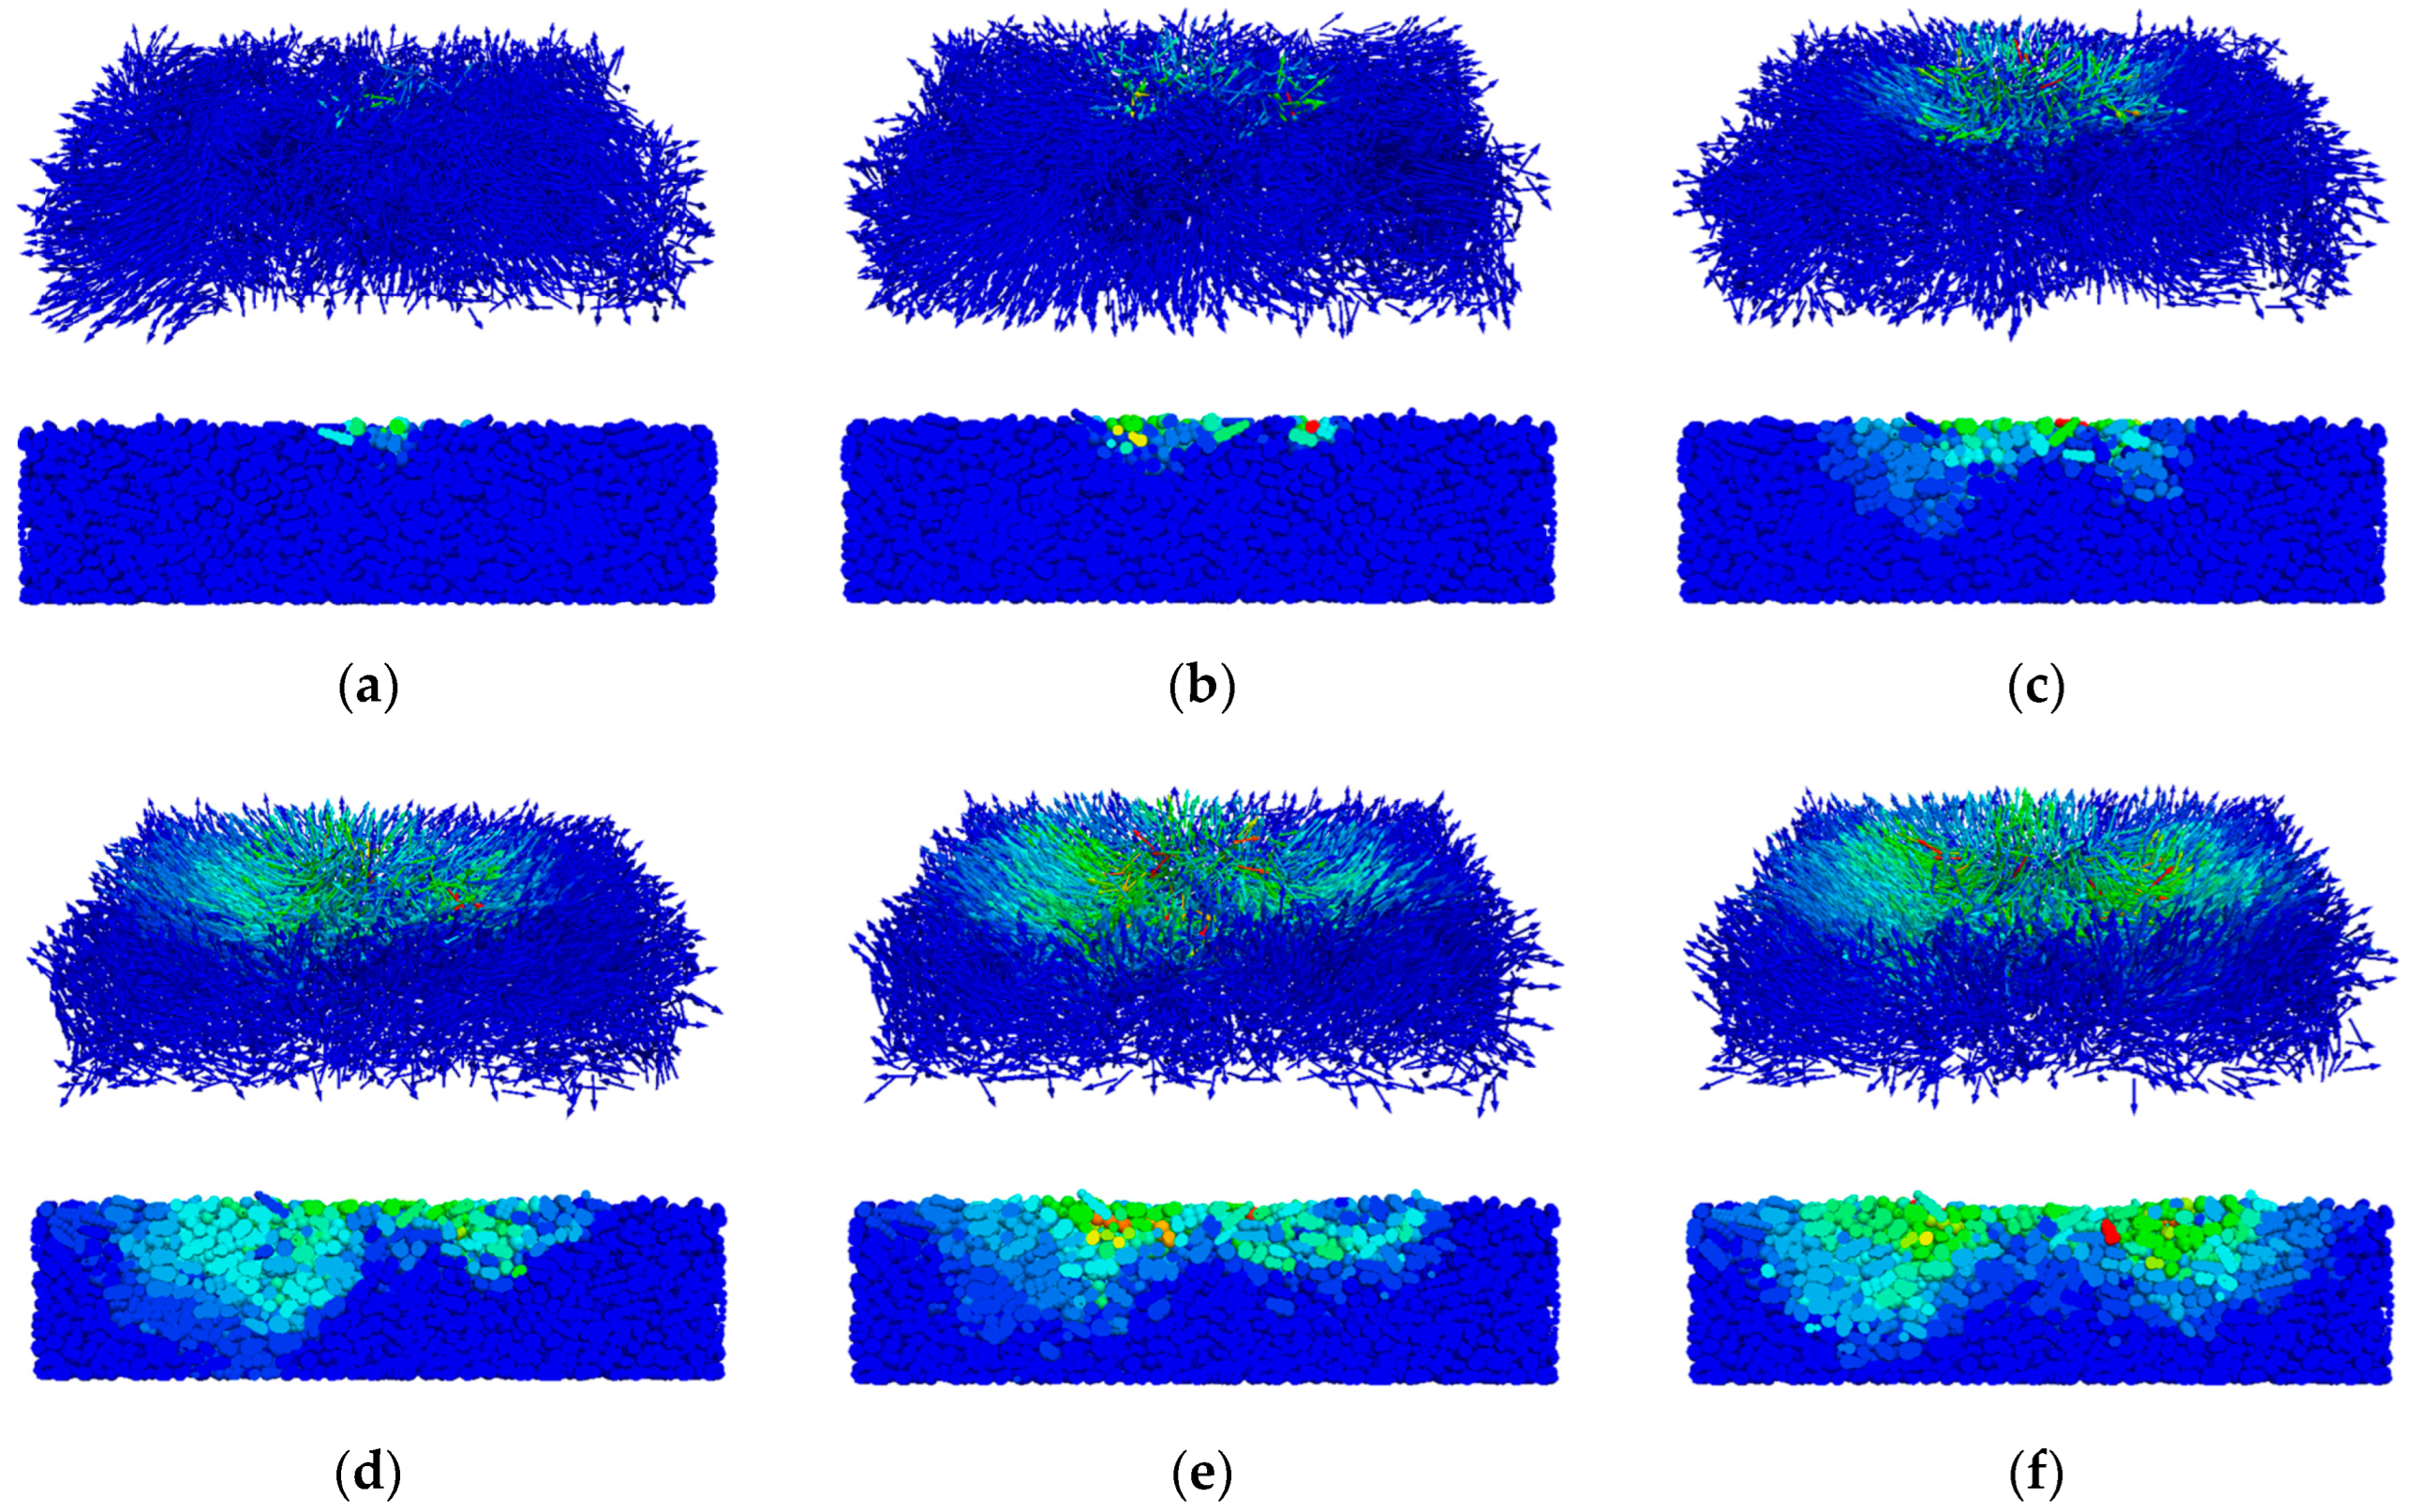
- Pebble velocities
- (2)
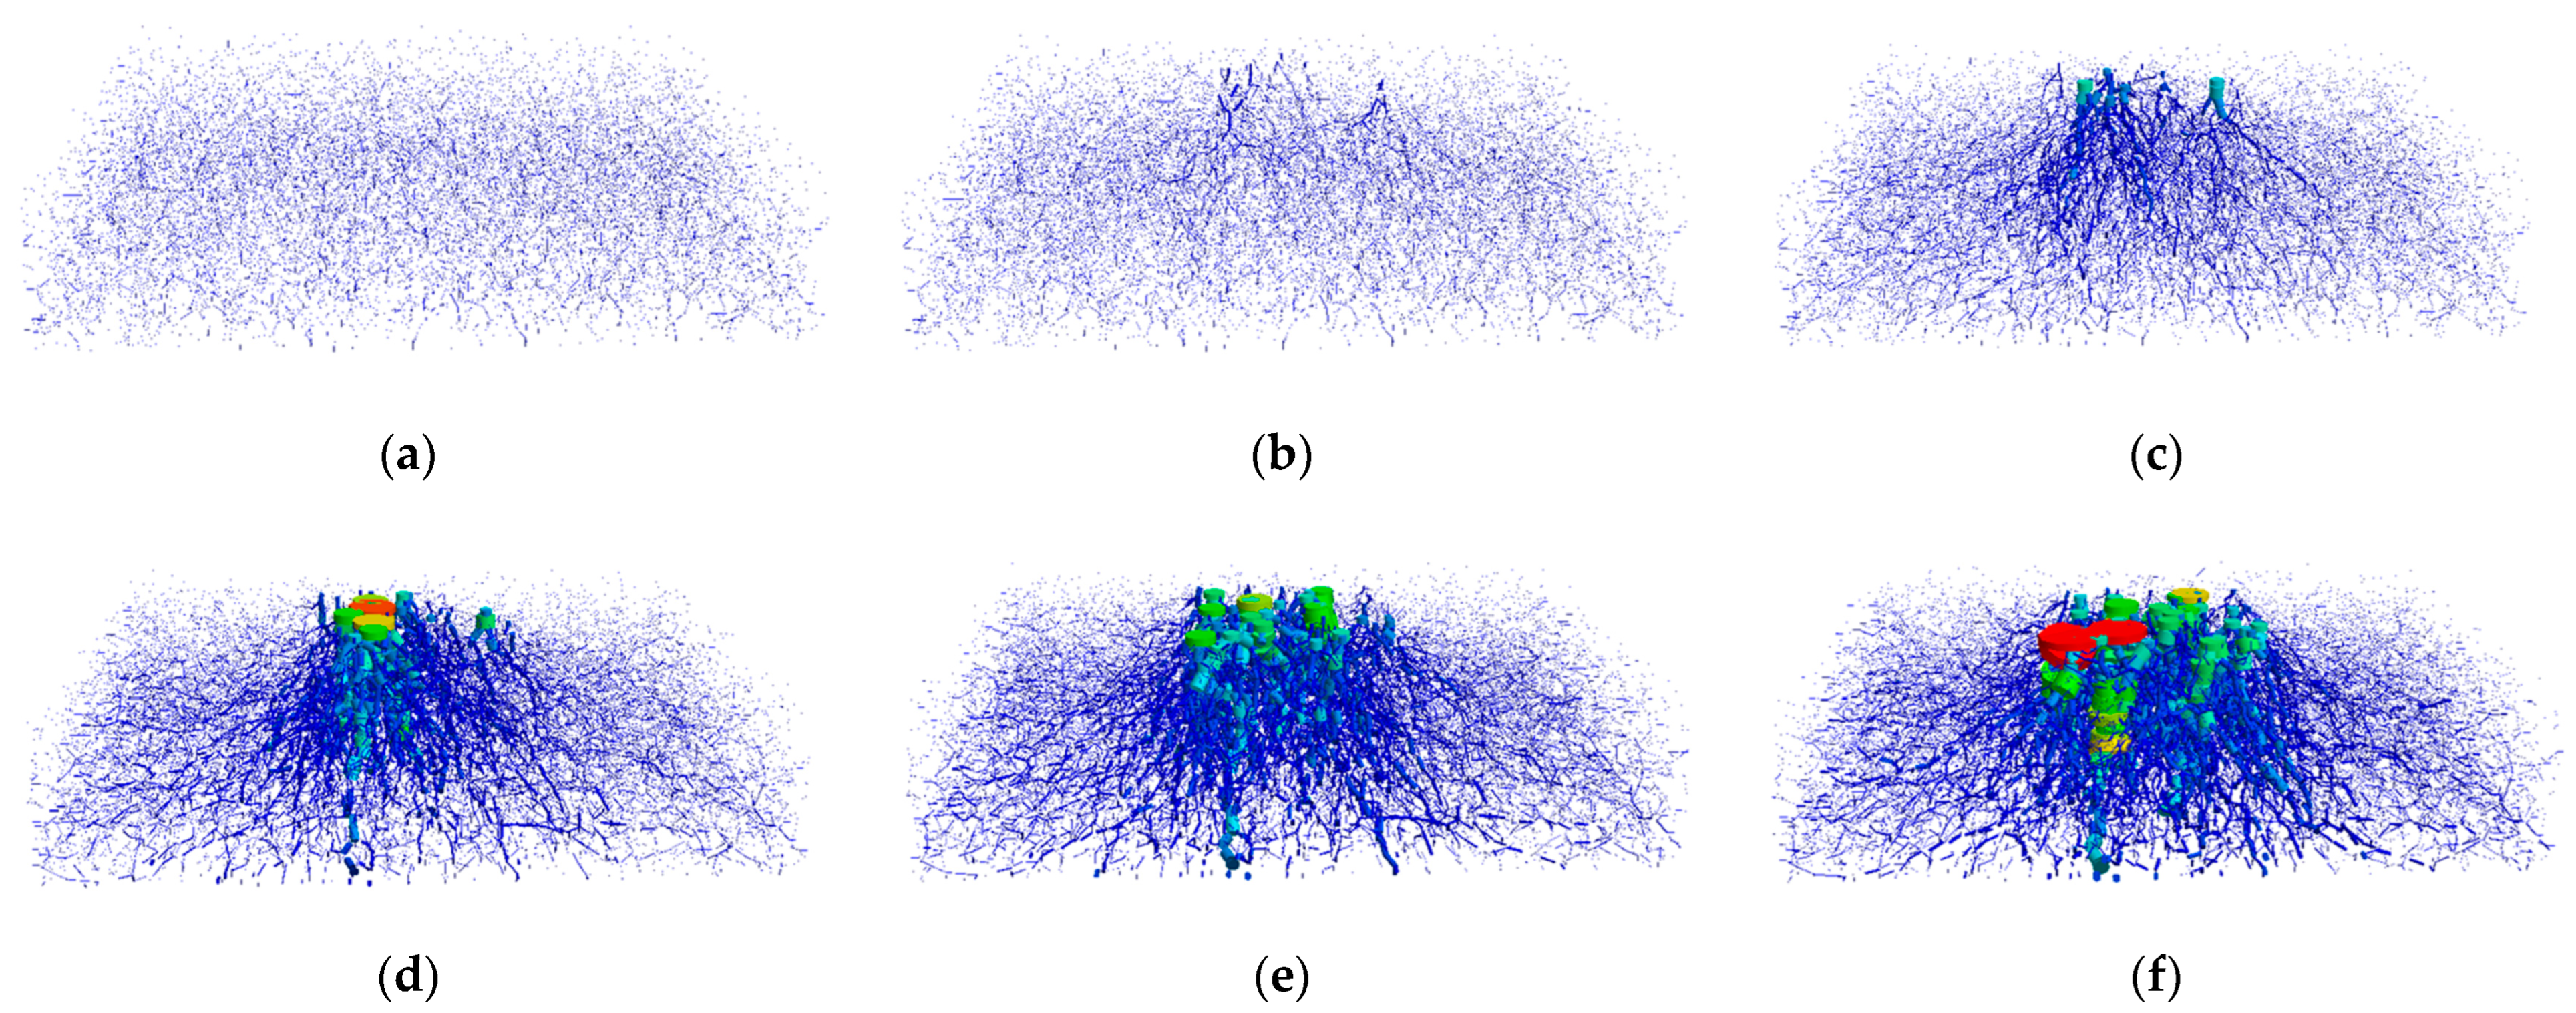
- Force chains
- (3)
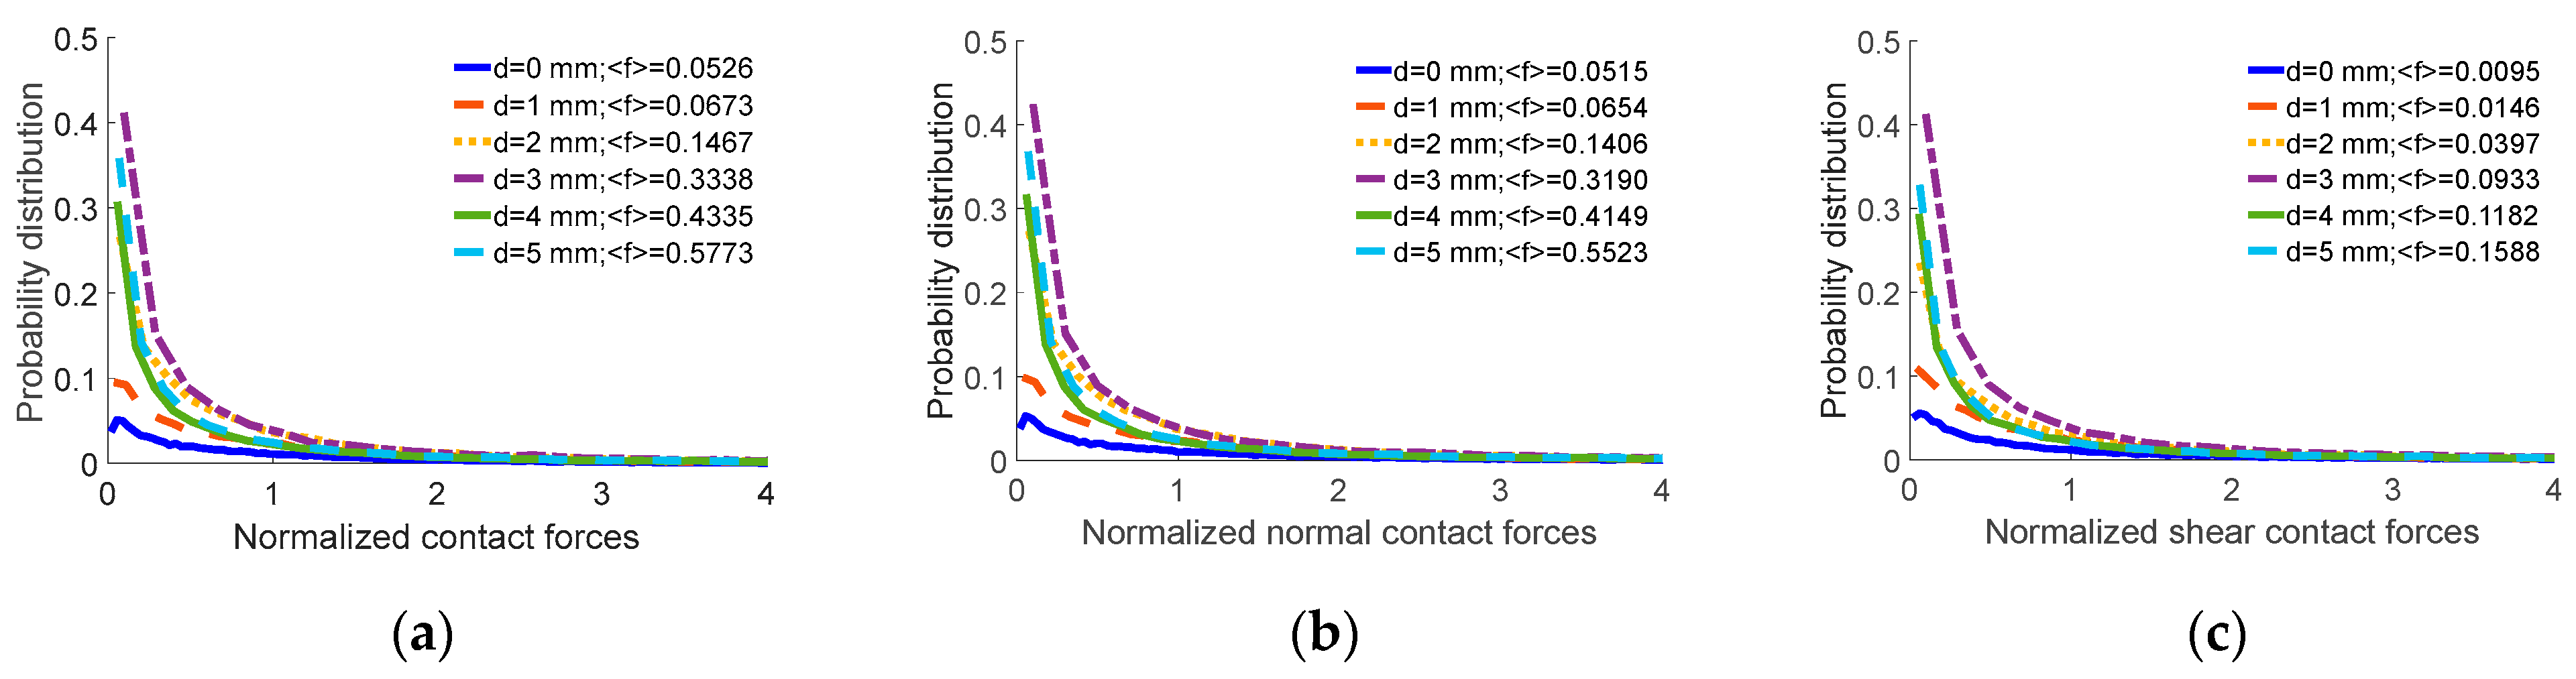
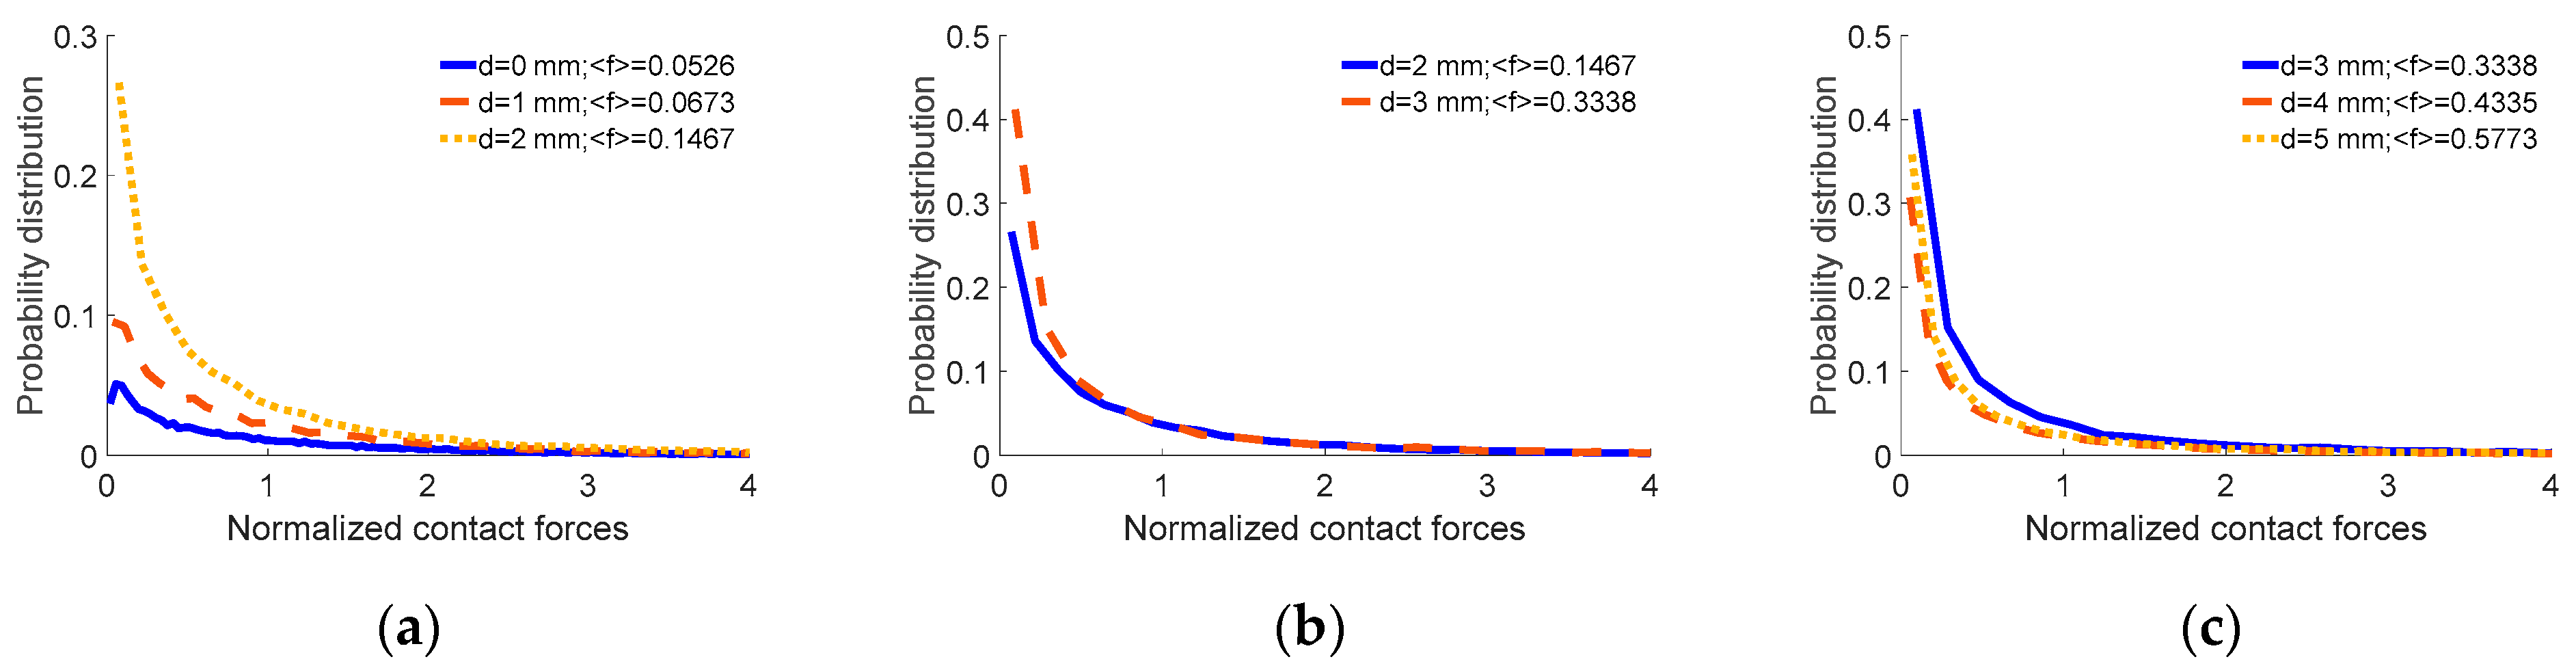
- Contact force distributions
- (4)
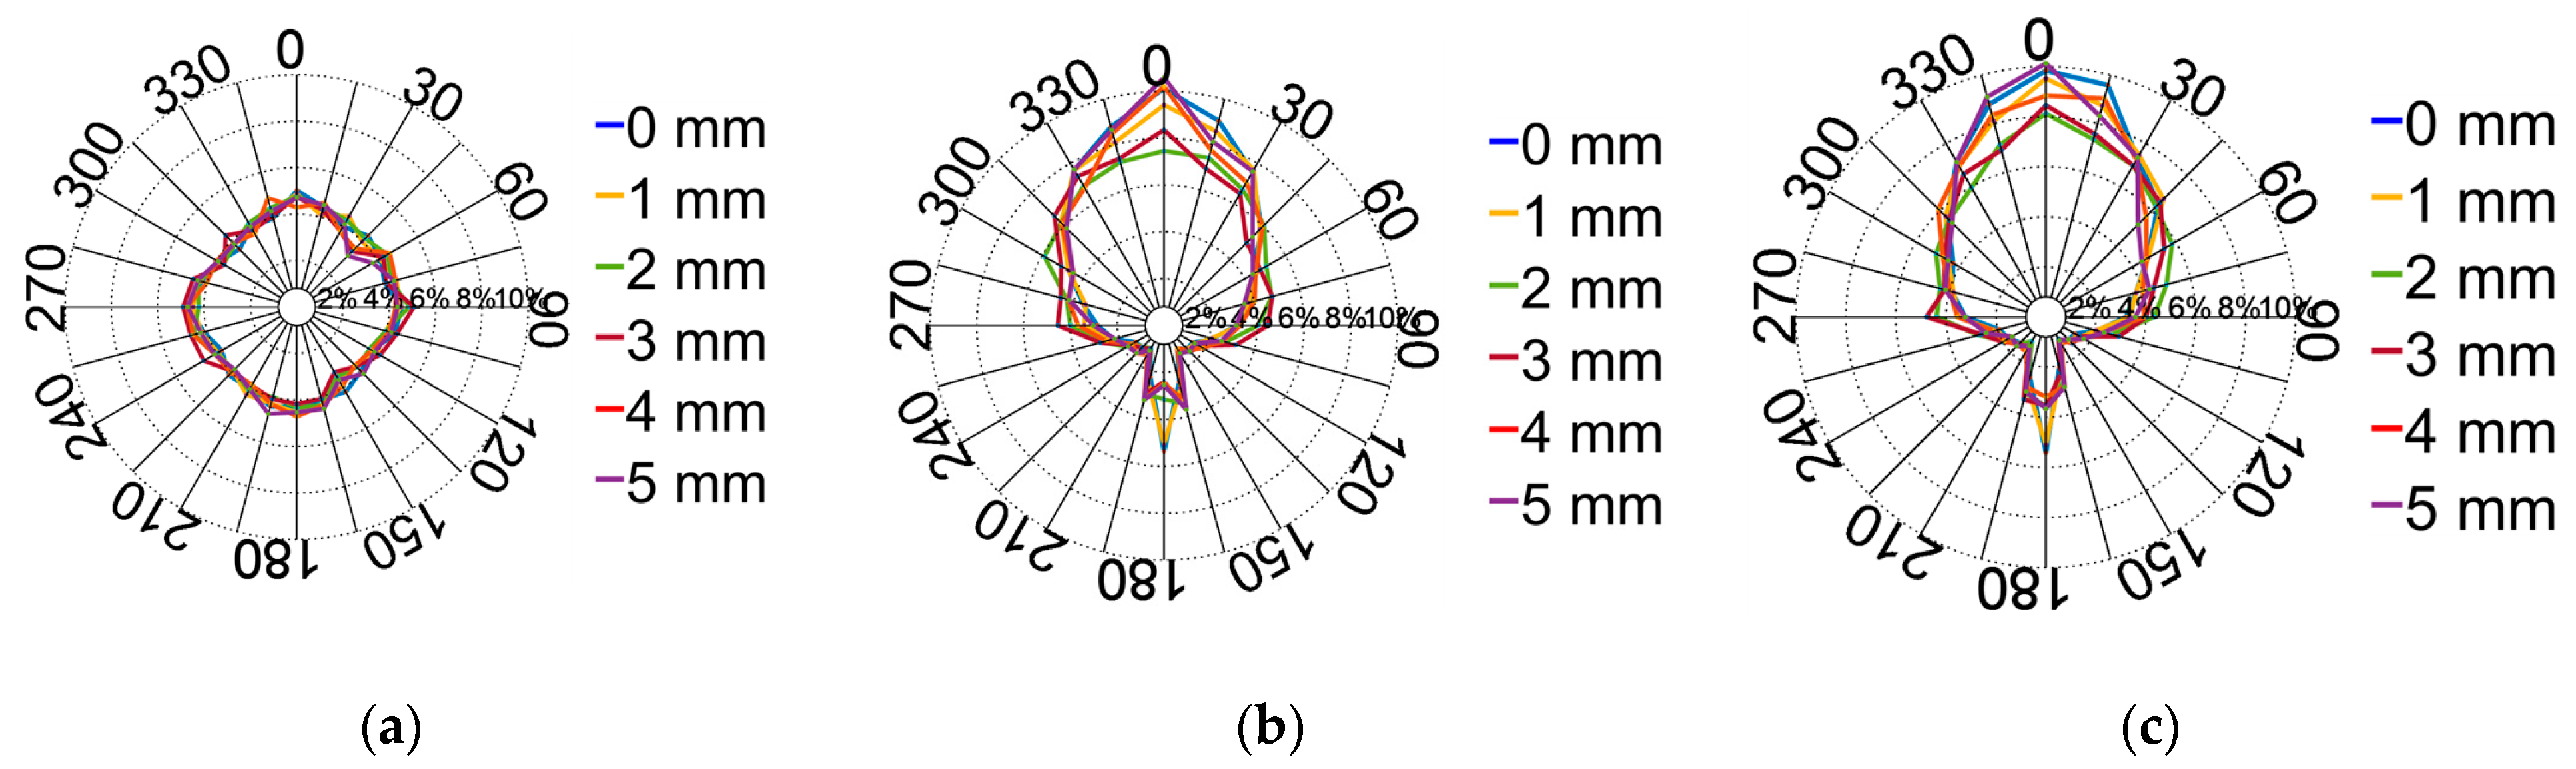
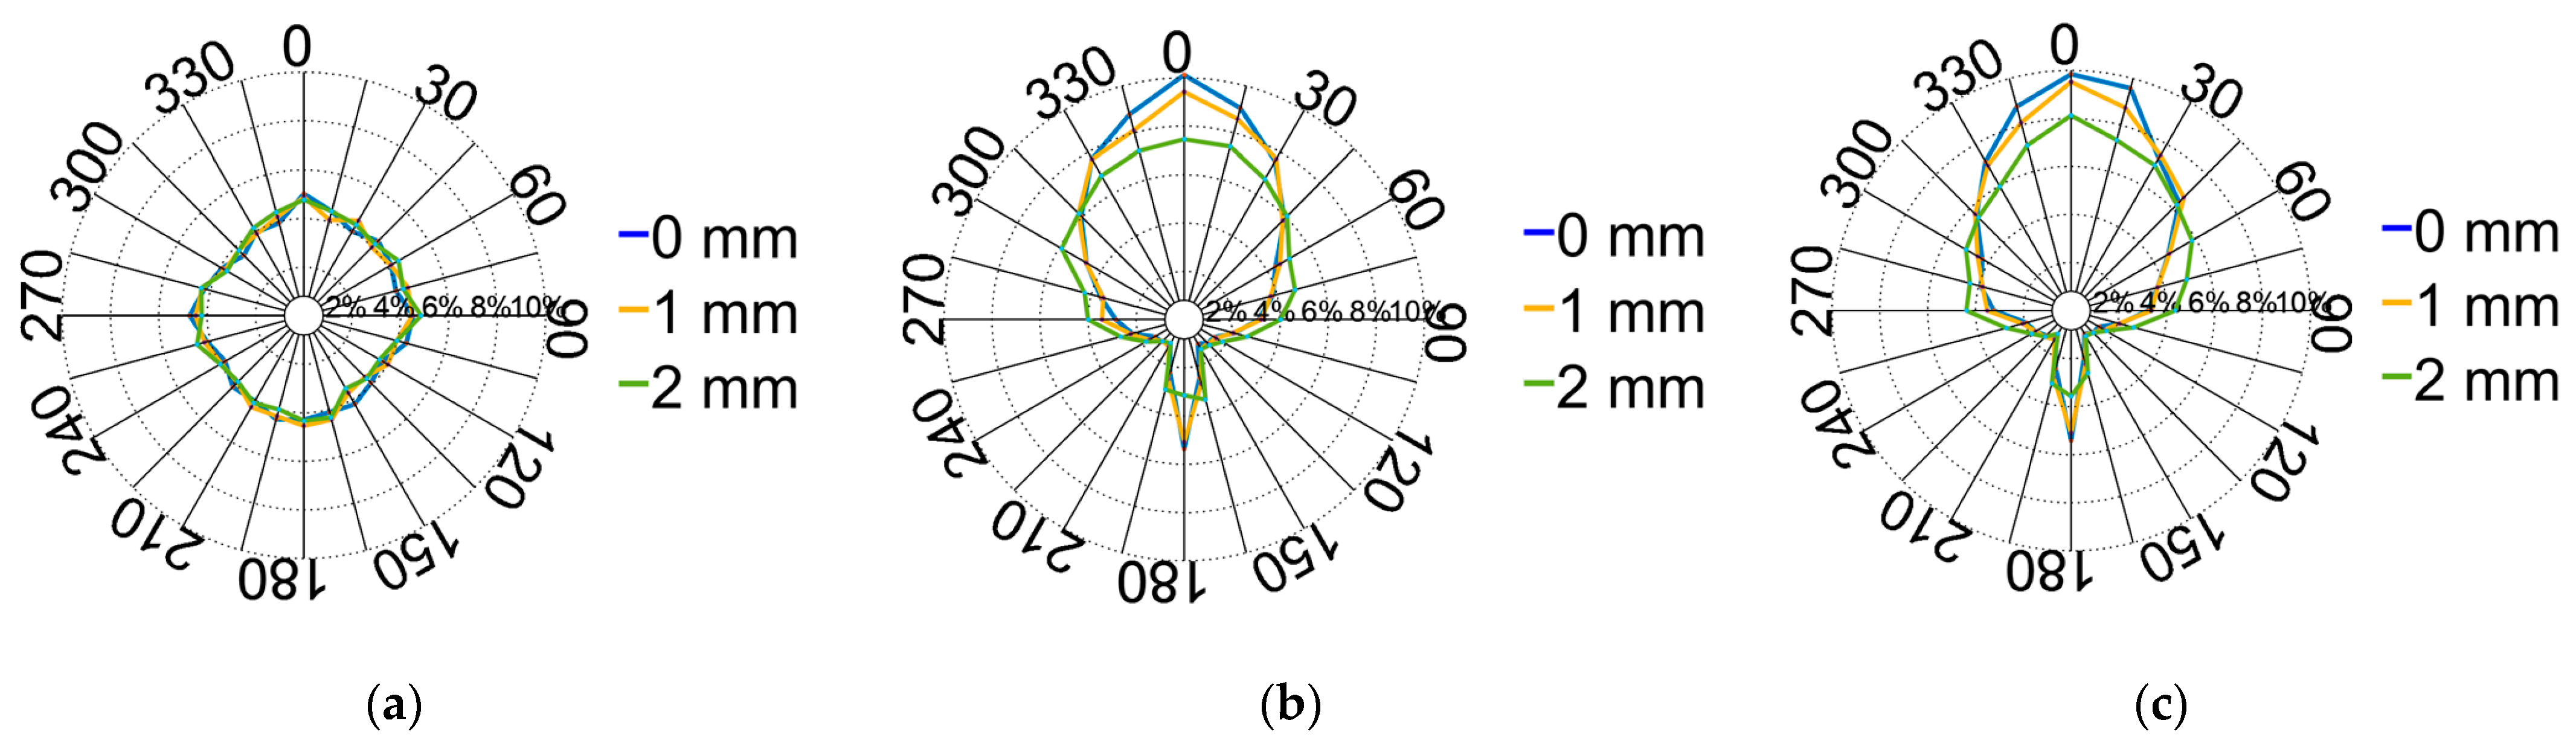
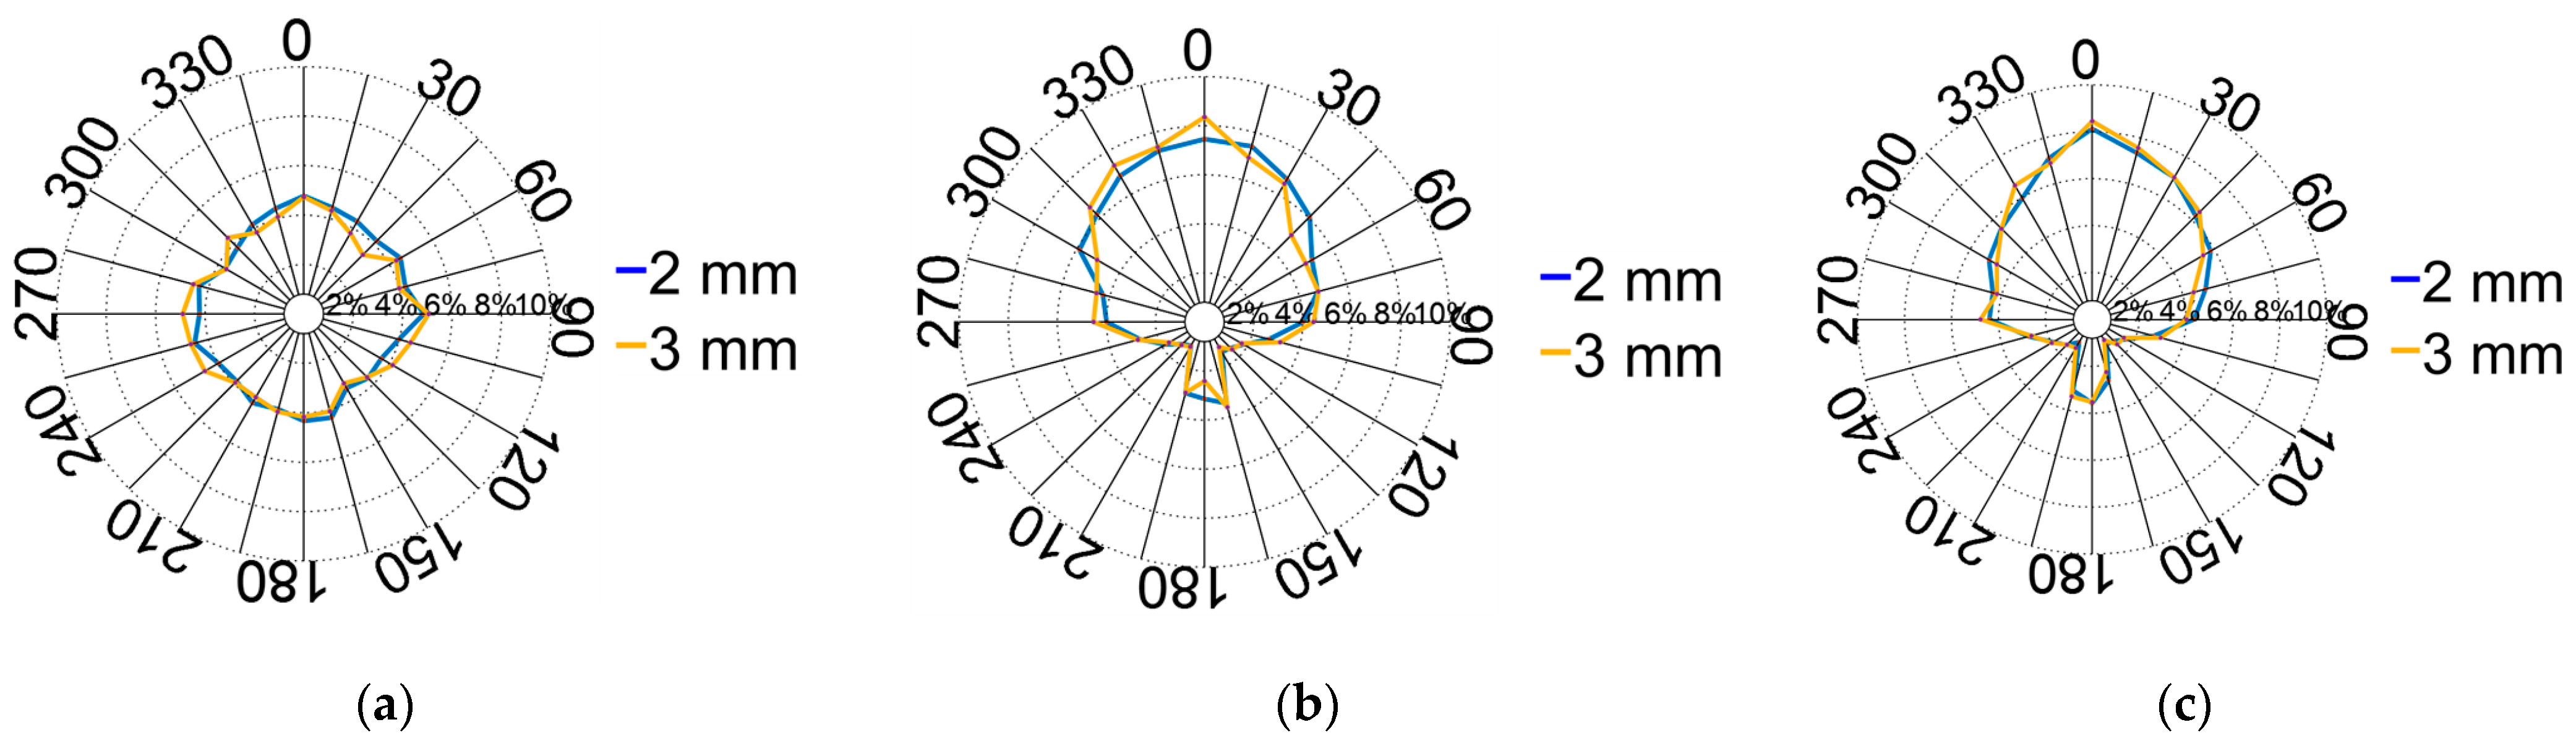
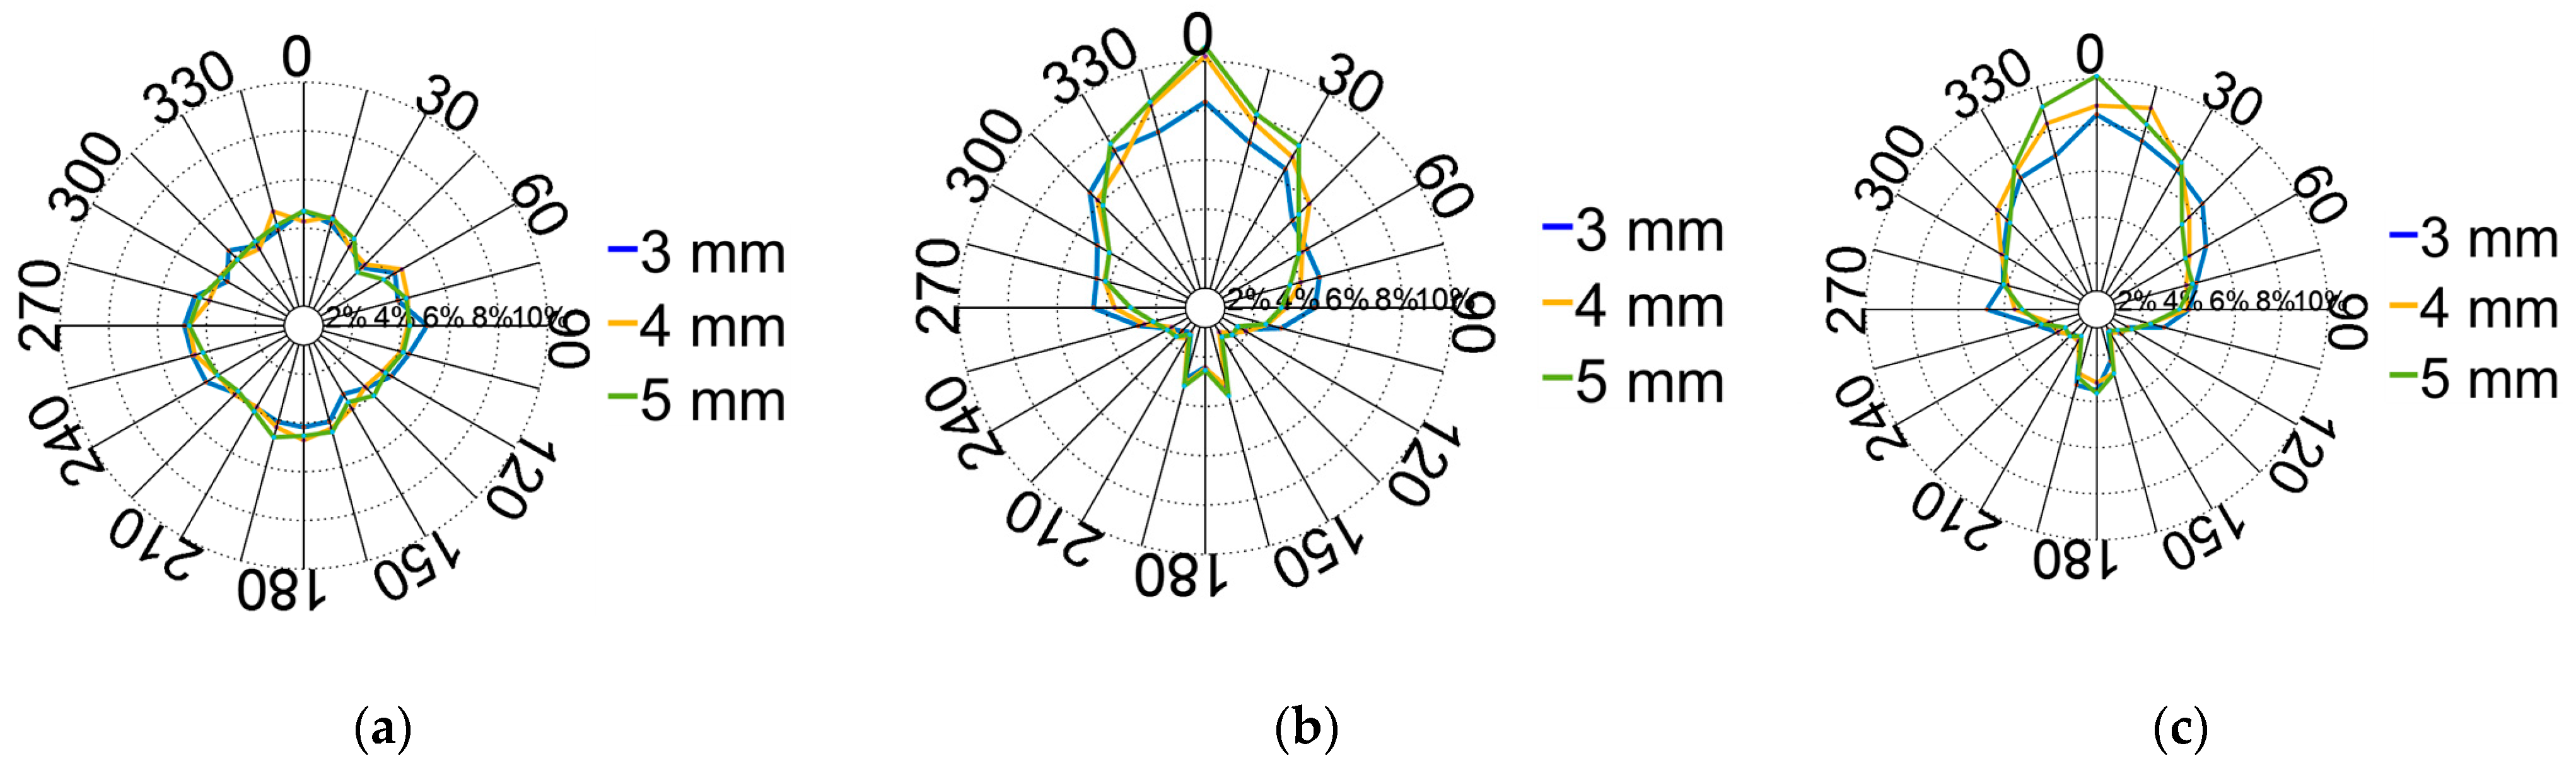
- Contact force directions
3.3. Macro–Micro Analysis
4. Conclusions
- (1)
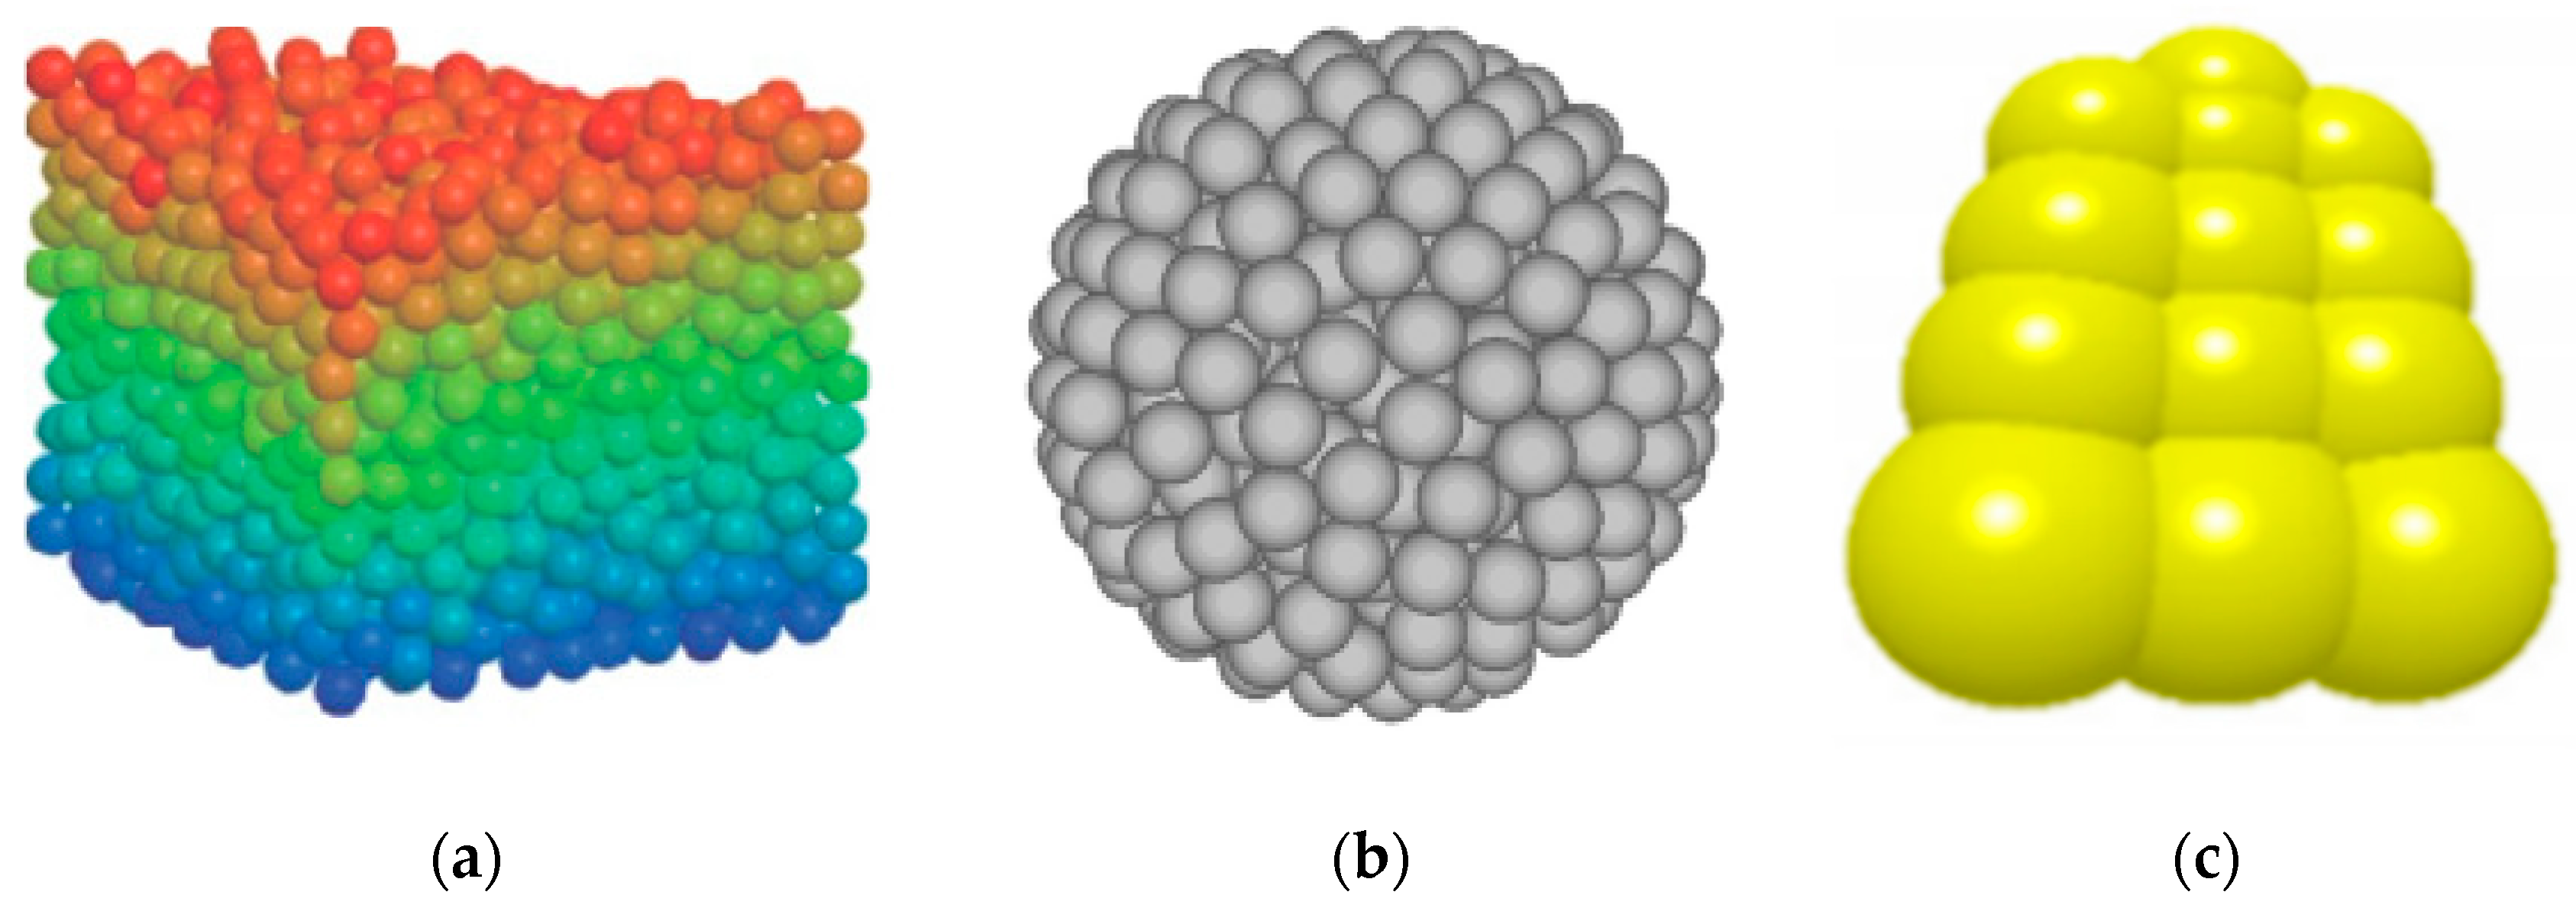
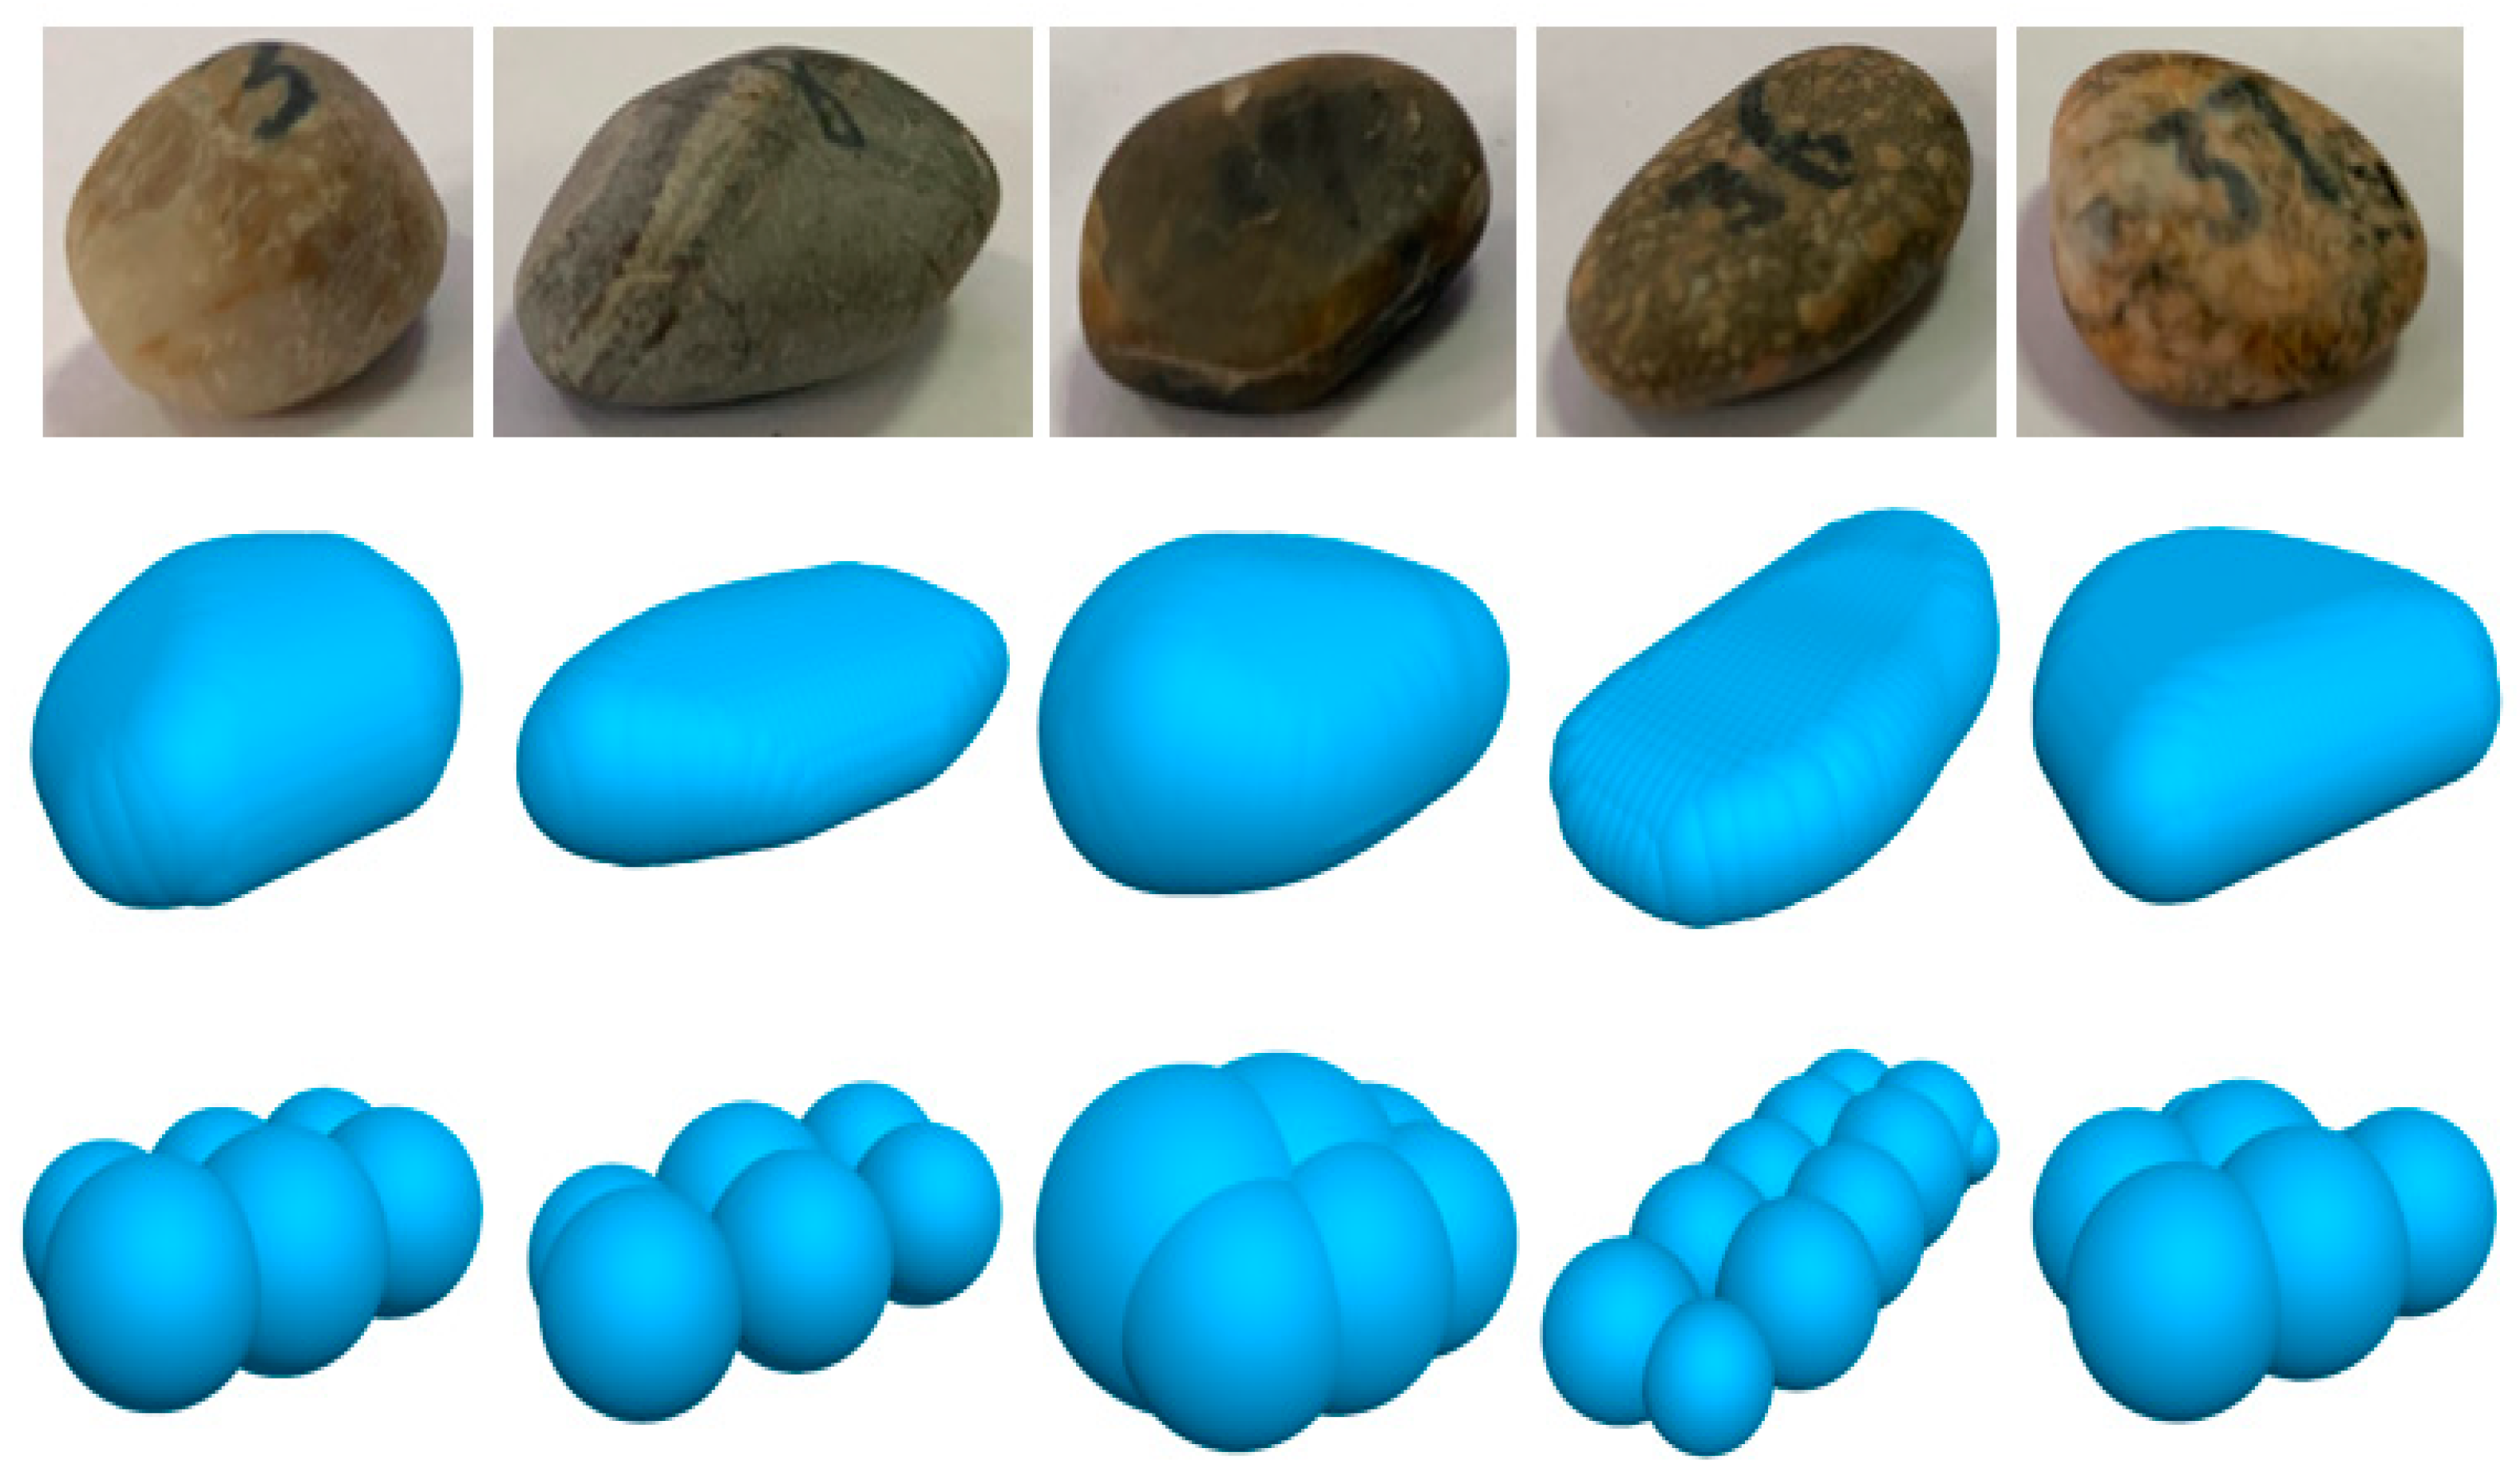
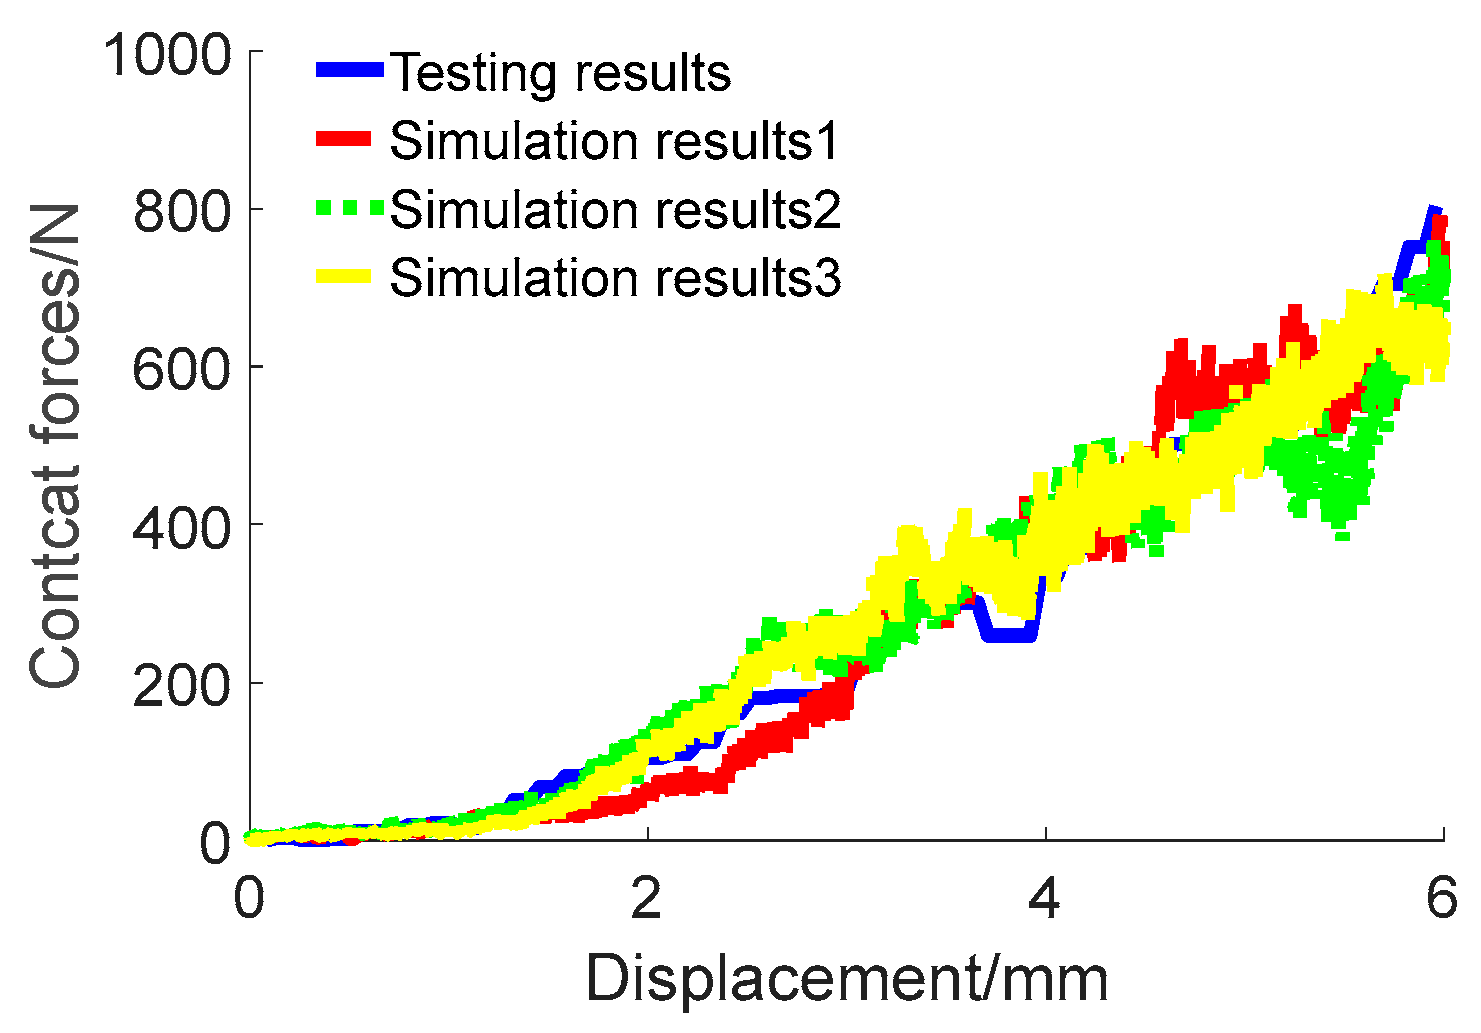
- A novel approach for constructing DEM models of irregularly shaped particles is introduced, leveraging three-view outline curves to create three-dimensional DEM particle shapes via an overlapping element construction method. Comparison with actual particles reveals that this method effectively replicates the formation of pebbles, particularly those with smooth boundaries and flattened shapes. Furthermore, the method substantially decreases the quantity of basic units required to form the particles, maintaining shape fidelity while significantly reducing computational demands. The employment of open-top box compression tests to calibrate the microscopic parameters of the model indicates a consistent trend between experimental outcomes and simulation predictions, showcasing distinct variances under varied parameters and confirming the method’s viability. Moreover, the precision of the developed pebble particle DEM models is rigorously confirmed through extensive simulation and experimental verification.
- (2)
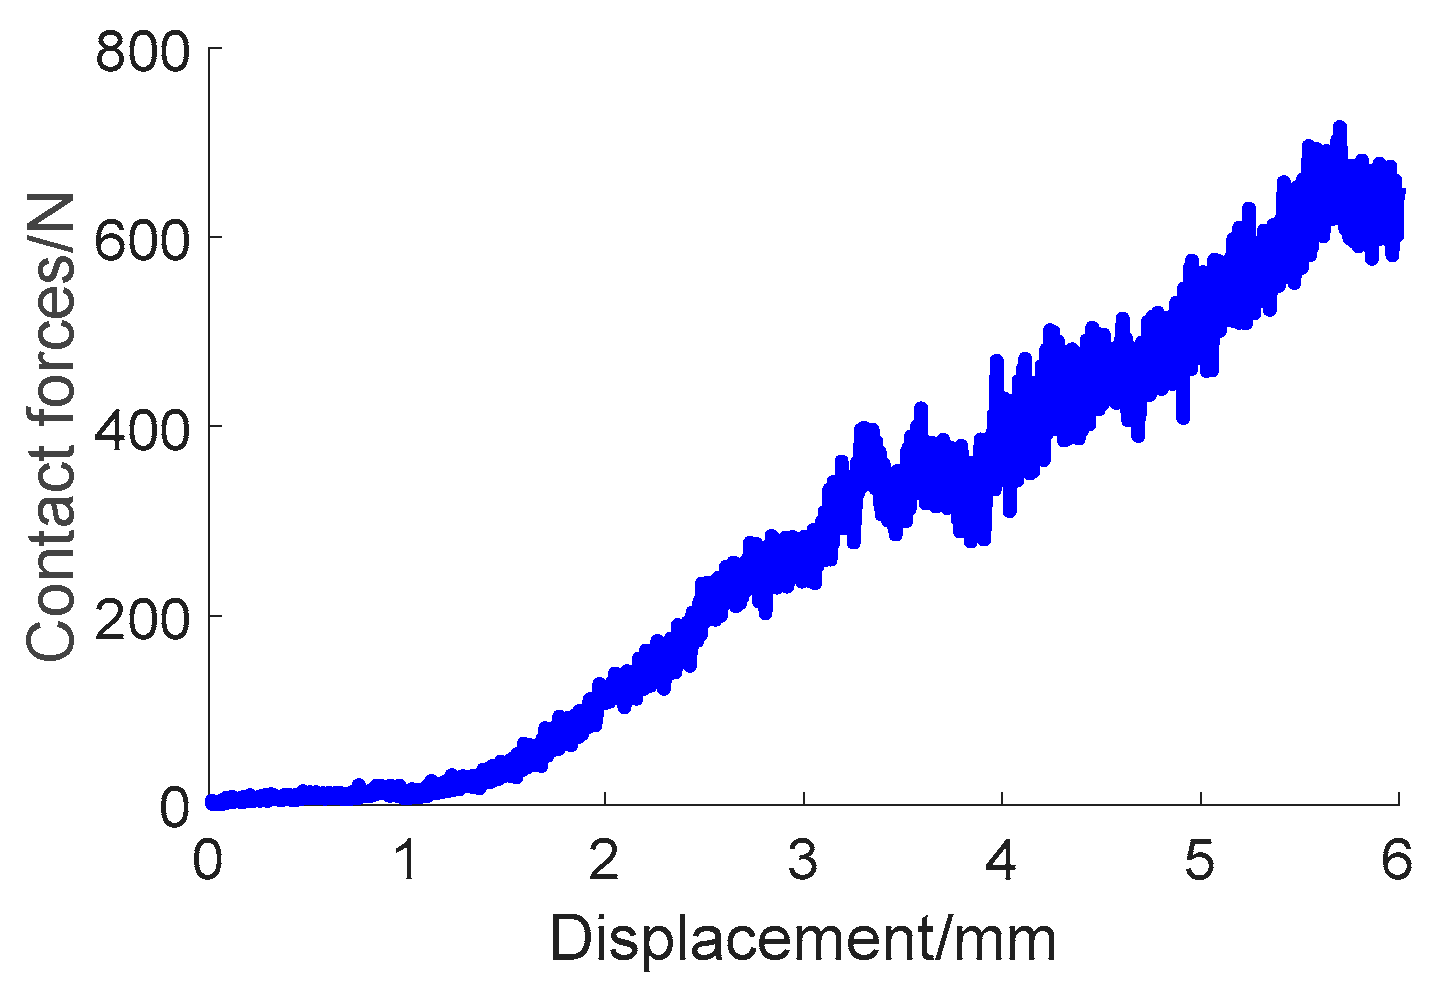
- Leveraging the inherent material properties of these aggregates, this study provides a detailed analysis of the mechanical behavior of aggregate particles. At the macroscopic level, it conducts an analytical exploration of the stress–strain relationship curve, which is divided into two distinct phases: the ‘smooth phase’ and the ‘stress phase.’ The smooth phase signifies a relatively moderate growth rate, whereas in the stress phase, the contact force sharply increases, marked by several fluctuations throughout. On the microscopic scale, this study outlines the transmission pathways of external loads and the mechanical interactions between individual particle units, highlighting the particle as the primary unit of analysis. It shows that external pressures mainly affect surface-level particles initially. As the application of pressure intensifies, the distribution of force among particles becomes wider, causing a synchronous downward movement of particles under direct pressure, while adjacent ones undergo accelerated displacement. Centrally located particles experience lateral compression, leading to more subtle positional changes.
- (3)
- Integrating macroscopic and microscopic contact characteristics, this analysis delineates the process into three phases. Initially, there’s a marked increase in contact forces, boosting the average force while maintaining stability. Notably, the XOY plane shows less variability than the XOZ plane, with YOZ and XOZ distributions essentially consistent, which is attributed to the particles’ initial Z-axis orientation via the rainfall method. Subsequently, the rate of change in contact force decelerates due to the dispersed stress distribution, ensuring consistent average force. This uniformity stems from the pressing plate’s even pressure, aligning YOZ with XOZ distributions. The concluding phase features reduced minor forces, fostering a new equilibrium and heightened particle mobility, thus forming a cyclic pattern. Minimal subsequent changes, largely due to spatial constraints, lead to an increased contact force and stable distribution.
Author Contributions
Funding
Institutional Review Board Statement
Informed Consent Statement
Data Availability Statement
Conflicts of Interest
References
- Haq, M.T.; Ampadu, V.M.K.; Ksaibati, K. An investigation of brake failure related crashes and injury severity on mountainous roadways in Wyoming. J. Saf. Res. 2023, 84, 7–17. [Google Scholar] [CrossRef] [PubMed]
- He, Y.; Wang, Y.; Wu, F.; Yang, R.; Wang, P.; She, S.; Ren, D. Temperature monitoring of vehicle brake drum based on dual light fusion and deep learning. Infrared Phys. Technol. 2023, 133, 104823. [Google Scholar] [CrossRef]
- Qin, P.; Li, Z.; Li, H.; Huang, J.; Wang, G. Influence of Aggregate Pollution in Truck Escape Ramps on Stopping Distance of Uncontrolled Vehicles. Sustainability 2022, 14, 11593. [Google Scholar] [CrossRef]
- Capuano, F.A.; Heymsfield, E.; Li, N. Alternative arresting system design for truck escape ramps. Int. J. Crashworthiness 2018, 23, 618–626. [Google Scholar] [CrossRef]
- van der Haven, D.L.H.; Fragkopoulos, I.S.; Elliott, J.A. A physically consistent Discrete Element Method for arbitrary shapes using Volume-interacting Level Sets. Comput. Methods Appl. Mech. Eng. 2023, 414, 116165. [Google Scholar] [CrossRef]
- Cundall, P.A.; Strack, O.D.L. A discrete numerical model for granular assemblies. Geotechnique 1979, 29, 47–65. [Google Scholar] [CrossRef]
- Ren, J.; Yin, C. Investigating mechanical characteristics of aggregate structure for road materials. Int. J. Pavement Eng. 2022, 23, 372–386. [Google Scholar] [CrossRef]
- Zhao, X.; Dong, Q.; Chen, X.; Xiao, Y.; Zheng, D. Fatigue damage numerical simulation of cement-treated base materials by discrete element method. Constr. Build. Mater. 2021, 276, 122142. [Google Scholar] [CrossRef]
- Li, J.; Wang, B.; Wang, D.; Zhang, P.; Vardon, P. A coupled MPM-DEM method for modelling soil-rock mixtures. Comput. Geotech. 2023, 160, 105508. [Google Scholar] [CrossRef]
- Haq, S.; Indraratna, B.; Nguyen, T.T.; Rujikiatkamjorn, C. Hydromechanical state of soil fluidisation: A microscale perspective. Acta Geotech. 2023, 18, 1149–1167. [Google Scholar] [CrossRef]
- Lin, J.; Bao, M.; Zhang, F.; Yang, J.; Li, H. Mixing simulation of cohesive particles in a soil mixer. Powder Technol. 2022, 399, 117218. [Google Scholar] [CrossRef]
- Liu, P.; Yu, Q.; Zhao, X.; Zhou, C.; Shi, P. Three-dimensional discrete element modeling of the irregularly shaped pebbles used in a truck escape ramp. Comput. Part. Mech. 2020, 7, 479–490. [Google Scholar] [CrossRef]
- Zhao, X.; Liu, P.; Yu, Q.; Shi, P.; Ye, Y. On the effective speed control characteristics of a truck escape ramp based on the discrete element method. IEEE Access 2019, 7, 80366–80379. [Google Scholar] [CrossRef]
- Sun, W.; Wu, K.; Liu, S.; Zhang, X. Influence of aspect ratio and arrangement direction on the shear behavior of ellipsoids. Particuology 2022, 70, 82–94. [Google Scholar] [CrossRef]
- Golshan, S.; Munch, P.; Gassmöller, R.; Kronbichler, M.; Blais, B. Lethe-DEM: An open-source parallel discrete element solver with load balancing. Comput. Part. Mech. 2023, 10, 77–96. [Google Scholar] [CrossRef]
- Han, J.; Shen, K.; Guo, Y.; Xiong, H.; Lin, J. Discrete element simulations of flexible ribbon-like particles. Powder Technol. 2023, 429, 118950. [Google Scholar] [CrossRef]
- Yang, P.; Kavazanjian, E.; Neithalath, N. DEM simulations on the influence of carbonate precipitation on liquefaction mitigation of sand. Comput. Geotech. 2023, 162, 105681. [Google Scholar] [CrossRef]
- Li, X.; Kouretzis, G.; Thoeni, K. Discrete Element Modelling of uplift of rigid pipes deeply buried in dense sand. Comput. Geotech. 2024, 166, 105957. [Google Scholar] [CrossRef]
- Pawar, D.K.; Annabattula, R.K.; Swaminathan, N. Mesoscopic mechanics of triaxially compressed pebble assembly and estimation of Drucker–Prager parameters using discrete element method. Comput. Part. Mech. 2023, 1–17. [Google Scholar] [CrossRef]
- Coetzee, C. Calibration of the discrete element method: Strategies for spherical and non-spherical particles. Powder Technol. 2020, 364, 851–878. [Google Scholar] [CrossRef]
- Liu, X.; Zhou, A.; Sun, K.; Shen, S.-L. Discrete element modelling of the macro/micro-mechanical behaviour of unsaturated soil in direct shear tests including wetting process. Powder Technol. 2023, 415, 118125. [Google Scholar] [CrossRef]
- Lai, Z.; Xia, Y.; Chen, Q. Discrete element modeling of granular hopper flow of irregular-shaped deformable particles. Advanced Powder Technol. 2023, 34, 104106. [Google Scholar] [CrossRef]
- Huang, X.; Zheng, Q.; Liu, D.; Yu, A.; Yan, W. A design method of hopper shape optimization with improved mass flow pattern and reduced particle segregation. Chem. Eng. Sci. 2022, 253, 117579. [Google Scholar] [CrossRef]
- Canny, J. A computational approach to edge detection. IEEE Trans. Pattern Anal. Mach. Intell. 1986, 6, 679–698. [Google Scholar] [CrossRef]
- Liu, P.; Yu, Q.; Zhao, X.; Shi, P.; Chen, H. Discrete element analysis of the reconstruction method for randomly shaped pebbles. IEEE Access 2019, 7, 137317–137329. [Google Scholar] [CrossRef]


| Parameter | Value | |
|---|---|---|
| Pressing plate | Length | 0.1 m |
| Width | 0.1 m | |
| Height | 0.01 m | |
| Pebble container | Length | 0.343 m |
| Width | 0.236 m | |
| Height | 0.164 m | |
| Pebbles | Damp | 0.7 N/(m·s) |
| Density | 2777 kg/m3 | |
| Normal stiffness | 4.8 × 10⁶ N/m | |
| Tangential stiffness | 2.4 × 10⁷ N/m |
Disclaimer/Publisher’s Note: The statements, opinions and data contained in all publications are solely those of the individual author(s) and contributor(s) and not of MDPI and/or the editor(s). MDPI and/or the editor(s) disclaim responsibility for any injury to people or property resulting from any ideas, methods, instructions or products referred to in the content. |
© 2024 by the authors. Licensee MDPI, Basel, Switzerland. This article is an open access article distributed under the terms and conditions of the Creative Commons Attribution (CC BY) license (https://creativecommons.org/licenses/by/4.0/).
Share and Cite
Liu, P.; Bai, P.; Liu, W. Analysis of the Load-Bearing Capacity of Pebble Aggregates. Appl. Sci. 2024, 14, 3109. https://doi.org/10.3390/app14073109
Liu P, Bai P, Liu W. Analysis of the Load-Bearing Capacity of Pebble Aggregates. Applied Sciences. 2024; 14(7):3109. https://doi.org/10.3390/app14073109
Chicago/Turabian StyleLiu, Pan, Peiyi Bai, and Wenju Liu. 2024. "Analysis of the Load-Bearing Capacity of Pebble Aggregates" Applied Sciences 14, no. 7: 3109. https://doi.org/10.3390/app14073109
APA StyleLiu, P., Bai, P., & Liu, W. (2024). Analysis of the Load-Bearing Capacity of Pebble Aggregates. Applied Sciences, 14(7), 3109. https://doi.org/10.3390/app14073109