1. Introduction
Health monitoring of large-scale infrastructure such as highways and railway bridges are crucial for public safety [
1], and structural dynamic displacement measurement is an important parameter in structural health monitoring. Traditional contact displacement sensors can only measure single point displacements, and their installation and calibration processes are cumbersome, damaging to structures, and have high maintenance costs [
2]. Other non-contact measurement technologies of total stations, laser rangefinders, and GPS are limited by sampling frequency, measurement accuracy, or cost [
3,
4,
5].
Machine vision measurement technology has advantages of non-contact use, cost effectiveness, and full-field measurement, and it does not require sensor installation or cable laying, providing an economic and rapid solution for structural health monitoring [
6,
7,
8]. Ye [
9] reviewed the research and application of structural displacement detection methods by computer vision and pointed out that future research should focus on reducing the measurement error and improving the application efficiency. Catbas [
10] proposed a machine-vision-based structural health monitoring method for bridges which detects and tracks the image sequence of the vehicles crossing the bridge and obtains the unit influence lines. Sladek [
11] proposed a vision-based method for deflection measurement of structures by Digital Image Correlation methods. Busca [
12] analyzed the advantages and disadvantages of template recognition, edge detection, and Digital Image Correlation (DIC) in the measurement of the dynamic response of a vehicle passing over the bridge. Billie [
13] detected and monitored structural defects in infrastructure to explore intelligent recognition through dynamic and static measurements in displacement monitoring. Xiu [
14] proposed an estimation method of structural displacement response based on the fusion concept of contact acceleration monitoring and non-contact displacement identification and obtained structural vibration response and modal information. Wang [
15] proposed a new multiple-camera machine vision bridge modal detection method and achieved the extraction of the structural displacement and modal of a bridge through indoor and outdoor experiments. Pan [
16] proposed high-precision structural top displacement measurement using drone photography technology and the optical flow method and achieved high-precision measurement of large-range structural top displacement in model vibration table tests.
In traditional machine vision, structural displacements are achieved by tracing the preinstalled marker on the structure surface as a feature, but the monitoring locations are limited because of the cumbersome marker installation. Therefore, researchers have aimed to study a marker-free machine vision structural displacement measurement method. Song [
17] proposed a marker-free displacement measurement method based on background segmentation and DIC technology, and results showed that the measurement was accurate and strongly illumination-invariant. Tan [
18] proposed a marker-free dynamic displacement measurement method to measure the large-span beam vibration displacements and modals, and the results were compared and verified with Linear Variable Displacement Transducer (LVDT) measurements. Dong [
19] proposed a multi-point structural dynamic monitoring framework combining marker-free feature tracking and optical flow tracking methods and conducted displacement extraction and modal identification through large-scale indoor and outdoor structural experiments.
The ability to measure and extract structural displacements is closely related to the density of marker placement. Sparse markers on large structures can result in insufficient density of extracted feature points, leading to incomplete spatial field displacement information and inadequate precision in structural displacement measurement. Additionally, feature mismatches can also affect measurement results. Insufficient feature point quantity and feature mismatches are two core challenges in machine-vision-based dynamic displacement measurement of structures.
The accuracy of structural displacement measurement is closely related to the density of marker placement, so sparse markers on large structures will result in insufficient density of feature points and cannot ensure accurate full-field displacement measurement. In addition, feature mismatches inducing measurement error can also affect measurement accuracy. Insufficient feature point quantity and feature mismatches are two core challenges in machine-vision-based full-field structural dynamic displacement measurement. To address these issues, this paper proposes a full-field cantilever beam dynamic deflection measurement method by dense feature extraction and matching with dual-step mismatch removal (DFEM-DSMR).
The structure of this paper is outlined as follows:
Section 2 introduces the theory of dense feature extraction and matching by Scale-Invariant Feature Transform (SIFT) and the Fast Library for Approximate Nearest Neighbors (FLANN) algorithm, and the analysis of the causes of feature mismatch is presented.
Section 3 elaborates on the full-field dynamic displacement measurement of structures by dense feature extraction, matching, and a dual-step mismatch removal method combining Random Sample Consensus (RANSAC) and Structural Displacement Continuity Constraints (SDCCs).
Section 4 presents the indoor cantilever beam dynamic deflection measurement experiments by the proposed method and the validation with commercial DIC software. Finally, the paper is the concluded and summarized.
2. Dense Feature Extraction and Matching Theory and Mismatch Cause Analysis
In machine-vision-based structural displacement measurement methods, structural displacement is measured by extraction and tracking of feature points. Dense feature extraction can enhance the quantity of detection points, facilitate the measurement of subtle changes in structural global displacement, and detect minor defects in structure health monitoring. This section introduces the basic theory of the SIFT and FLANN feature matching algorithms and analyzes the causes of feature mismatches.
2.1. Scale-Invariant Feature Extraction Algorithm
SIFT [
20,
21] is a milestone feature extraction algorithm in image processing due to its robustness to scale, illumination, noise, and rotation and is fundamental for image motion tracking and image stitching as it can extract a much larger number of feature points than other methods, which is advantageous in full-field structural displacement measurement. SIFT feature points are multiscale features [
22], and images of different scale
L(
x,
y,
σ) are obtained by convolving the original images
I(
x,
y) with a variable-scale Gaussian convolution kernel
G(
x,
y,
σ):
where the Gaussian convolution kernel is calculated using the Gaussian convolution function:
where (
x,
y) is the pixel position of the image, the values of
m and
n are generally determined by the scale parameter
σ, and ∗ denotes convolution operation. After determining the size of the Gaussian convolution kernel as well as the scale factor
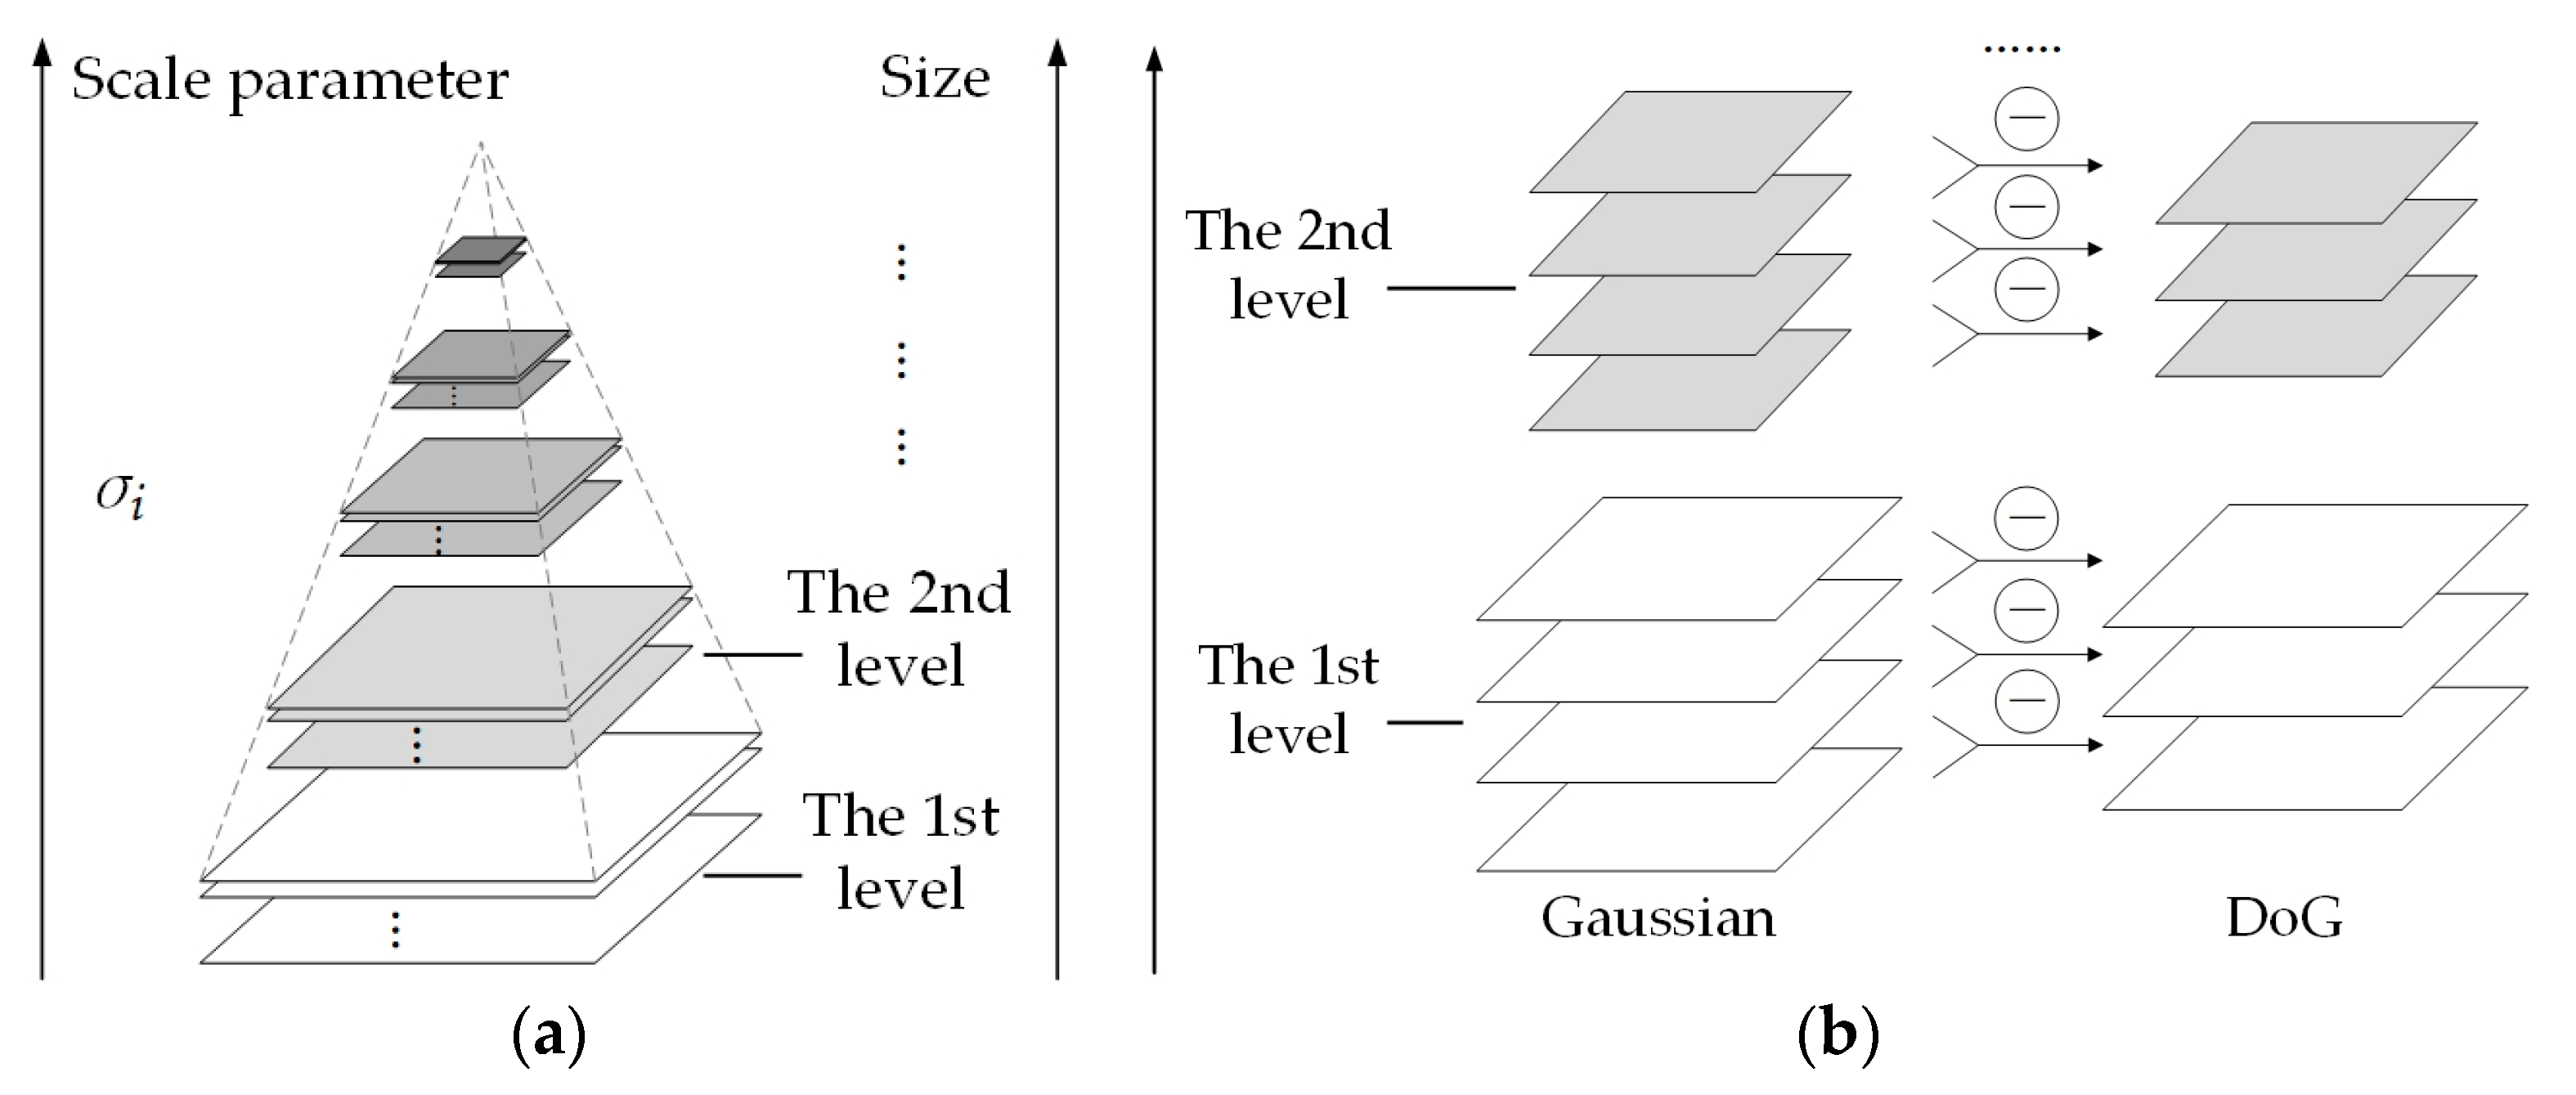
σ, the values at each position of the convolution kernel can be calculated with normalized Gaussian kernel. The image scale space is represented by the Gaussian pyramid as shown in
Figure 1a, and the Gaussian difference is obtained by the Difference of Gaussians (DoG) shown in
Figure 1b.
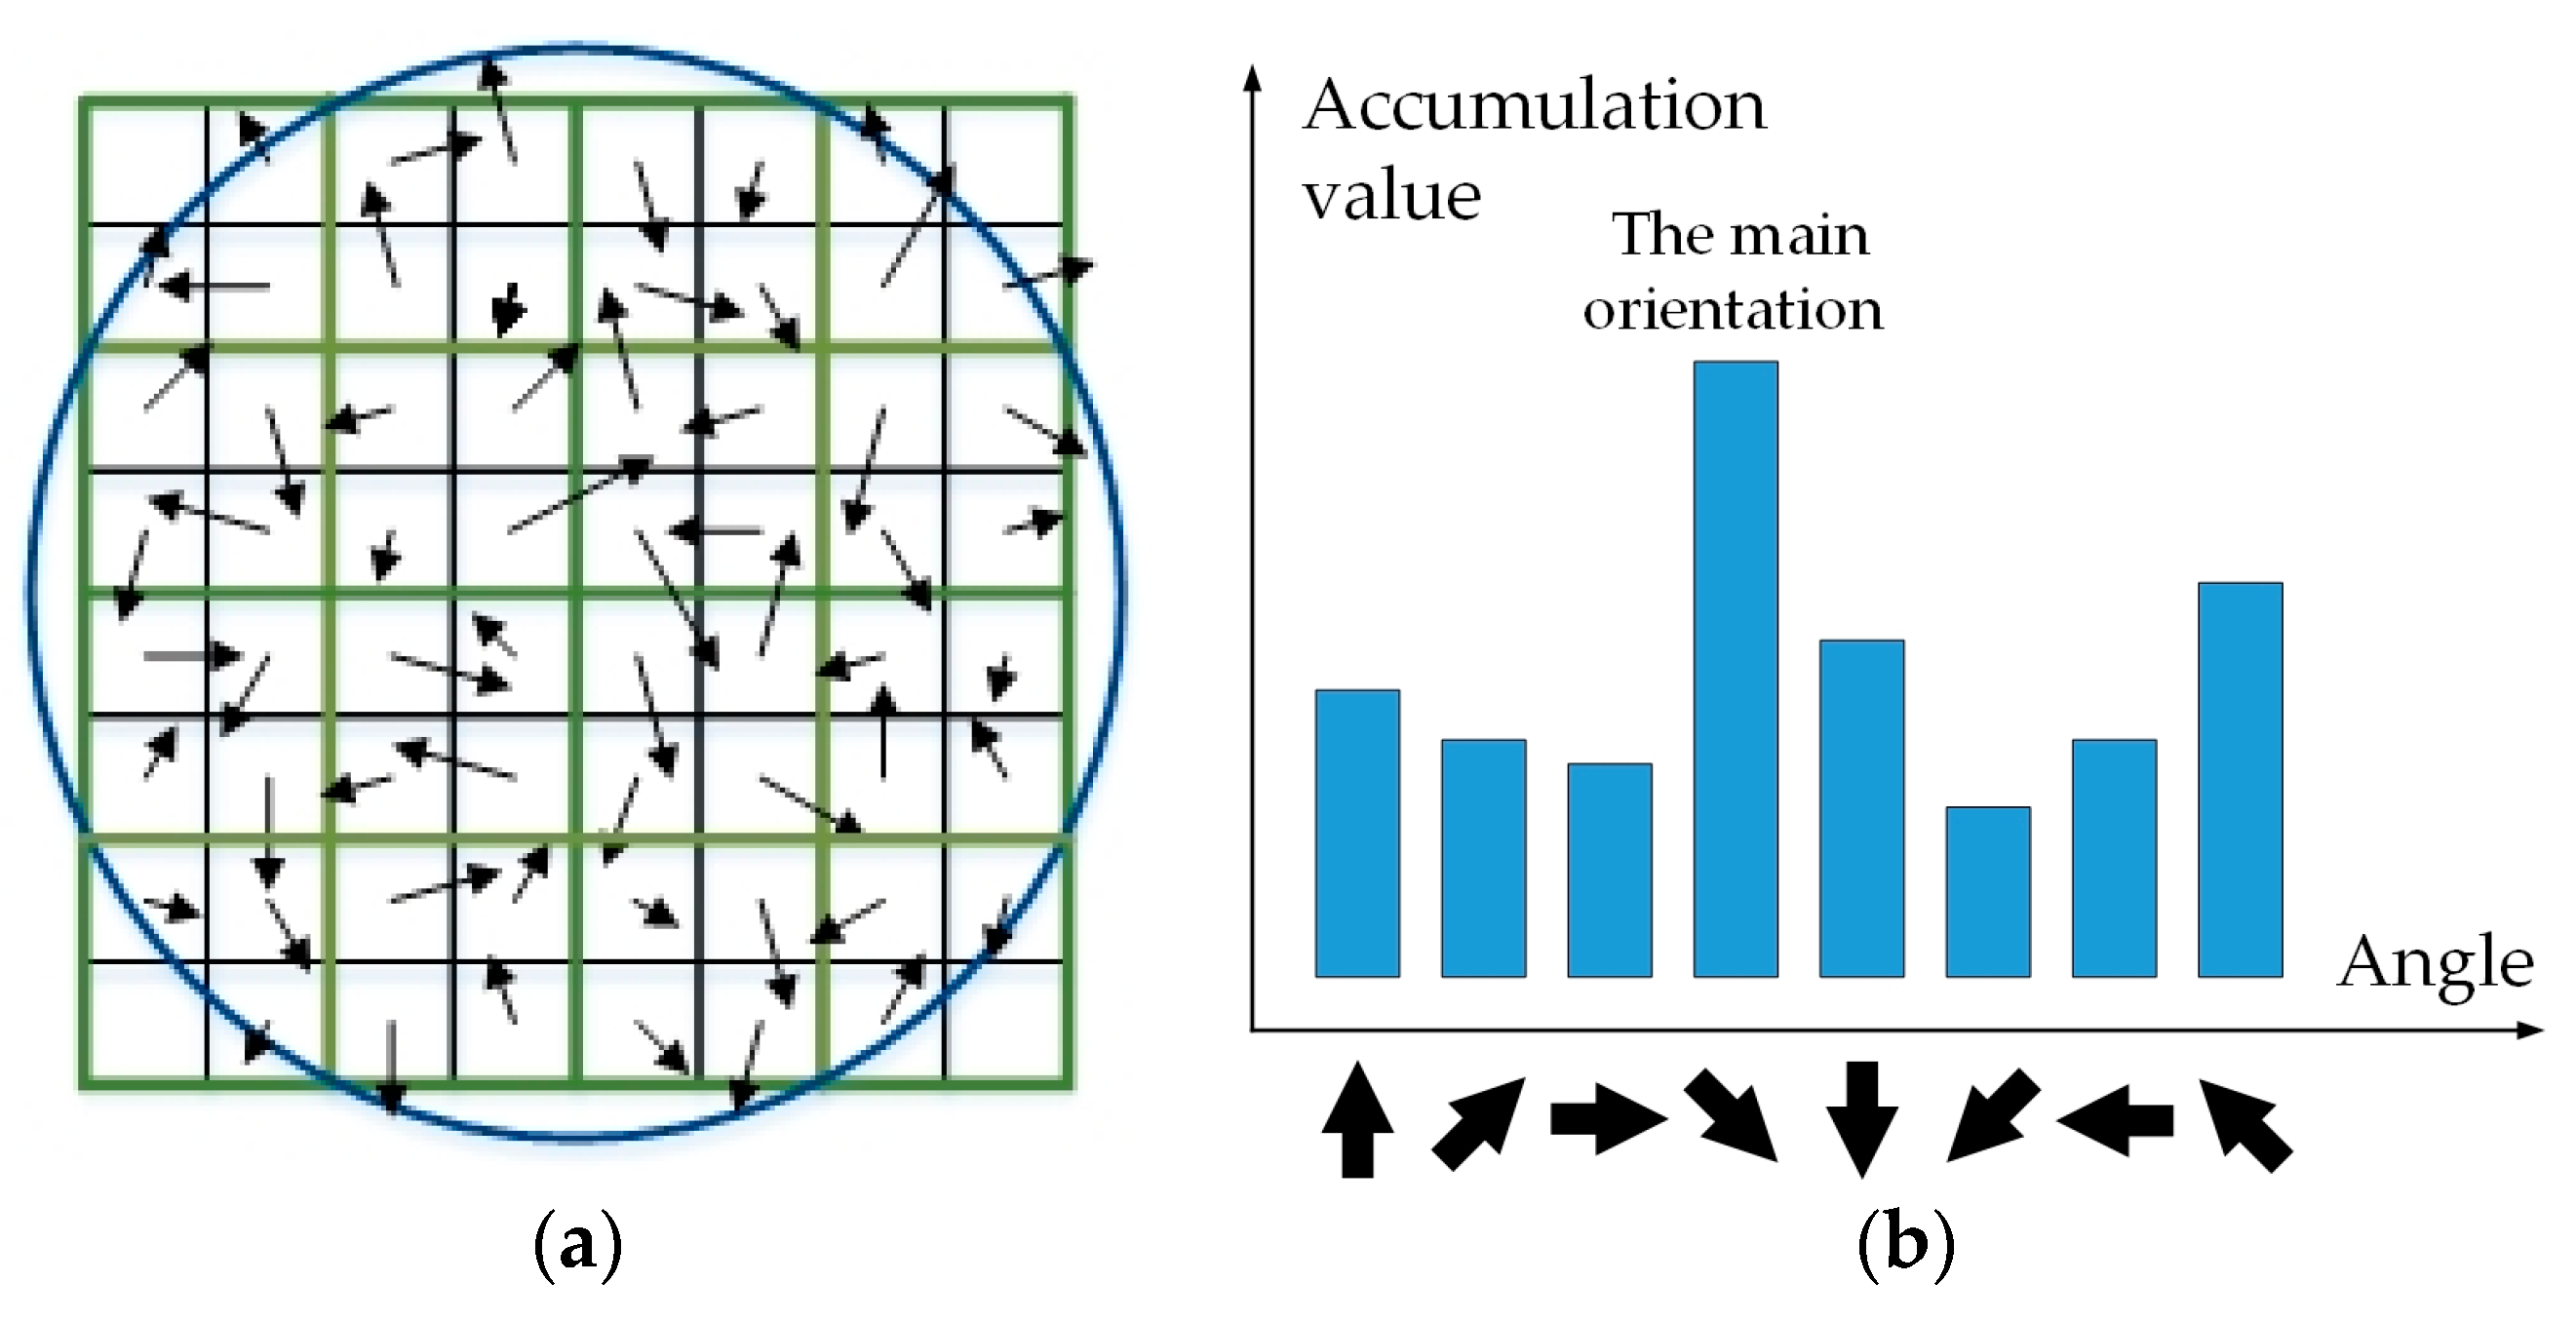
In the scale space, each sample point is compared to its eight neighbors in the current image and nine neighbors in the scale above and below to detect the extreme point representing a scale-invariant feature point, and the gradient distribution characteristics within the neighborhood of a feature point are illustrated in
Figure 2a. The statistical gradient information of the neighborhood is represented by a gradient direction histogram shown in
Figure 2b, and the peak of the histogram serves as the main orientation of the feature point. Feature points extracted by SIFT algorithm are rotation-invariant and scale-invariant and are dense feature points.
2.2. Image Feature Matching Algorithm
After extracting a large number of SIFT features from two frames of images, feature matching is performed to identify the same points in both frames. Frequently used feature matching methods are the Brute Force (BF) matching algorithm and the FLANN algorithm [
23]. FLANN can quickly locate the nearest neighbors to search similar feature descriptors and perform matching and is more often used in feature matching applications that demand a large number of feature points. FLANN constructs an index for all feature descriptors in the reference image and automatically selects the nearest neighbor based on the characteristics of the feature descriptor set. For each feature descriptor in the detected image, FLANN searches for the nearest neighbor from the established index, finding the most similar feature descriptor in the reference image. FLANN performs an approximate search instead of accurate matching, so the absolute accuracy of the matching cannot be guaranteed for the nearest neighbor it finds, which can meet the requirements of traditional image processing. The approximations between two feature vectors in feature nearest neighbor search are measured by the Euclidean distance, which is expressed as:
where
x1i and
x2i (
i = 1, 2, …, 128) are the coordinates of the 128-dimensional feature vectors in the two images, respectively. In the FLANN algorithm, the shorter the Euclidean distance between two feature vectors, the more similar these two feature vectors. When this distance is zero, the two features are identical. The FLANN algorithm performs well in terms of accuracy and efficiency in high-dimensional feature matching, meeting the requirements in real-time health monitoring and also maintaining a sufficient number of feature point matches.
2.3. Mismatch Mechanism and Causes of Mismatch Analysis in SIFT Algorithm
SIFT and FLANN can still perform well in feature point extraction and matching with varying shooting angle, distance, and illumination during image capture. However, slight image grayscale variations inevitably change the value of feature point descriptors, and the distances between corresponding points in two images are not zero. Therefore, if the distance between two features is small enough, and if the ratio of the nearest neighbor distance
d1 to the second nearest neighbor distance
d2 satisfies:
where
τ is usually taken as 0.8, and it is considered as the nearest neighbor matching.
FLANN is an approximation algorithm and may lead to matching errors, and SIFT features are multiple scale features imperceptible to the human eye, making it difficult to check and interpret matching outliers in practical applications.
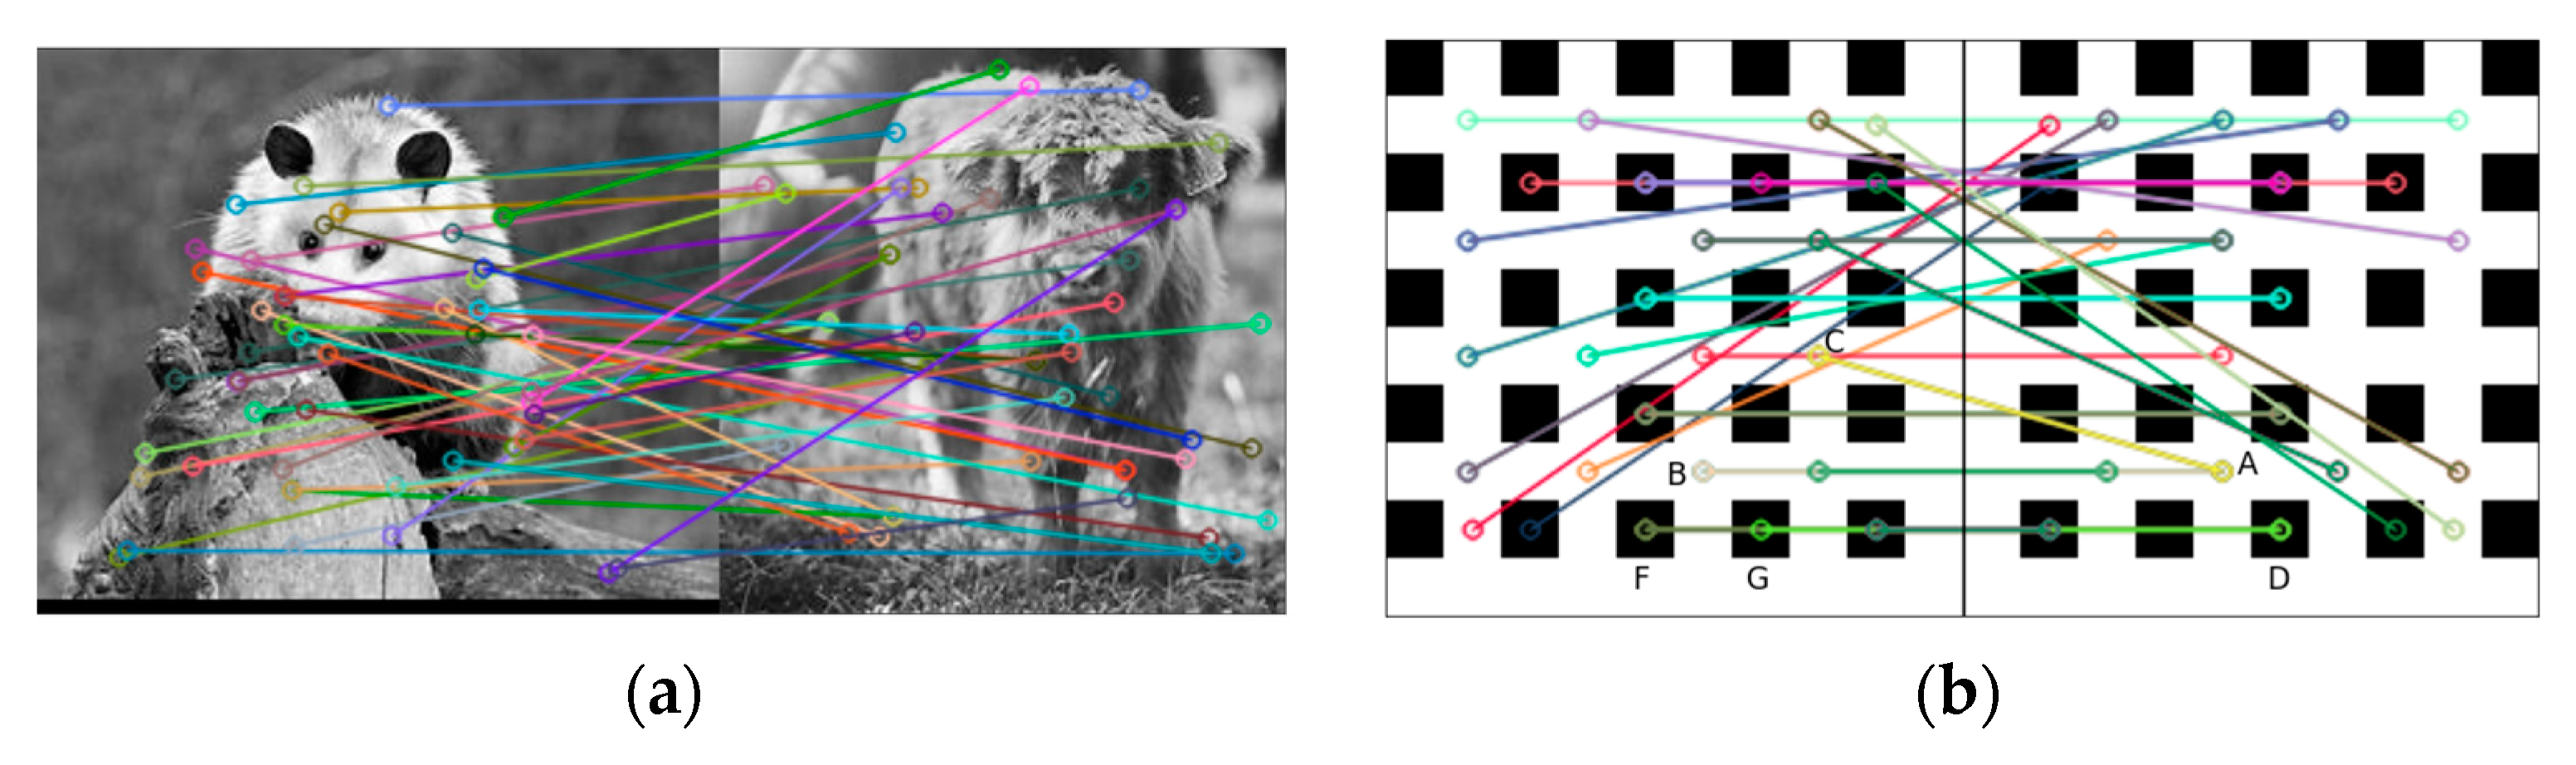
Moreover, numerous matches can be obtained even between two completely unrelated images of a panda and a calf, as shown in
Figure 3a, which are inexplicable, meaningless, or even absurd. In
Figure 3b, the left and right parts are symmetric along the central axis, and the right part can be obtained by clockwise rotating the left part by 90 degrees. There are ambiguities in matching results between the two parts of the image, and the symmetry or the rotation of the matching results is inconsistent. For example, point A and point D both have two matching results and show the presence of mismatches.
The mismatches generated by the aforementioned feature extraction and matching methods can lead to errors in structural deformation measurement, which require high accuracy and unique matches. Therefore, it is essential to introduce more explicit constraints to remove the mismatches and ensure the accuracy of structural displacement measurements.
3. Structural Full-Field Dynamic Deflection Measurement Method Based on Dense Feature Mismatch Removal
A sufficient number of markers pre-installed on structures is a prerequisite for structural health monitoring and damage localization [
24,
25]. In machine vision method, feature extraction and tracking algorithms such as Shi–Tomasi can extract only a finite number of feature points, which limits their application in structural health monitoring. Therefore, it is necessary to develop dense feature extraction and matching algorithms to trace the motion of a large number of displacement measurement points. The feature extraction method based on SIFT and FLANN matching may lead to mismatches and errors in structural displacement measurement. This paper proposes a full-field dynamic structural deflection measurement method by dual-step mismatch removal (DSMR) of the RANSAC algorithm and Structural Displacement Continuity Constraints (SDCCs).
3.1. Coarse Mismatch Removal Using RANSAC
The RANSAC algorithm [
26] is a method based on the principles of probability theory to remove outlier data. The best model to describe the data was achieved through iterative correction, and it can retain the corresponding correct data and minimize the influence of noise and outliers. The number of iterations
n in RANSAC is calculated as follows:
where
ε is the proportion of outliers in the data,
p is the expected probability, and
s is the minimum number of samples required to estimate the model. RANSAC randomly selects
s points from all data to estimate the model and calculates the points that fit the current estimated model. When the number of points exceeds the threshold set or the iteration number reaches the upper limit, the correcting process stops, and the output information is contained in the best model.
In structural motion detection, the RANSAC algorithm can remove a large number of feature point pairs whose displacement is clearly different from that of correct matches, achieving the elimination most of the mismatches after SIFT feature extraction and FLANN matching. However, it is a statistical mismatch removal method, and the iterative model process is random, the outlier data cannot be completely removed, and further removal should be introduced.
3.2. Secondary Removal of Feature Mismatches Based on SDCCs
With the matched feature set obtained after coarse removal with the RANSAC method, the displacements of these feature points can be calculated, and wrong displacements reveal that mismatched feature points pairs still exist, for example, point G in
Figure 3b, which can be effectively removed with prior information of structural displacement. Prior knowledge of structural displacement is the information of the structural geometric size, mechanical properties, and external load distribution, for example, the displacement direction, distribution, and angle of measured points. The prior information can be utilized in the analysis and evaluation of the feature point displacement calculated and can be utilized to effectively remove the remaining mismatches. The continuity assumption is a fundamental deformation hypothesis in structural mechanics assuming that the object maintains continuum during deformation without cracking or overlapping, or the displacements of adjacent measurement points within an infinitesimal range are continuous and uninterrupted.
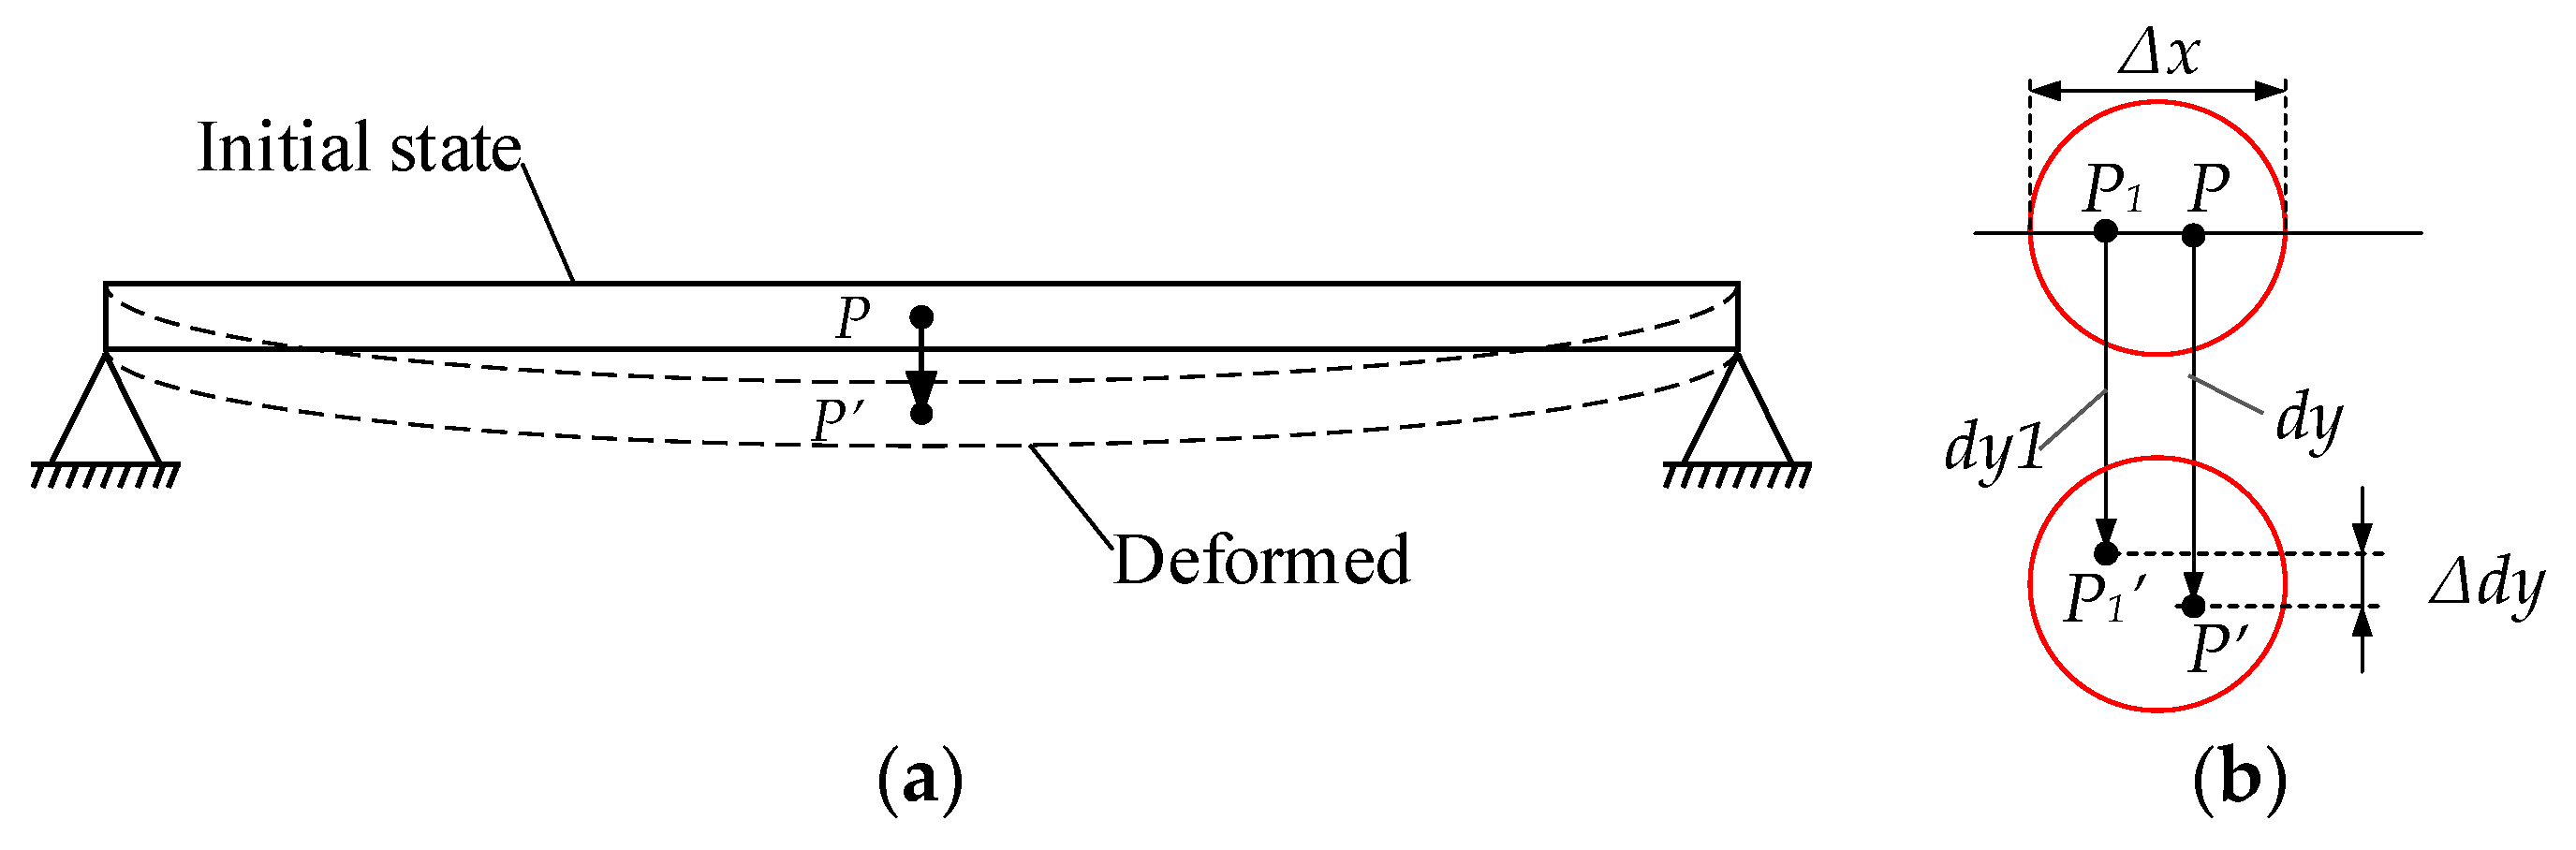
Taking the example of a cantilever beam in the initial and deformed states shown in
Figure 4a, where the initial point
P deforms to
P’, and any point
P1 within an infinitesimal range ∆
x around this point deforms to
P1’ as shown in
Figure 4b. The difference ∆
dy between the vertical deformations
dy1 and
dy of these two points should be approximately zero, according to the continuity deformation assumption; that is:
For continuous medium deformation, the continuity assumption within an infinitesimal region can also be expressed in strict terms of displacement
d, angle
θ, and curvature
κ:
The above conditions of Equation (7) are called the Structural Displacement Continuity Constraints (SDCCs), and multiple constraint conditions need to be introduced to completely remove mismatches. When the dimensions, material properties, and external loads are known, the maximum deformation
D of the beam structure can be calculated by the relevant theorems and formulas of material mechanics, and the feature points whose displacements are larger than D should be considered mismatches. For simplicity, the vertical displacements
dy1,
dy2, and Δ
dy are calculated from two adjacent feature points and establish structural vertical displacement consistency constraints in the spatial field, referring to Equation (5) as follows:
where
ε is a value lower than
D and can be empirically selected between 0 and
D. In structural vertical displacement consistency constraints, the value of
ε should be taken according to the specific experimental situation or actual project situation, and it indicates the displacement difference of two adjacent feature points or the continuity of the displacement field. The smaller the value of
ε, the stricter the requirements. Theoretically, a value of
ε less than 0.5
D can obtain good results. However, excessively strict requirements of ε does not lead to more precise results, and a smaller value of
ε will lead to the removal of some the feature matching pairs with good accuracy as mismatches, which will result in the sparsity of final retained feature pairs and is unfavorable for high-precision full-field displacement measurement.
Similarly, for the same feature point, the displacements calculated from two consecutive frames in the image sequence are
dy1t and
dy2t, and the structural displacement consistency constraints in the temporal field can also be established as:
where
εt is the temporal empirical value.
3.3. Structural Full-Field Dynamic Deflection Measurement Method Based on DFEM-DSMR
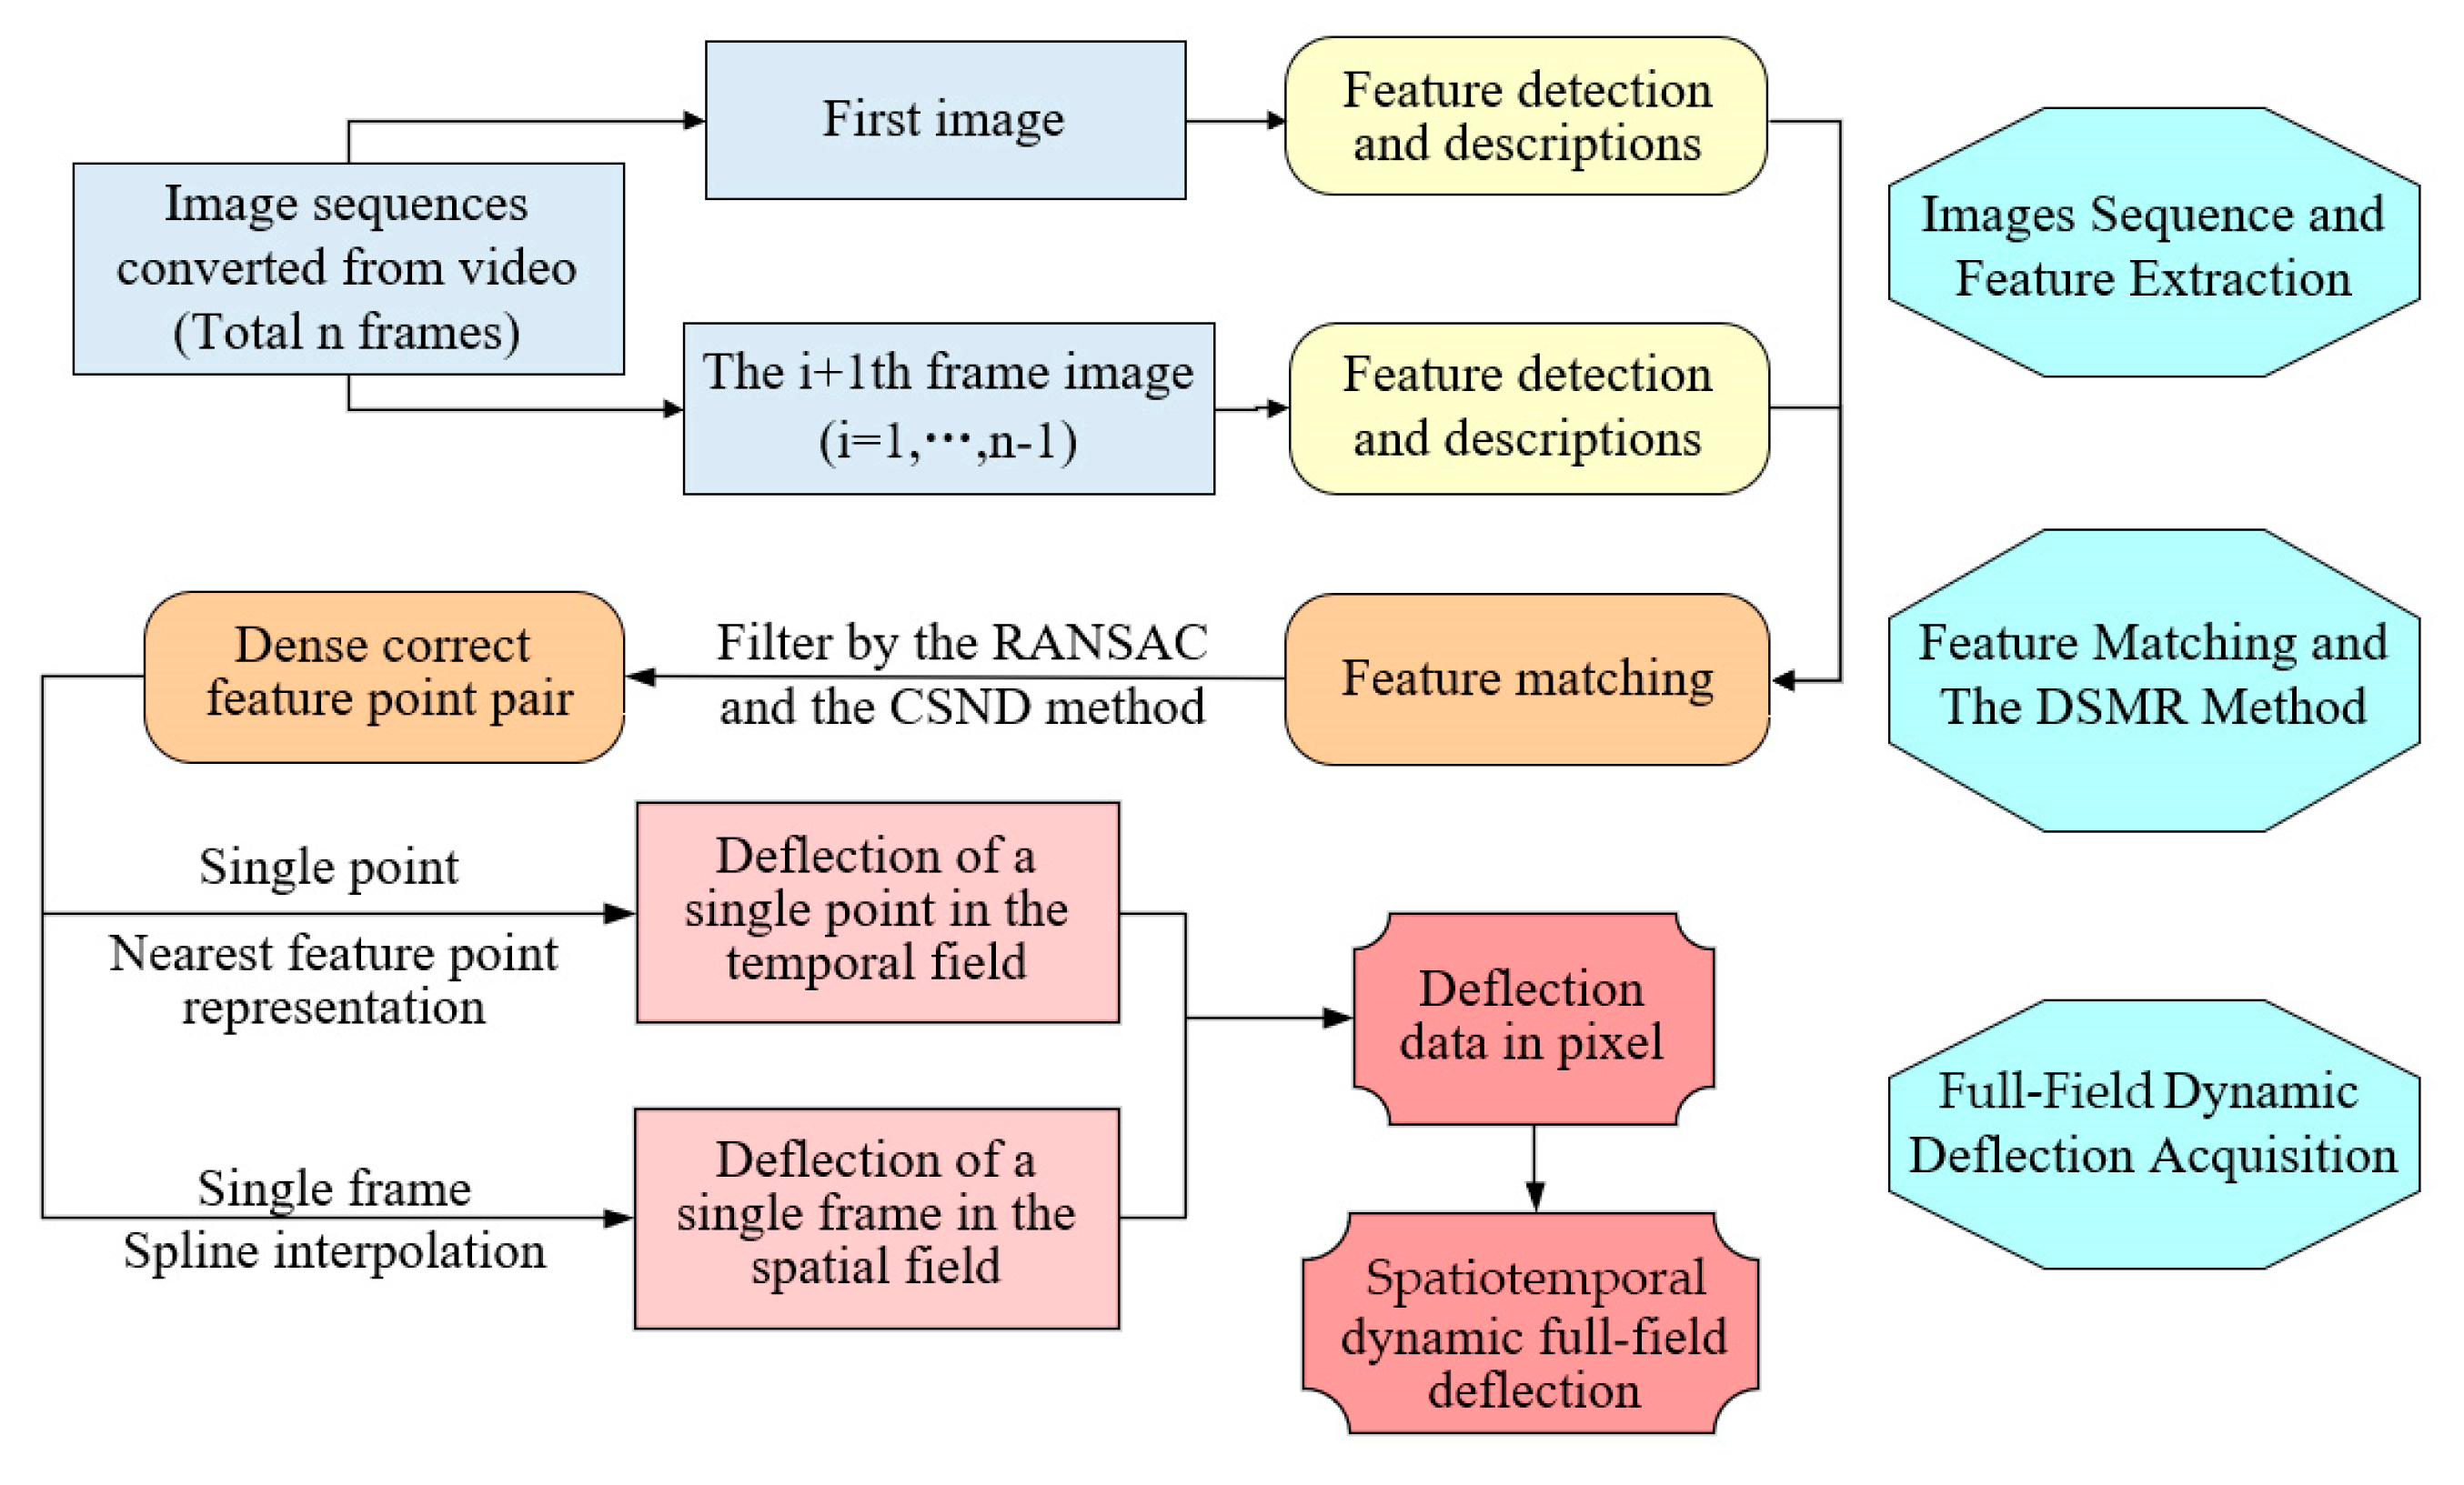
After SIFT feature extraction and FLANN matching, the DSMR can effectively remove mismatched feature pairs in dense feature matching, the displacements can be calculated from the dense feature points, and the method is called as dense feature extraction and matching with dual-step mismatch removal (DFEM-DSMR). The DFEM-DSMR method can measure the structural full-field dynamic deflection and can plot dynamic deflection–time curves for any location of the structure as well as the deflection curves of the entire structural spatial field at any time. The process of high-precision extraction of structural full-field dynamic deflection based on DFEM-DSMR is illustrated in
Figure 5.
4. Indoor Dynamic Beam Deflection Measurement Experiment and Validation
To validate the proposed method for structural full-field dynamic deflection measurement, an indoor cantilever vertical beam vibration experiment was conducted, and results were compared with those of the Digital Image Correlation (DIC) method.
4.1. Cantilever Vertical Beam Vibration Experiment Setup
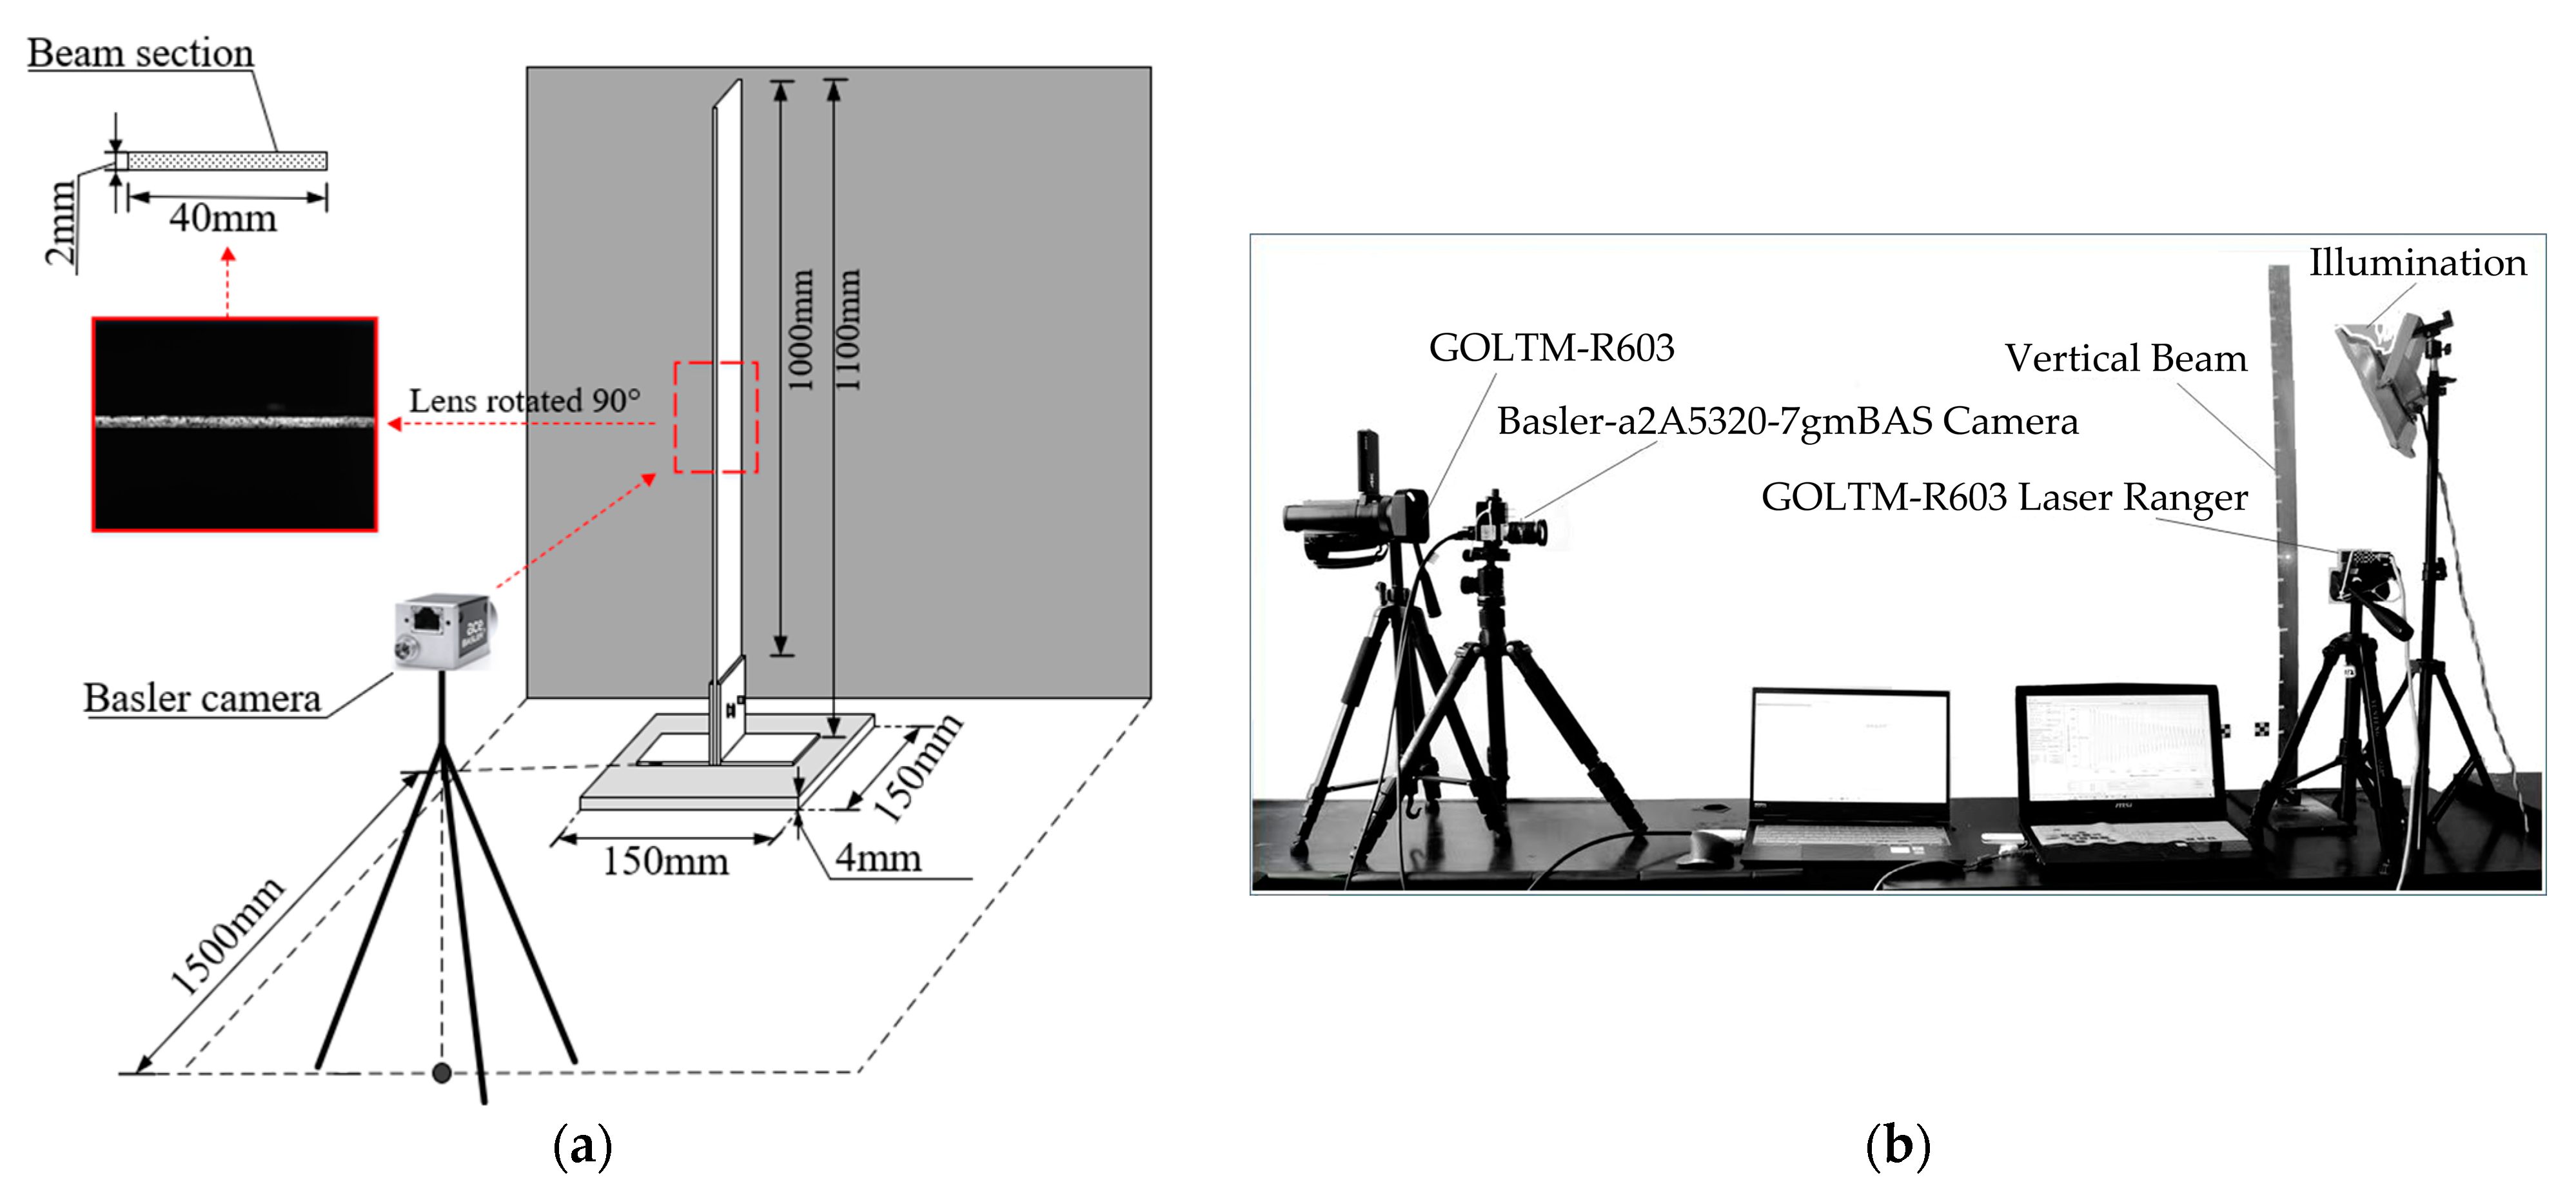
In the indoor full-field dynamic deflection experiment, a Basler a2A5320-7gmBAS industrial camera was used to measure the displacement of a 100 cm long cantilever vertical beam, and the location of the beam and the camera as well as the geometric size and connection are shown
Figure 6a. The experimental equipment and the structure on site are shown in
Figure 6b, and the equipment types and parameters are listed in
Table 1. Vibration was stimulated by excitation (lateral impact with a hammer) at the top of the steel cantilever beam, and the camera captured the image sequence of the mid-span section at a distance of 1.5 m from the cantilever beam, with the camera lens parallel to the ground for orthogonal shooting. In the proposed method, the SIFT algorithm can rely solely on the texture information of the image to detect feature points, while speckles were prefabricated on the beam surface in the experiment to facilitate the operation of the DIC method for validation purposes, for which the proposed method works well.
In the experiment, the 4096 pixels × 3072 pixels images were captured at the speed of 50 fps, and the image bit depth was 24. The thickness of the cantilever beam in the capture area was 2 mm, with 98 corresponding pixels in the image, and the orthogonal photogrammetric scale factor
s can be calculated as:
where
T is the thickness of the beam (mm) and
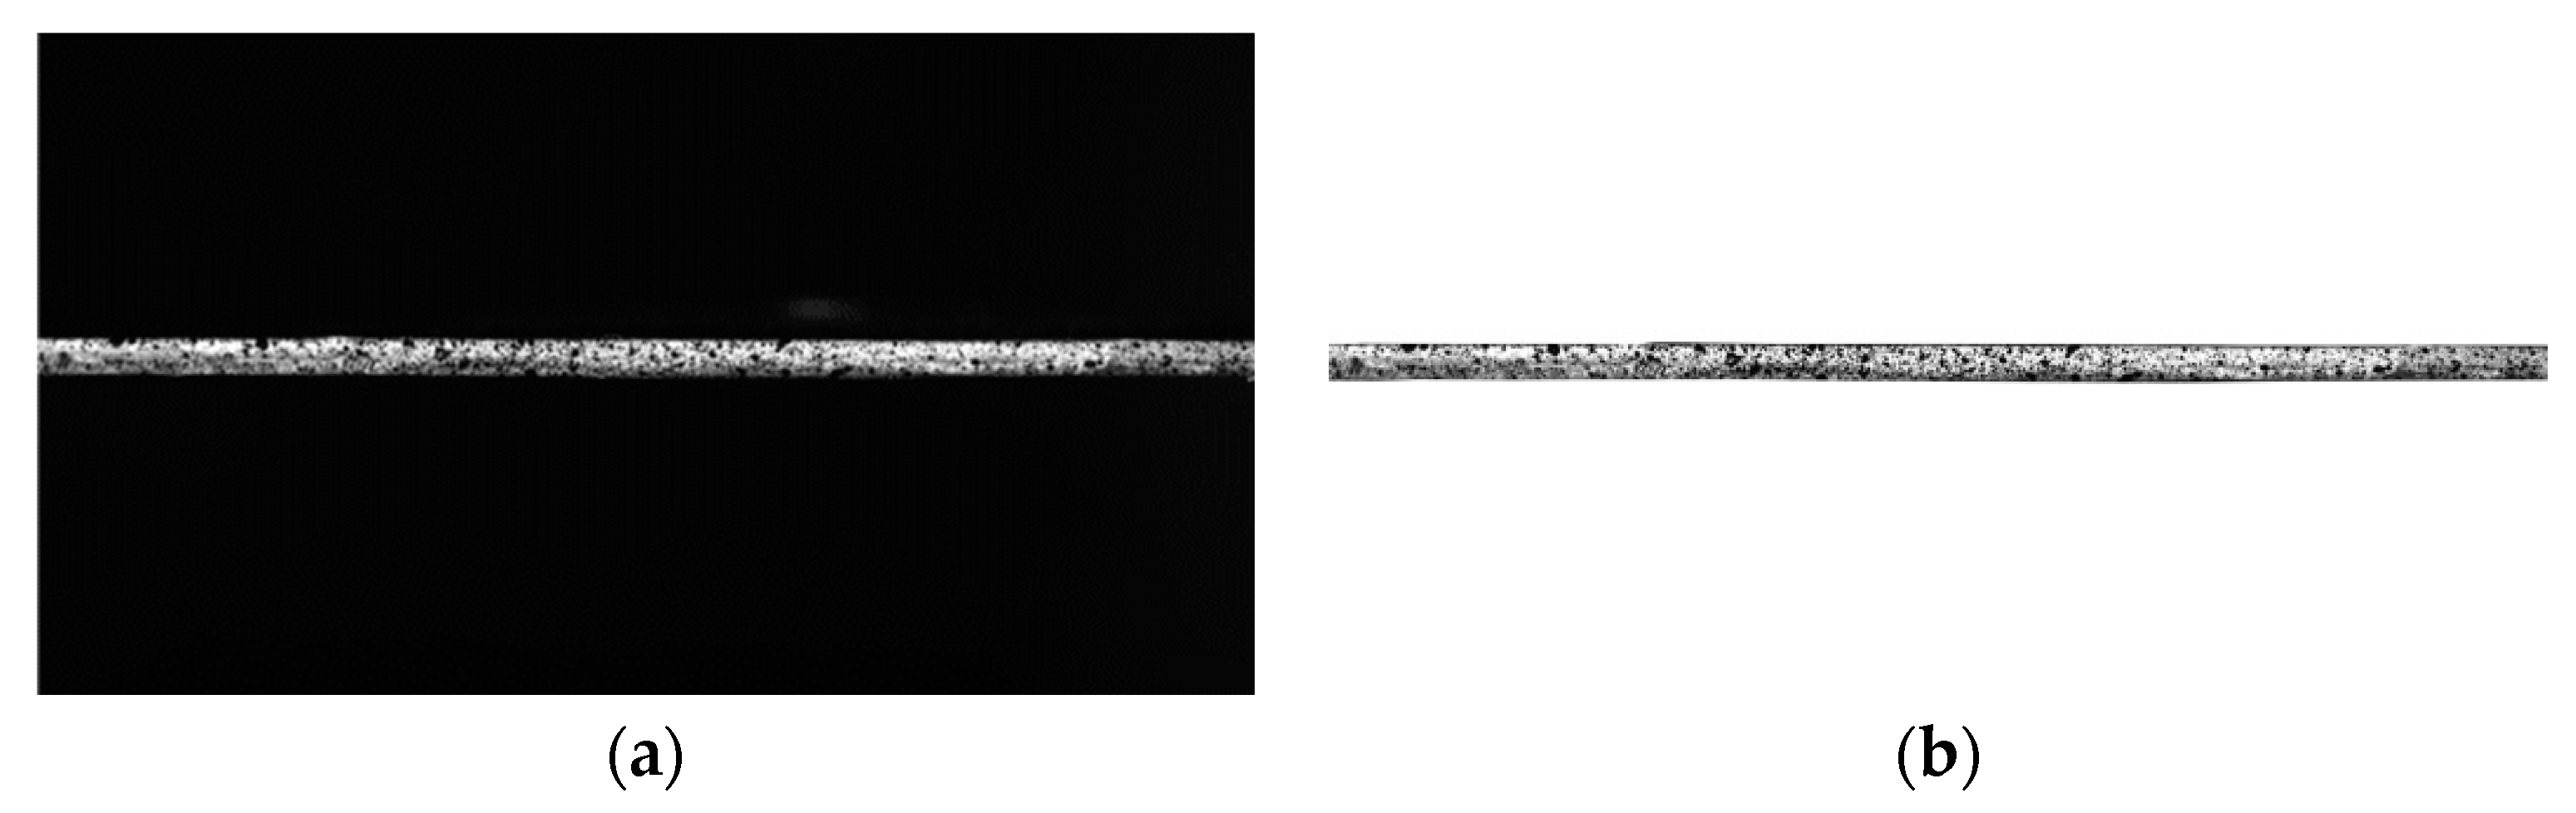
t is the pixel number of the thickness in the image. The calculated scale factor was 0.02 mm/pixel. In the experiment, an image sequence comprising 100 frames was captured. The 20th frame image is shown in
Figure 7a, and the image without the background is illustrated in
Figure 7b.
4.2. Structural Full-Field Dynamic Displacement Field Measurement
4.2.1. Dense Feature Point Extraction, Matching, and Dual-Step Mismatch Removal
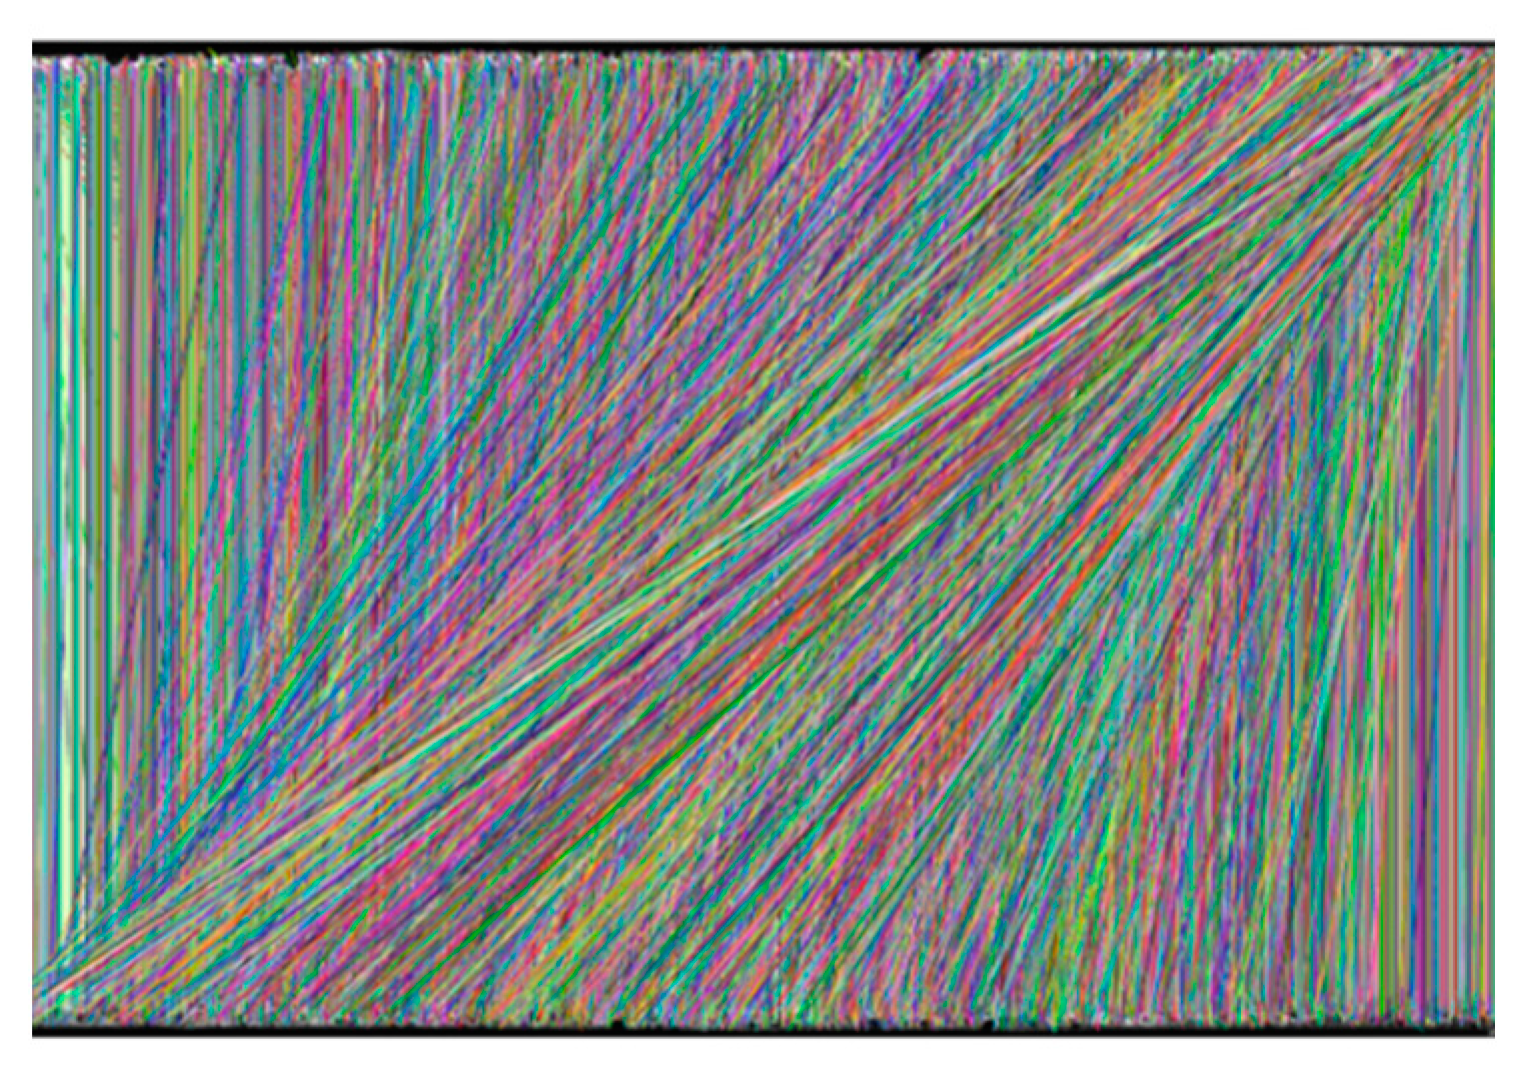
Using SIFT feature extraction and FLANN matching to measure the structural displacement between two images, a large number of feature matching pairs can be obtained. Taking the 1st and 20th frames as examples, the feature matching results between the two frames are shown in
Figure 8, with a total of 6838 pairs of matched features.
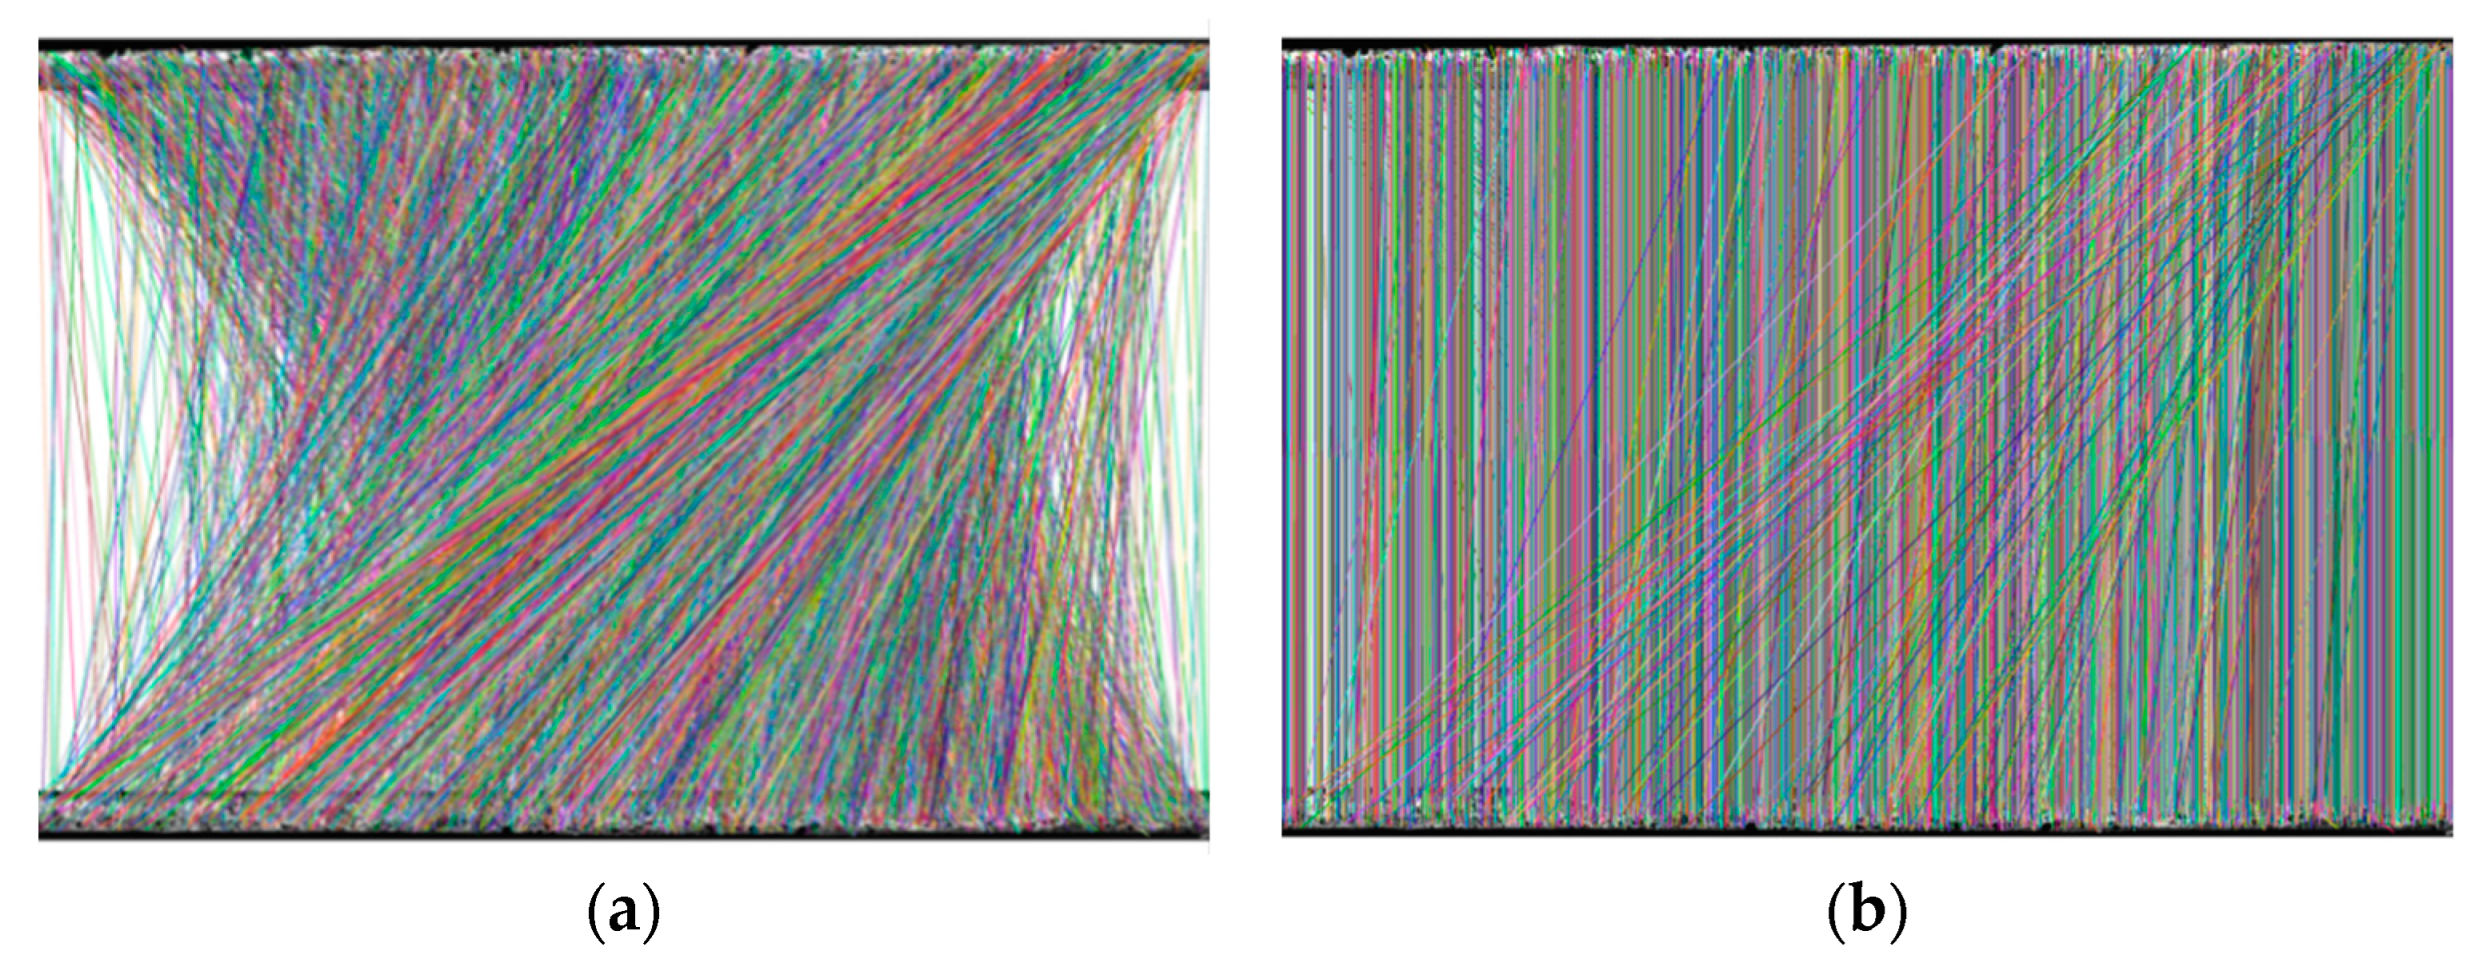
The RANSAC algorithm was applied to coarsely remove the mismatches from all 6838 pairs, and a total of 2513 mismatched pairs were removed, as shown in
Figure 9a. After the coarse mismatch removal, 4325 remaining matching pairs were left as shown in
Figure 9b.
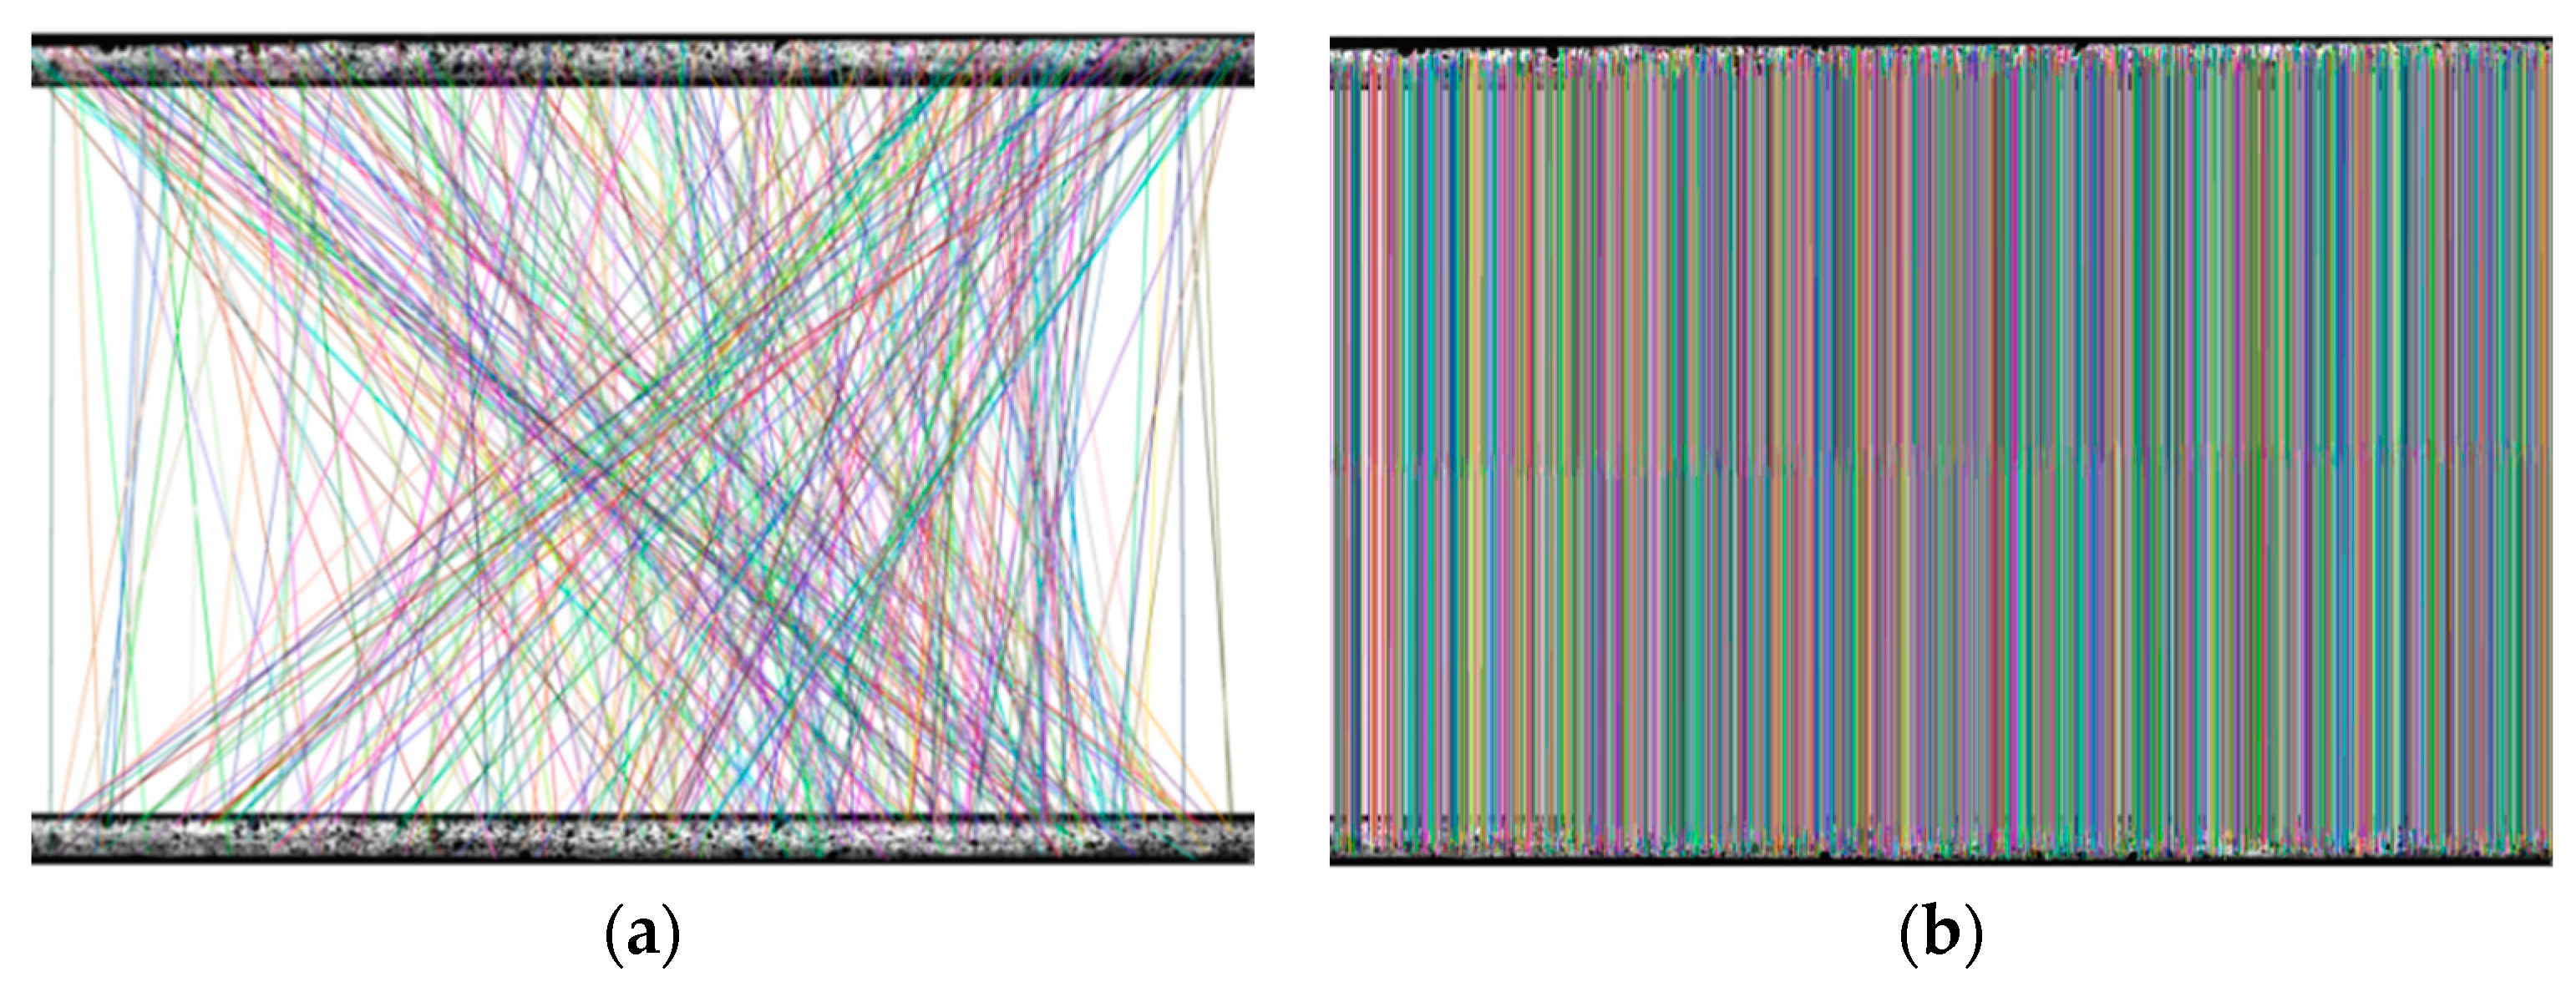
A secondary mismatch removal was further performed with the SDCC method, with a total of 1272 mismatch pairs being removed as shown in
Figure 10a and 3053 pairs with correctly matched feature points reserved as shown in
Figure 10b.
Results show that the DFEM-DSMR method significantly improves the matching accuracy, and there are no obvious mismatches remaining after DSMR mismatch removal. In outlier removal using DSMR, the number of mismatches removed by the RANSAC and the SDCC accounts for 36.75% and 18.60% of the total number of dense feature pairs (6838), respectively. To further illustrate the applicability and effectiveness of the DFEM-DSMR structural displacement measurement method, the 10th, 20th, 40th, 60th, 80th, and 100th frame image, corresponding to six different times of 0.2, 0.4, 0.8, 1.2, 1.6, and 2 s were analyzed and calculated, and the number of mismatches removed by the RANSAC and SDCC is shown in
Table 2.
4.2.2. Spatiotemporal Deflection Data Processing
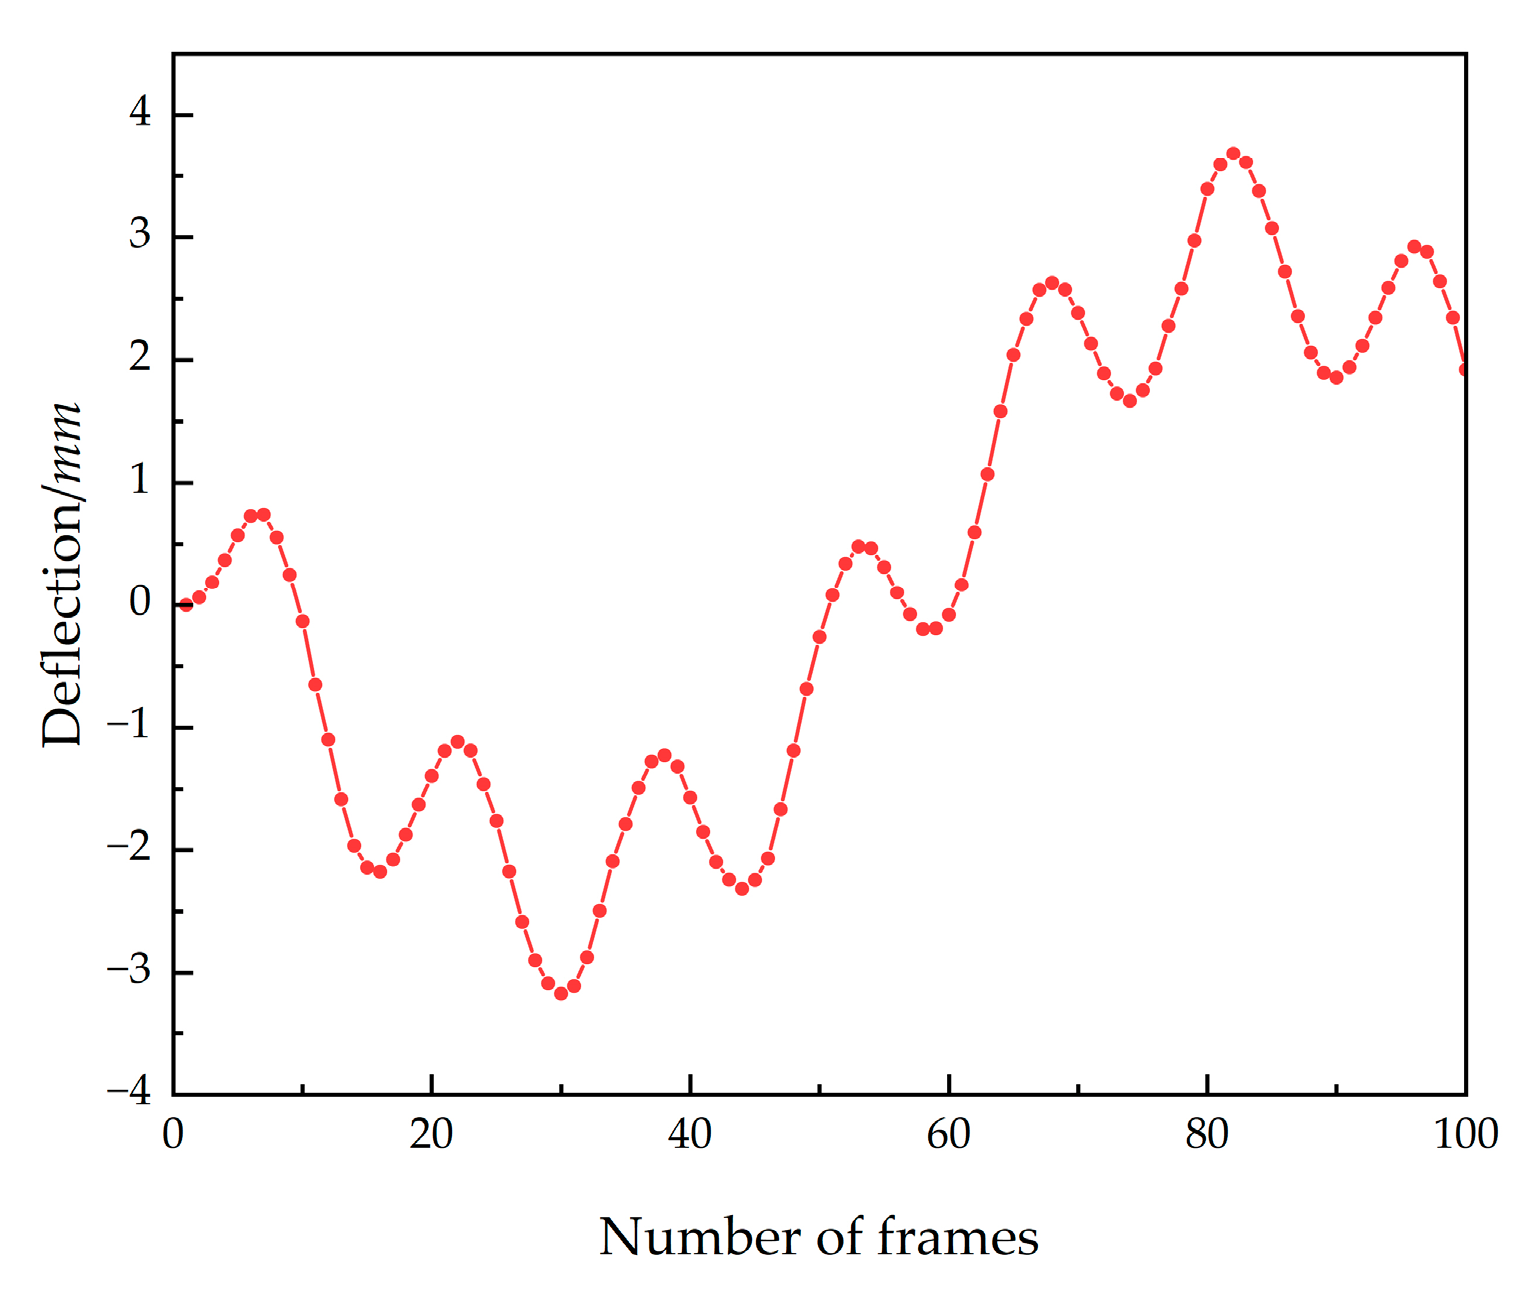
The high-precision displacement of a large number of densely measured points on the surface of vertical beams at different times can be achieved by the method proposed, and the deflection variation in a measured point in the temporal field was calculated; as an example, the displacement–time history curve of the mid-span point on the beam is plotted in
Figure 11.
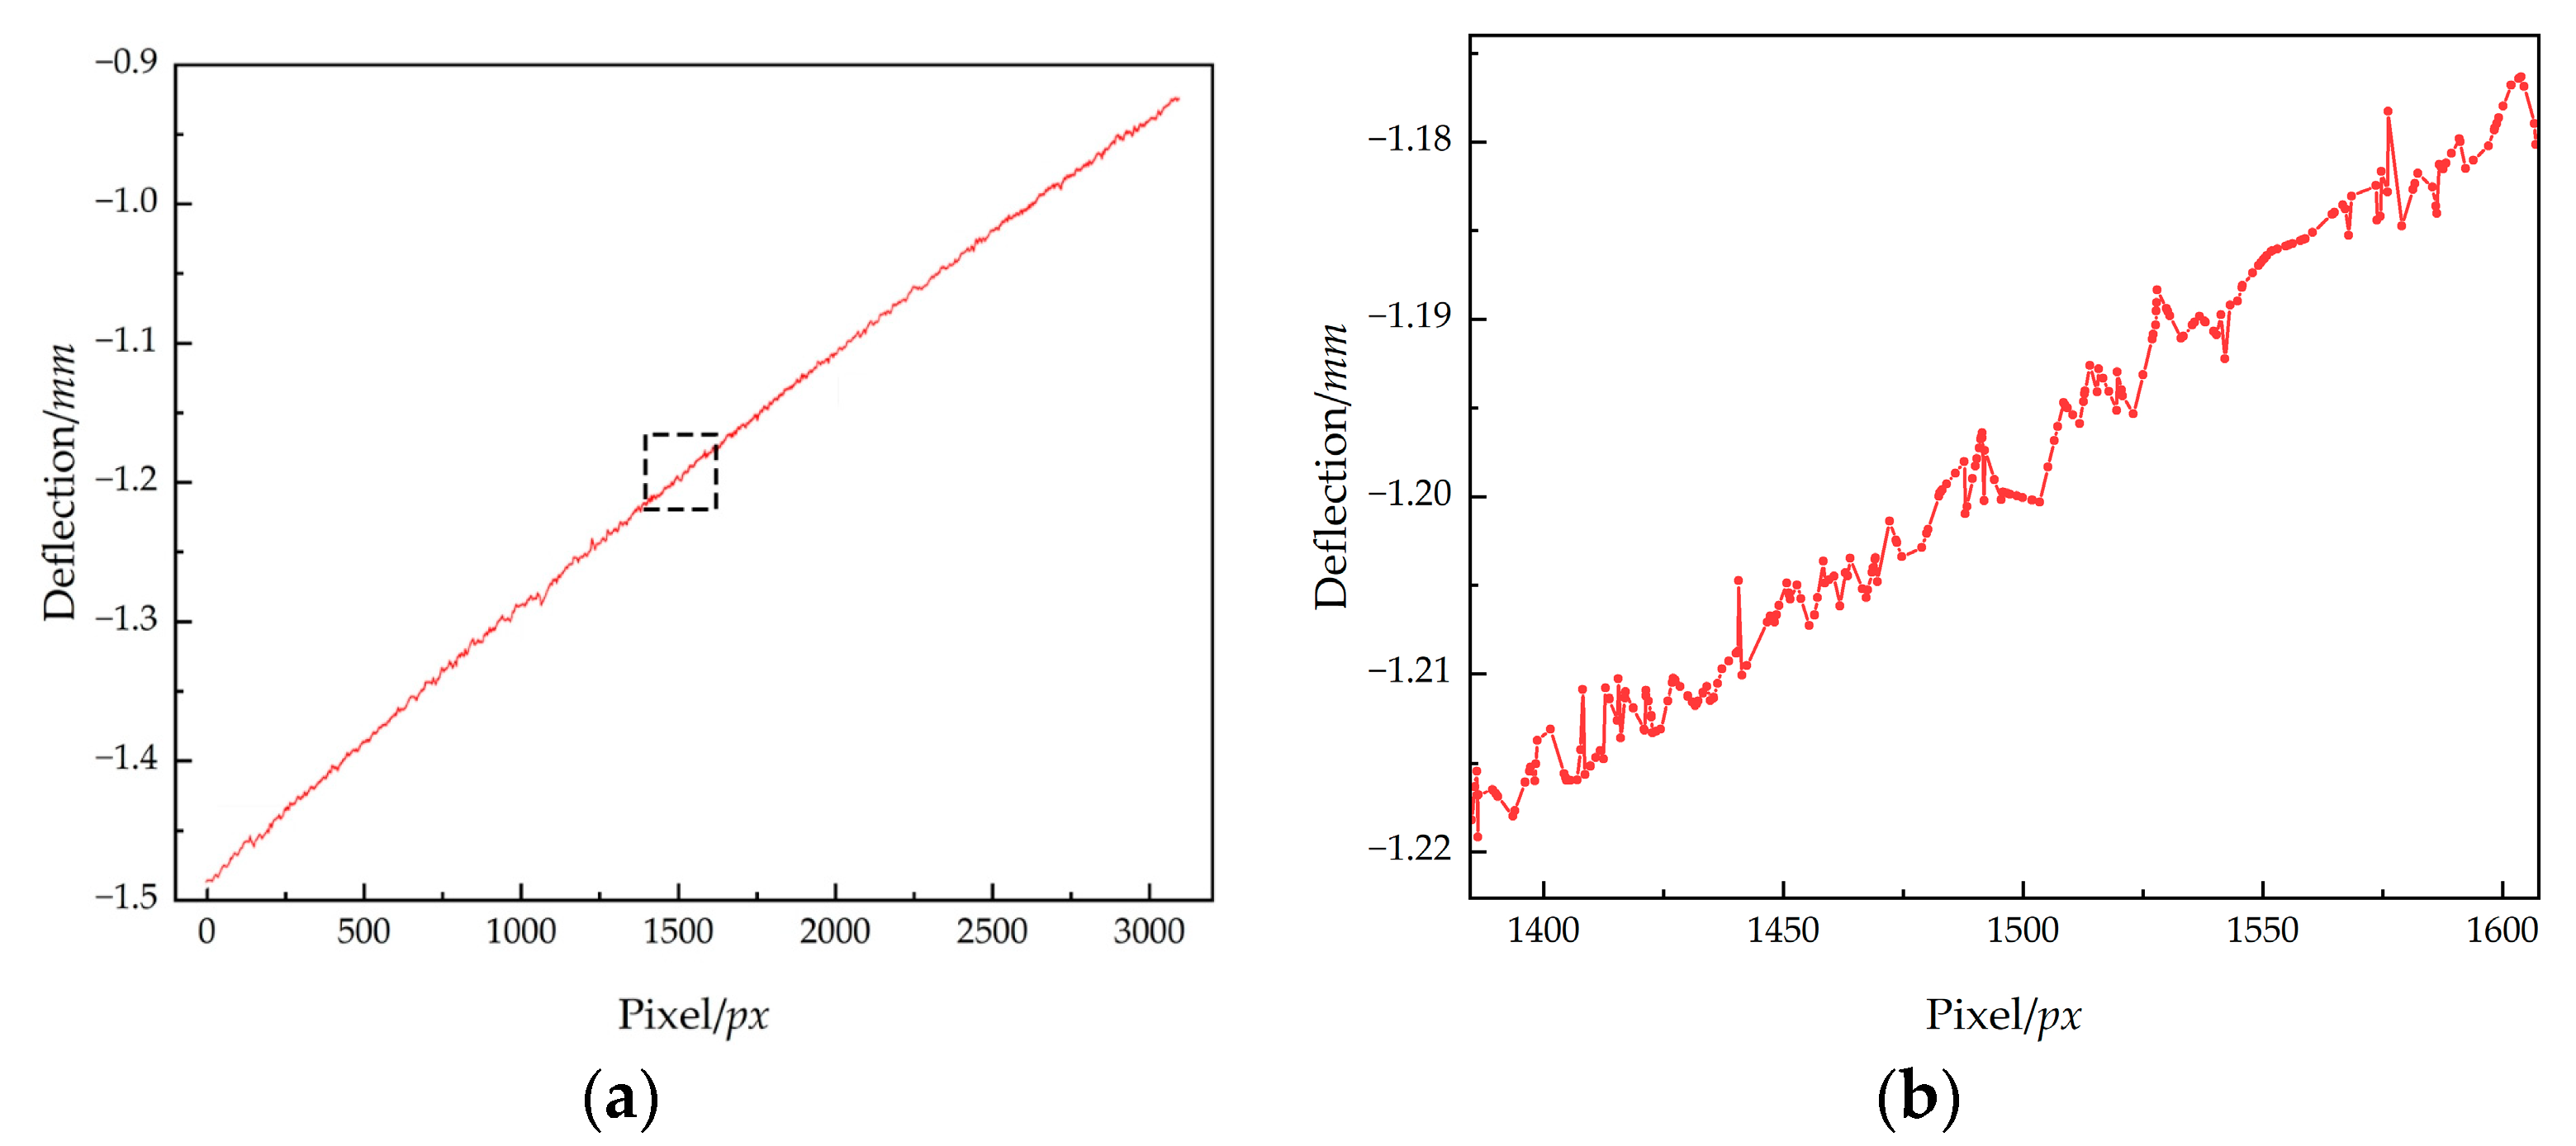
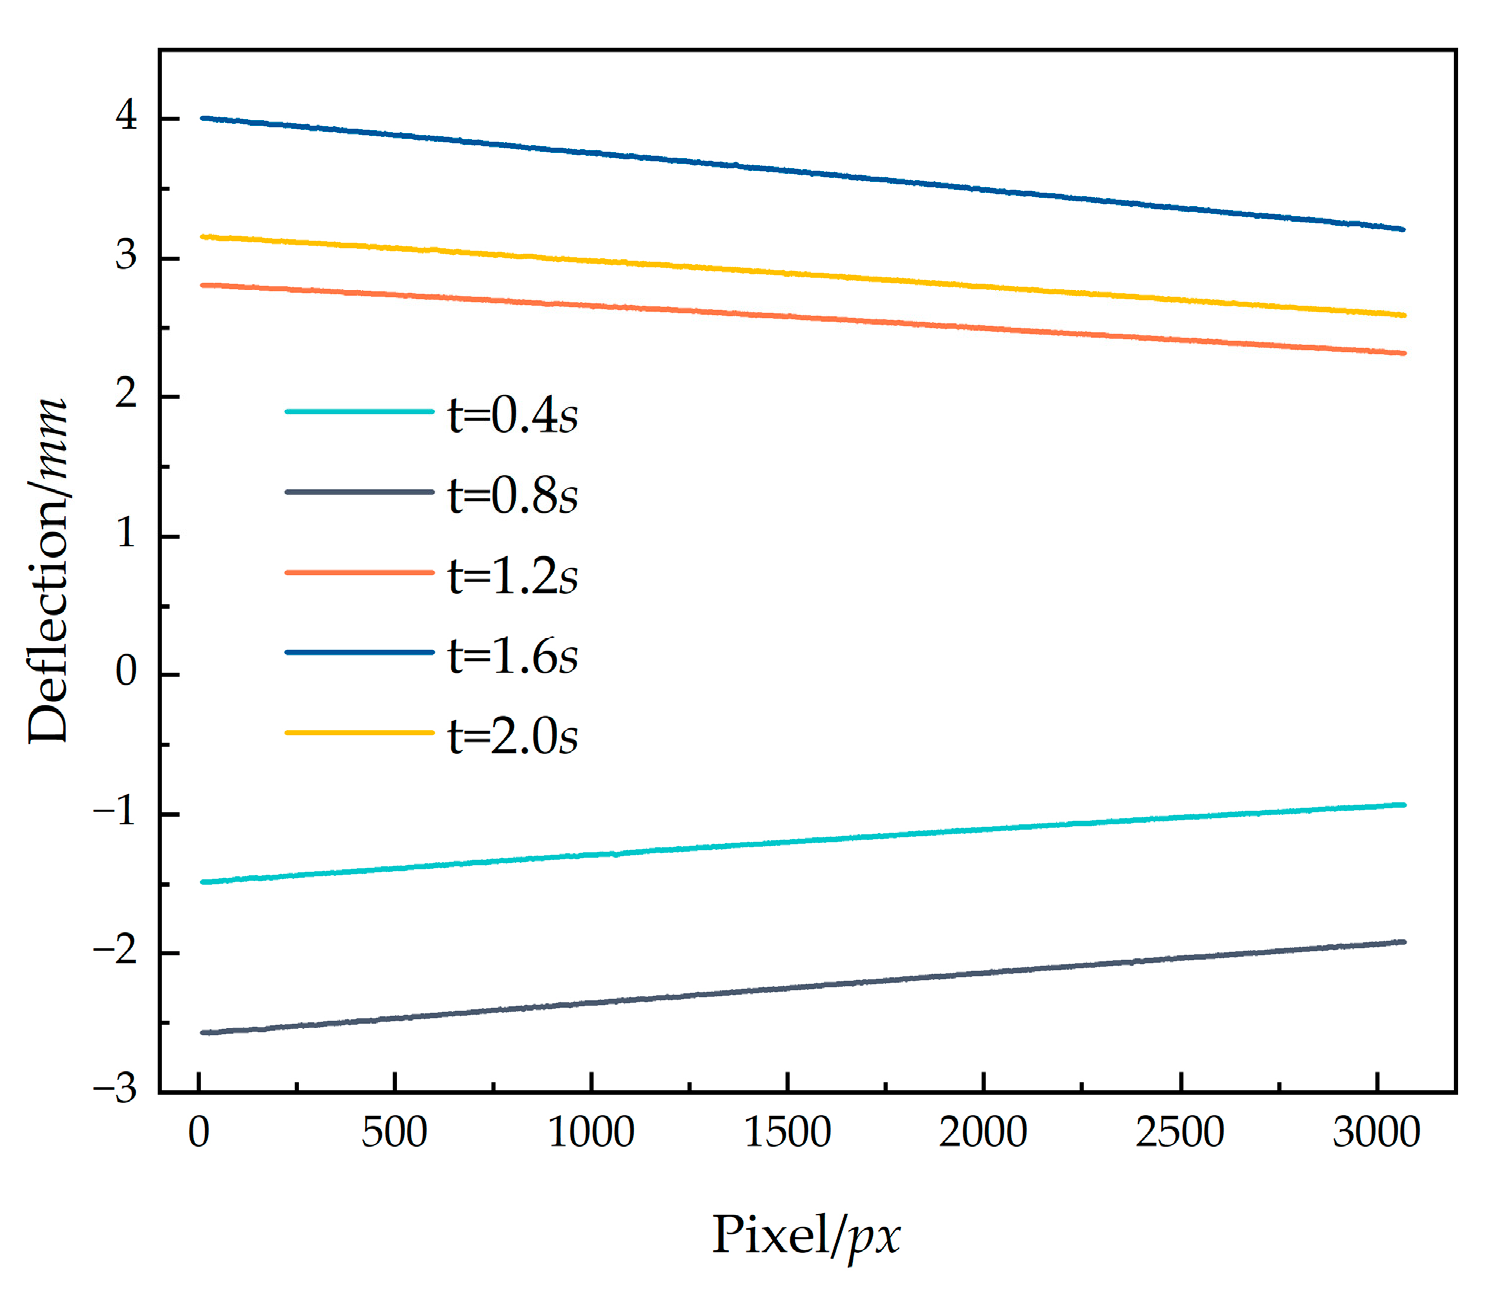
The spatial deflection along the beam at any time can also be calculated and extracted, and the deflection curve of the 20th frame is plotted as illustrated in
Figure 12, with an enlarged view of the local deflection curve with unevenness and discontinuity due to displacement measurement error in discrete data.
After polynomial fitting, continuous and uniform deflection curves at five times were obtained and are plotted in
Figure 13.
4.3. DIC Processing Result Comparison and Validation
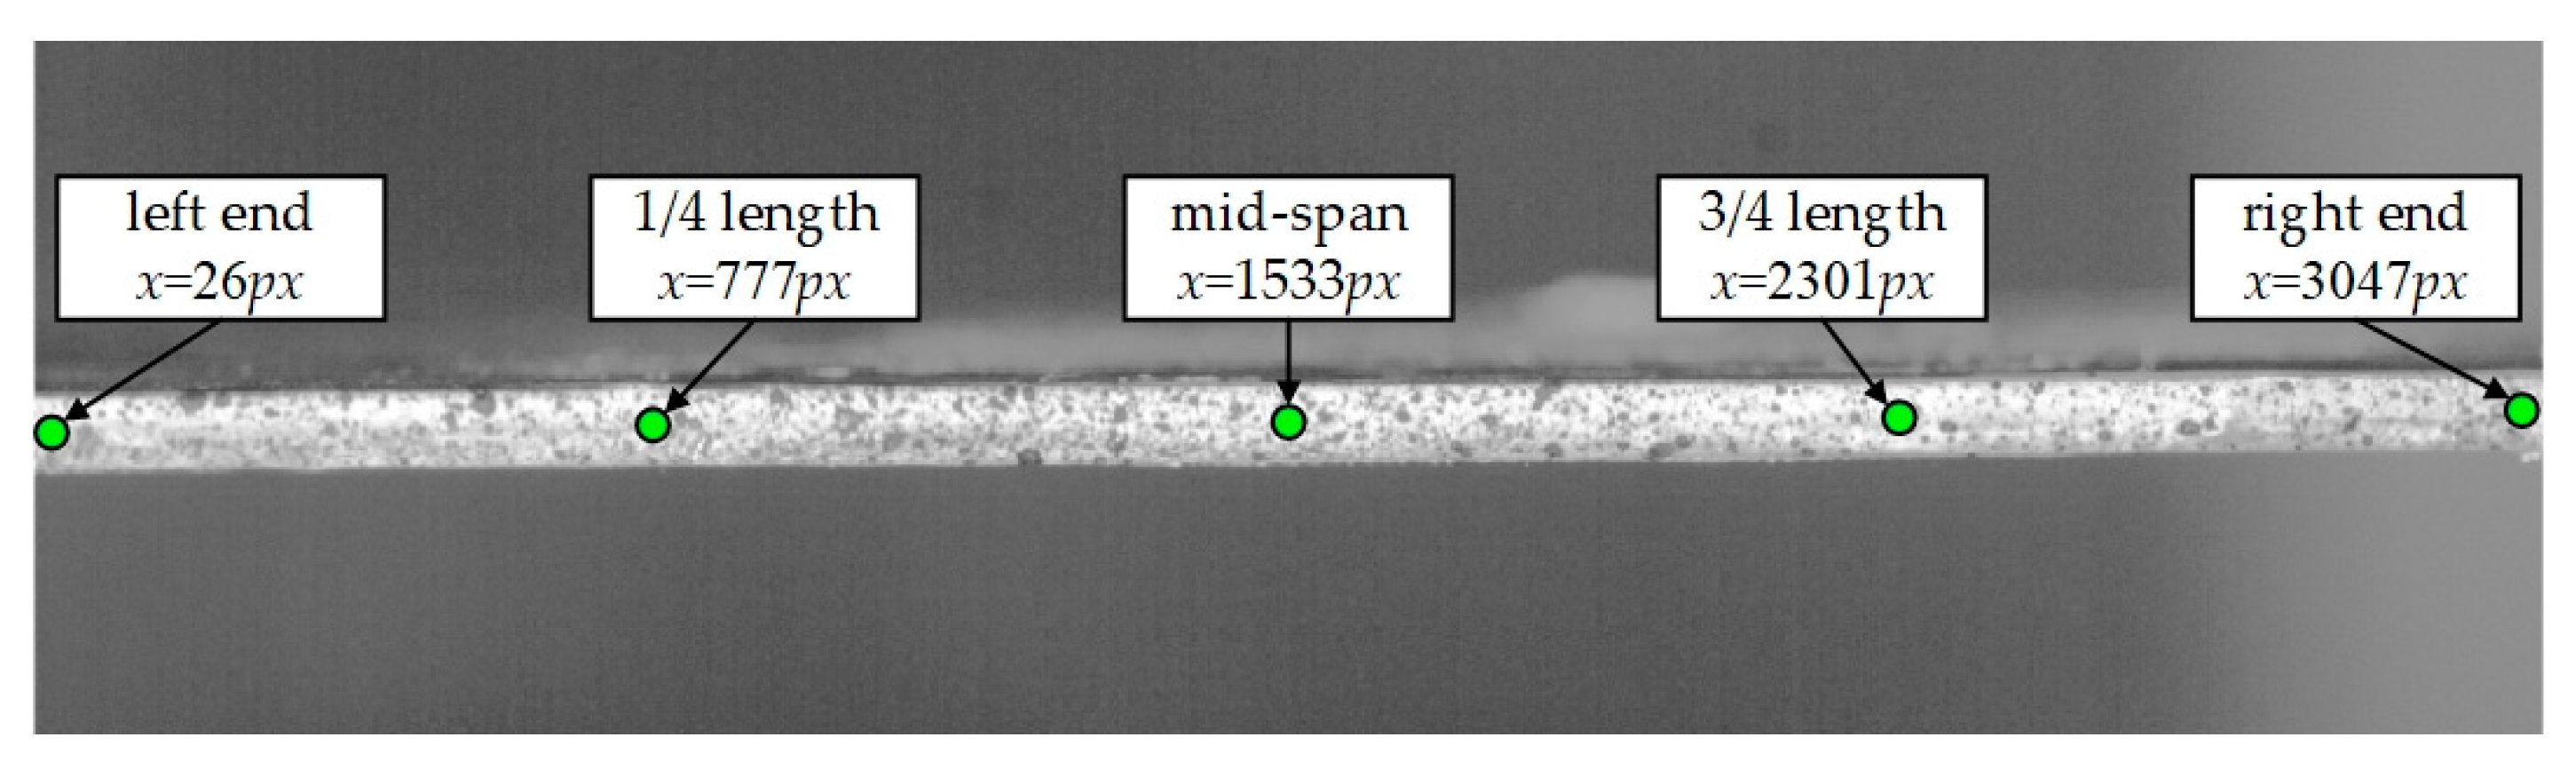
Digital Image Correlation (DIC) is a classic machine-vision-based full-field displacement and strain measurement method involving speckles, and several commercial software has been developed. However, its application is limited by the requirement for preinstalled high-quality speckles on the measurement object. The GOM Correlation Professional software was used to measure and validate the DFEM-DSMR method proposed in this paper; to be specific, five points on the left end, 1/4 length, mid-span, 3/4 length, and the right end of the beam were selected as shown in
Figure 14.
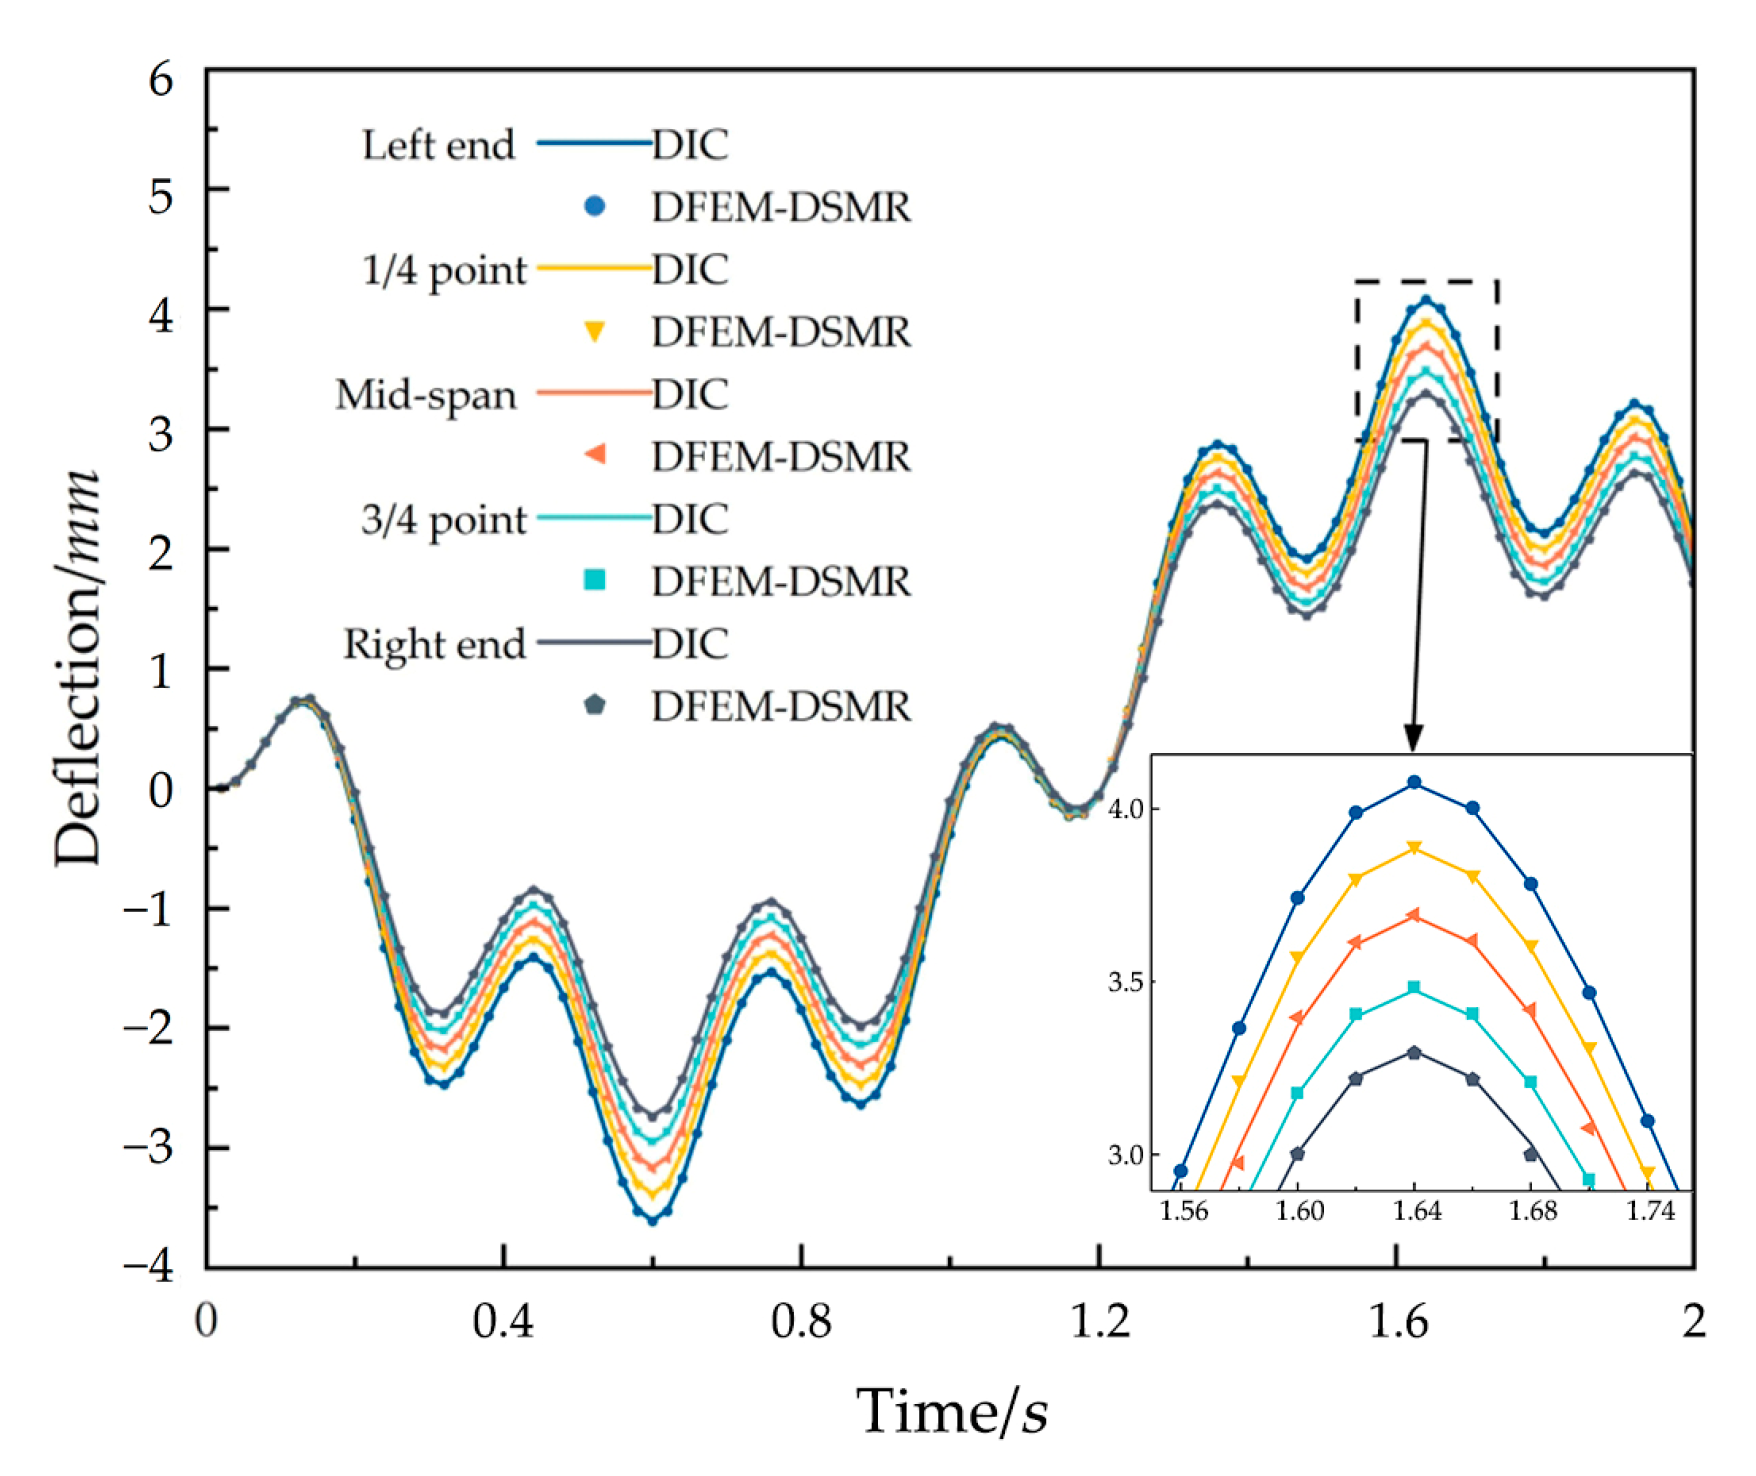
First, the temporal displacement of the measurement was measured by the DIC method of GOM software and the DFEM-DSMR method, and the comparison of two displacement–time curves is shown in
Figure 15, with the maximum errors being enlarged and shown in the bottom right box. It can be seen that the two curves correlate well with each other.
To quantitatively demonstrate the temporal displacement measurement accuracy of the DFEM-DSMR method, the maximum error, average error, and root mean squared error (
RMSE) of the dynamic deflection–time curves at the five measurement points were calculated and are listed in
Table 3. The
RMSE is defined as:
where
Xe is the deflection data obtained by the DFEM-DSMR method;
Xt is the data calculated by the GOM software, both in mm; and
i is the data number (
i = 1, 2, 3, …,
n,
n is the total image frame number).
Table 3 shows that the maximum errors range from 0.025 to 0.053 mm for the five measured points, the maximum average error is 0.013 mm, and the RMSE is 0.01 mm, the latter two of which are sub-pixel errors. From the perspective of temporal displacement measurement, the DFEM-DSMR method demonstrates high measurement accuracy and is consistent with the measured results of existing commercial software.
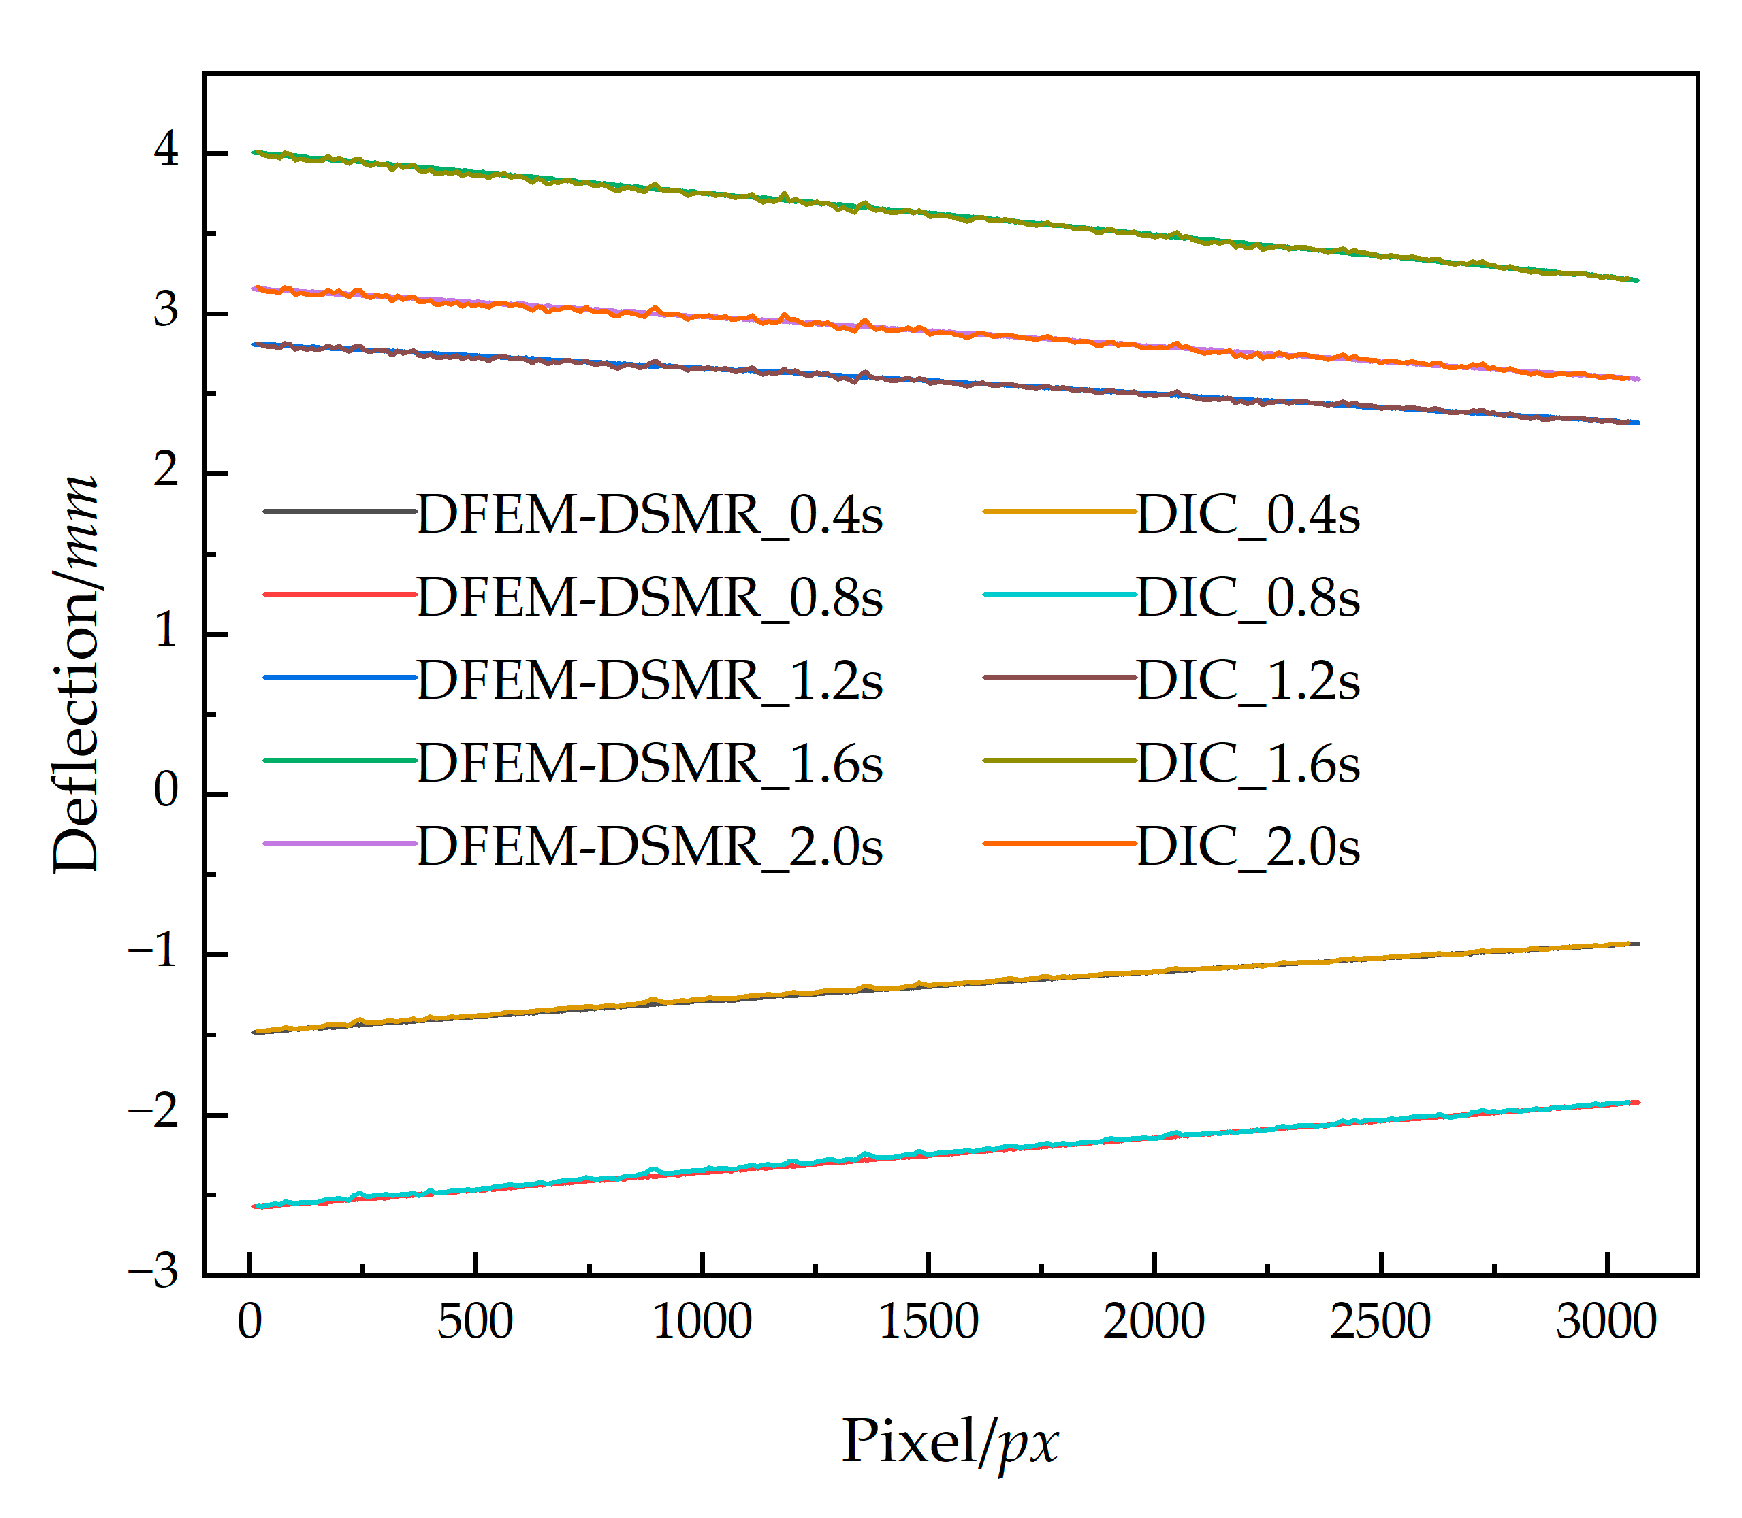
Then, the spatial displacement of the measurement was also measured by the two methods, and the pixel-by-pixel deflection distribution curves at the times 0.4, 0.8, 1.2, 1.6, 2 s along the beam were plotted as shown in
Figure 16.
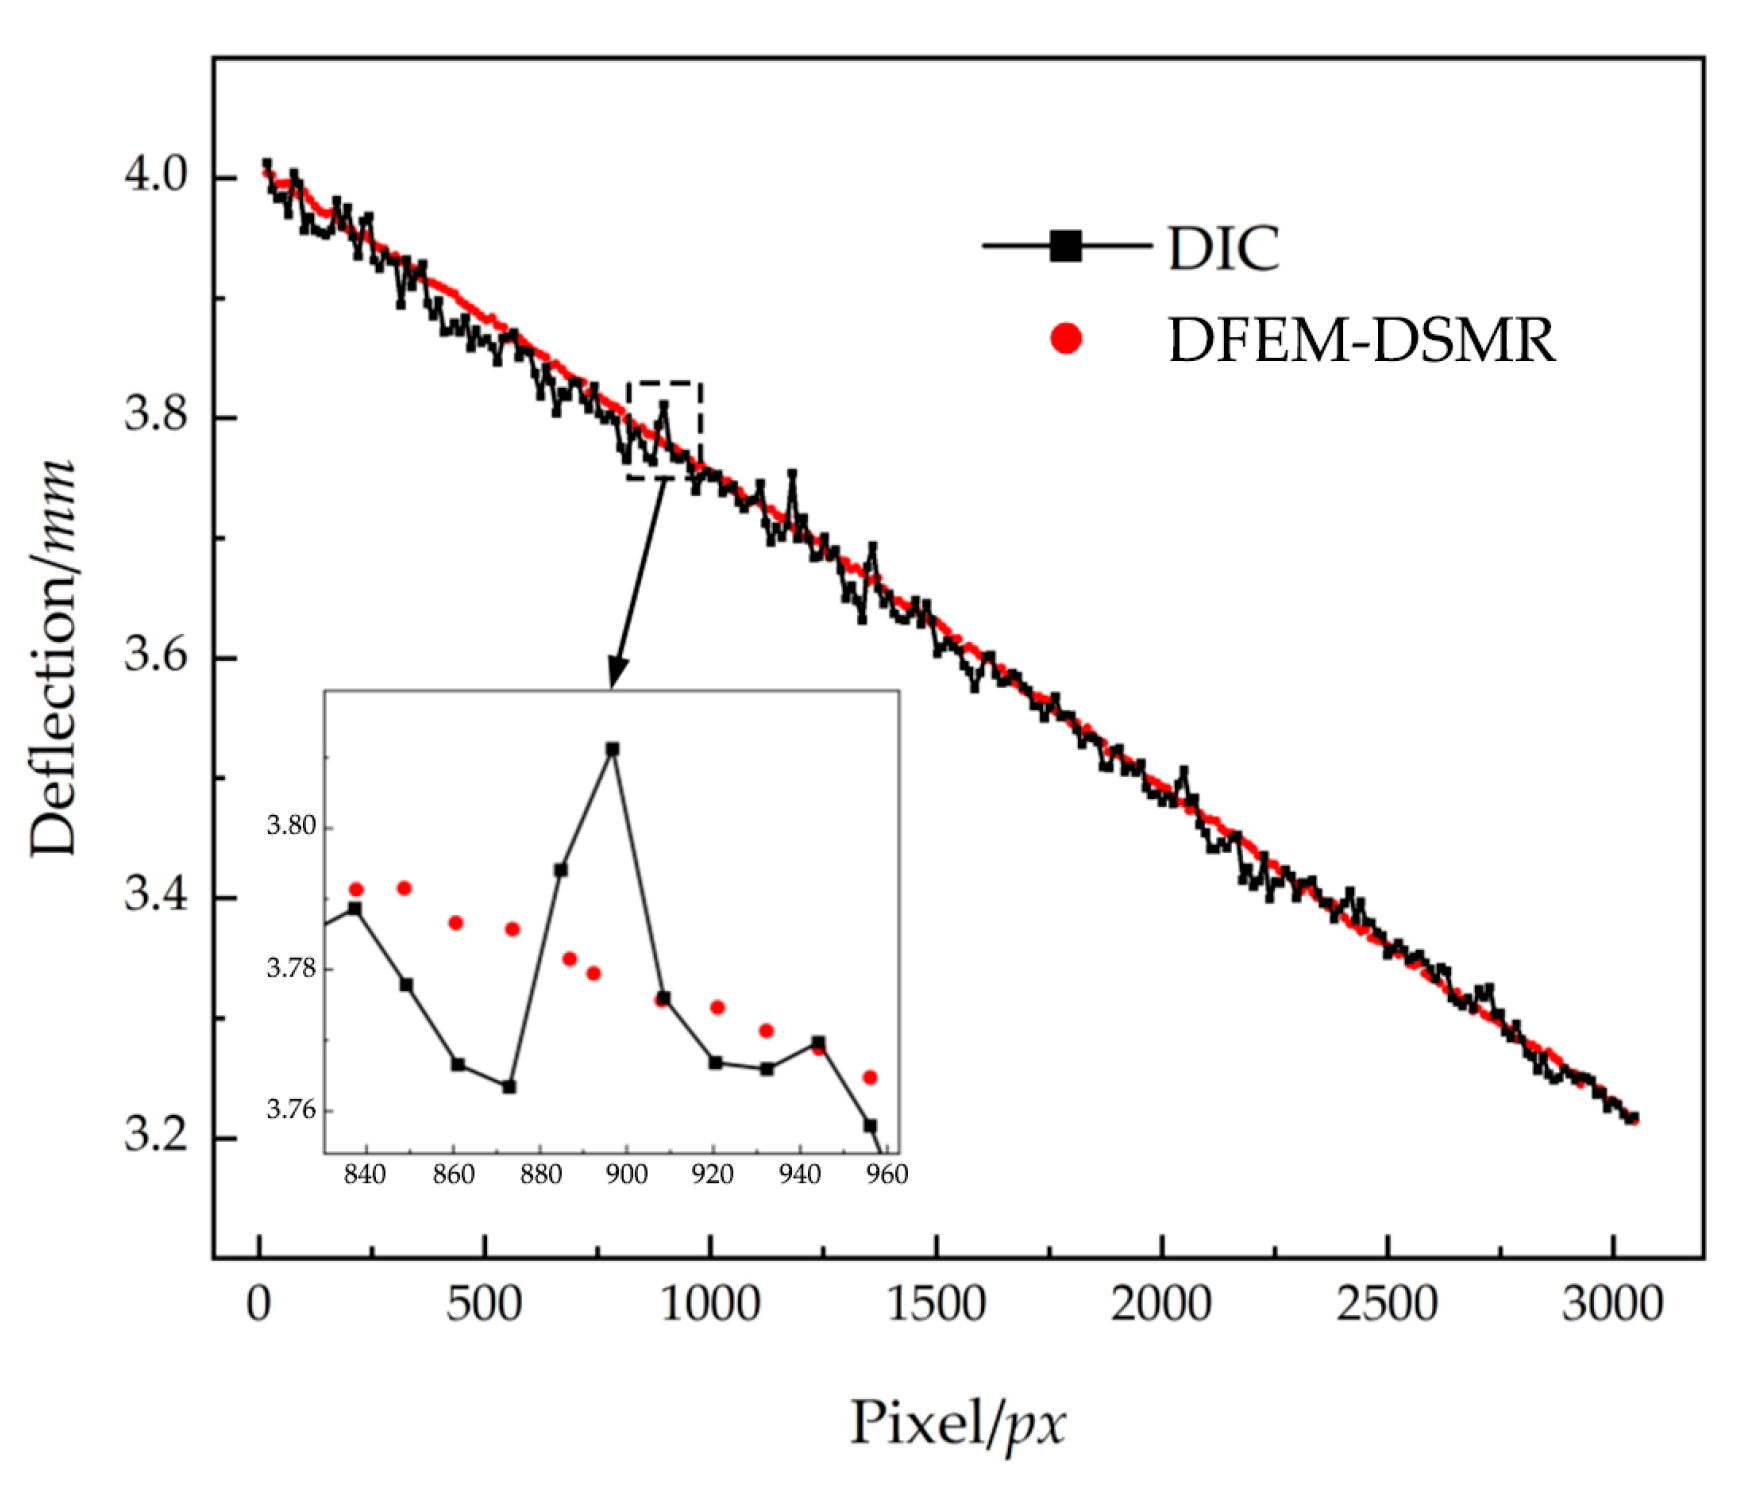
For clearer comparison, the spatial deflection curve of all measurement point at
t = 1.2 s was plotted as shown in
Figure 17, and the maximum errors were enlarged and are shown in the bottom left box. It shows that spatial deflection curves obtained by the DFEM-DSMR method are smoother and indicate better accuracy.
Furthermore, the maximum error, average error, and correlation coefficient
ρ of the two spatial deflection curves were calculated and are listed in
Table 4, and the correlation coefficient
ρ is:
where
and
represent the mean values of the two sets of data.
Table 4 shows that the maximum errors range from 0.037 to 0.047 mm of the five spatial deflection curves, and the maximum average error is 0.012 mm, which is the sub-pixel measurement error. The minimum correlation coefficient
ρ of the five curves is 0.9964, and it is close to 1. From the perspective of the spatial field, the deflection curve obtained by the DFEM-DSMR method almost completely coincides with the DIC calculation results; therefore, the method proposed in this paper exhibits high measurement precision.
5. Conclusions
In this paper, a dense feature extraction, matching, and dual-step mismatch-removal-based full-field structural dynamic deflection measurement method was proposed, and the method was validated through indoor cantilever beam experiments by commercial GOM correlation software. The main conclusions are summarized as follows:
(1) This proposed method achieves full-field dynamic displacement measurement of a vertical cantilever beam by dense feature extraction from the grayscale differences of structural surface textures, using a dual-step mismatch removal method to eliminate mismatched feature pairs, and the method shows good measurement accuracy and computational stability.
(2) In the structure motion tracking using SIFT feature extraction and FLANN matching, a large number of mismatches were found in the dense feature matching results, and the mismatch proportion accounts for as much as 60.62%, varies over time, and cannot be removed manually. The proposed DSMR method, combining the RANSAC and the SDCCs, can efficiently and accurately remove approximately 37% and 18% of mismatched feature pairs, respectively.
(3) Compared with GOM software, the DFEM-DSMR method shows good measurement accuracy temporally and spatially. Temporally, the maximum error in the dynamic deflection–time curves of measurement points at different positions ranged from 0.025 to 0.053 mm, the maximum average error was 0.013 mm, and the RMSE was 0.01 mm. Spatially, the maximum errors in the deflection curves of the global structure at five different times ranged from 0.037 to 0.047 mm, the maximum average error was 0.012 mm, and the minimum correlation coefficient ρ was 0.9964.
The conclusions above were derived in stable indoor illumination conditions. While the application of the proposed method in engineering should consider the influence of complex weather conditions such as cloudy, foggy, or rainy weather, the contrast differences of the structural surface texture and the influence of environmental background still necessitate further research.
Author Contributions
Conceptualization, J.Z.; methodology, software, validation; formal analysis, writing—original draft preparation Y.T.; writing—review and editing, supervision, H.L.; visualization, J.H.; funding acquisition, Z.Z. All authors have read and agreed to the published version of the manuscript.
Funding
This work was supported by the National Natural Science Foundation of China (Grant. No. 51778094), the National Natural Science Foundation of China (Grant. No. 51708068), the Joint Training Base for Postgraduate Construction Project of Chongqing (Grant. No. JDLHPYJD2020019), and the Postgraduate Tutor Team Construction Project of Chongqing (Grant. No. JDDSTD2022003). We also acknowledge the State Key Laboratory of Mountain Bridge and Tunnel Engineering for providing experimental equipment.
Institutional Review Board Statement
Not applicable.
Informed Consent Statement
Not applicable.
Data Availability Statement
The data that support the findings of this study are available from the corresponding author upon reasonable request. The data are not publicly available due to privacy.
Conflicts of Interest
Author Haijing Liu was employed by the company China Merchant Chongqing Communication Research & Design Institute Co., Ltd., Chongqing 400067, China. The remaining authors declare that the research was conducted in the absence of any commercial or financial relationships that could be constructed as potential conflicts of interest.
References
- Zhang, Q. Conception of Long-span Bridge Health Monitoring and Monitoring System Design. J. Tongji Univ. (Nat. Sci.) 2001, 29, 65–69. [Google Scholar]
- Fukuda, Y.; Feng, M.Q.; Shinozuka, M. Cost-effective Vision-based System for Monitoring Dynamic Response of Civil Engineering Structures. Struct. Control Health Monit. 2010, 17, 918–936. [Google Scholar] [CrossRef]
- He, S.; Zhao, X.; Ma, J.; Zhao, Y.; Song, H.S.; Song, H.X.; Cheng, L.; Yuan, Z.Y.; Huang, F.W.; Zhang, J.; et al. Review of Highway Bridge Inspection and Condition Assessment. China J. Highw. Transp. 2017, 30, 63–80. [Google Scholar]
- Meo, M.; Zumpano, G.; Meng, X.; Cosser, E.; Roberts, G.; Dodson, A. Measurements of Dynamic Properties of a Medium Span Suspension Bridge by Using the Wavelet Transforms. Mech. Syst. Signal Process. 2006, 20, 1112–1133. [Google Scholar] [CrossRef]
- Zhong, J.; Wang, B.; Wang, X.; Wang, Z. Research of Bridge Intelligent Inspection Technology and Application. Bridge Constr. 2019, 49, 1–6. [Google Scholar]
- Ye, X.; Zhang, X.; Ni, Y.; Wong, K.Y.; Fan, K.Q. Bridge Deflection Measurement Method Based on Machine Vision Technology. J. Zhejiang Univ. (Eng. Sci.) 2014, 48, 813–819. [Google Scholar]
- Zhu, Q.; Cui, D.; Liu, Y.; Du, Y. Computer Vision-based Vibration Recognition of Pedestrian Bridges with Complex Backgrounds. China Civ. Eng. J. 2023, 56, 75–86. [Google Scholar]
- He, S.; Wang, A.; Zhu, Z.; Zhao, Y. Research Progress on Intelligent Detection Technologies of Highway Bridges. China J. Highw. Transp. 2021, 34, 12–24. [Google Scholar]
- Ye, X.; Dong, C. Review of Computer Vision-based Structural Displacement Monitoring. China J. Highw. Transp. 2019, 32, 21–39. [Google Scholar]
- Catbas, F.N.; Zaurin, R.; Gul, M.; Gokce, H.B. Sensor Networks, Computer Imaging, and Unit Influence Lines for Structural Health Monitoring: Case Study for Bridge Load Rating. J. Bridge Eng. 2012, 17, 662–670. [Google Scholar] [CrossRef]
- Sładek, J.; Ostrowska, K.; Kohut, P.; Holak, K.; Gąska, A.; Uhl, T. Development of A Vision Based Deflection Measurement System and Its Accuracy Assessment. Measurement 2013, 46, 1237–1249. [Google Scholar] [CrossRef]
- Cigada, A.; Mazzoleni, P.; Zappa, E. Vibration Monitoring of Multiple Bridge Points by Means of a Unique Vision-Based Measuring System. Exp. Mech. 2014, 54, 255–271. [Google Scholar]
- Spencer, B.F., Jr.; Hoskere, V.; Narazaki, Y. Advances in Computer Vision-Based Civil Infrastructure Inspection and Monitoring. Engineering 2019, 5, 199–222. [Google Scholar] [CrossRef]
- Xiu, C.; Zhang, Y.; Shan, J. Vision and Vibration Data Fusion-Based Structural Dynamic Displacement Measurement with Test Validation. Eng. Mech. 2023, 40, 4547. [Google Scholar] [CrossRef] [PubMed]
- Pan, F.; Guo, S.; Wang, Z.; Li, S.; Li, H. Research on Dynamic Displacement Measurement Method of Shaking Table Model Based on UAV and Optical Flow Eigenvalue Method. Earthq. Eng. Eng. Vib. 2023, 43, 79–86. [Google Scholar]
- Wang, M.; Ao, W.K.; Bownjohn, J.; Xu, F. Completely Non-Contact Modal Testing of Full-scale Bridge in Challenging Conditions Using Vision Sensing Systems. Eng. Struct. 2022, 272, 114994. [Google Scholar] [CrossRef]
- Song, Q.; Wu, J.; Wang, H.; An, Y.; Tang, G. Computer Vision-based Illumination-Robust and Multi-Point Simultaneous Structural Displacement Measuring Method. Mech. Syst. Signal Process. 2022, 170, 108822. [Google Scholar] [CrossRef]
- Tan, D.; Li, J.; Hao, H.; Nie, Z. Target-Free Vision-Based Approach for Modal Identification of a Simply-Supported Bridge. Eng. Struct. 2023, 279, 115586. [Google Scholar] [CrossRef]
- Dong, C.; Celik, O.; Catbas, F.N. Marker-Free Monitoring of the Grandstand Structures and Modal Identification Using Computer Vision Methods. Struct. Health Monit. 2018, 18, 147592171880689. [Google Scholar] [CrossRef]
- Lowe, D.G. Object Recognition from Local Scale-Invariant Features. In Proceedings of the IEEE International Conference on Computer Vision, Kerkyra, Greece, 20–27 September 1999. [Google Scholar]
- Lowe, D.G. Distinctive Image Features from Scale-Invariant Keypoints. Int. J. Comput. Vis. 2004, 60, 91–110. [Google Scholar] [CrossRef]
- Lindeberg, T. Scale-Space Theory: A Basic Tool for Analyzing Structures at Different Scales. J. Appl. Stat. 1994, 21, 225–270. [Google Scholar] [CrossRef]
- Muja, M. Fast Approximate Nearest Neighbors with Automatic Algorithm Configuration. In Proceedings of the International Conference on Computer Vision Theory and Application, Lisboa, Portugal, 5–8 February 2009; pp. 331–340. [Google Scholar]
- Liu, G.; Gu, J.; Li, M.; He, C. Damage identification method of painted beams based on digital image correlation. J. Civ. Environ. Eng. 2022, 44, 148–157. [Google Scholar]
- Ge, J.; Li, H. Study on bridge damage inspection and identification experiments with mean curvature mode method. J. China Foreign Highw. 2010, 30, 147–150. [Google Scholar]
- Choi, S.; Kim, T.; Yu, W. Performance Evaluation of RANSAC Family. J. Comput. Vis. 1997, 24, 271–300. [Google Scholar]
- Chu, X. Holographic Shape Monitoring and Damage Identification of Bridge Structure Based on Fixed Axis Rotation Photography; Chongqing Jiaotong University: Chongqing, China, 2020. [Google Scholar]
- Sun, P.; Lu, N.-G.; Dong, M.-L.; Yan, B.-X.; Wang, J. Simultaneous All-Parameters Calibration and Assessment of a Stereo Camera Pair Using a Scale Bar. Sensors 2018, 18, 3964. [Google Scholar] [CrossRef]
- Khuc, T.; Catbas, F.N. Completely Contactless Structural Health Monitoring of Real-life Structures Using Cameras and Computer Vision. Struct. Control Health Monit. 2017, 24, e1852. [Google Scholar] [CrossRef]
- Zheng, J. Research on Structural Spatial-Temporal Displacement Monitoring Method Based on Sequence Image; Chongqing Jiaotong University: Chongqing, China, 2022. [Google Scholar] [CrossRef]
Figure 1.
Gaussian difference in different scale space. (a) Image pyramid model. (b) Gaussian difference image.
Figure 1.
Gaussian difference in different scale space. (a) Image pyramid model. (b) Gaussian difference image.
Figure 2.
Feature descriptions and direction histogram. (a) Feature descriptions in the neighborhood. (b) Gradients’ histogram.
Figure 2.
Feature descriptions and direction histogram. (a) Feature descriptions in the neighborhood. (b) Gradients’ histogram.
Figure 3.
Mismatches generated using SIFT features. (a) Meaningless mismatch. (b) Ambiguity in mismatch.
Figure 3.
Mismatches generated using SIFT features. (a) Meaningless mismatch. (b) Ambiguity in mismatch.
Figure 4.
Schematic diagram of continuity deformation of structural displacements. (a) Cantilever beam in the initial and deformed states. (b) Displacement continuity within an infinitesimal range.
Figure 4.
Schematic diagram of continuity deformation of structural displacements. (a) Cantilever beam in the initial and deformed states. (b) Displacement continuity within an infinitesimal range.
Figure 5.
Flowchart of structural full-field dynamic deflection measurement of DFEM-DSMR.
Figure 5.
Flowchart of structural full-field dynamic deflection measurement of DFEM-DSMR.
Figure 6.
Schematic diagram and layout of indoor experiment. (a) Schematic diagram of the validation experiment. (b) Indoor experiment layout.
Figure 6.
Schematic diagram and layout of indoor experiment. (a) Schematic diagram of the validation experiment. (b) Indoor experiment layout.
Figure 7.
20th frame in the image sequence. (a) The 20th frame image. (b) The image without background.
Figure 7.
20th frame in the image sequence. (a) The 20th frame image. (b) The image without background.
Figure 8.
Dense feature matching pairs between the 1st and 20th frames.
Figure 8.
Dense feature matching pairs between the 1st and 20th frames.
Figure 9.
Coarse removal of mismatches by RANSAC method and remaining matching pairs. (a) Removed features by RANSAC mismatch removal. (b) Feature matches after RANSAC mismatch removal.
Figure 9.
Coarse removal of mismatches by RANSAC method and remaining matching pairs. (a) Removed features by RANSAC mismatch removal. (b) Feature matches after RANSAC mismatch removal.
Figure 10.
Secondary SDCC mismatch removal and correct matching pairs. (a) Removed features by SDCC mismatch removal. (b) Feature matches after SDCC mismatch removal.
Figure 10.
Secondary SDCC mismatch removal and correct matching pairs. (a) Removed features by SDCC mismatch removal. (b) Feature matches after SDCC mismatch removal.
Figure 11.
Deflection variation at the mid-span in the entire temporal field.
Figure 11.
Deflection variation at the mid-span in the entire temporal field.
Figure 12.
Deflection variation in the 20th frame in the entire spatial field. (a) The global spatial deflection of the beam. (b) The local spatial deflection of the beam.
Figure 12.
Deflection variation in the 20th frame in the entire spatial field. (a) The global spatial deflection of the beam. (b) The local spatial deflection of the beam.
Figure 13.
Deflection curve after polynomial fitting.
Figure 13.
Deflection curve after polynomial fitting.
Figure 14.
Measurement points on the beam.
Figure 14.
Measurement points on the beam.
Figure 15.
Comparison of the results of deflection between the two methods.
Figure 15.
Comparison of the results of deflection between the two methods.
Figure 16.
Five spatial deflection curves of DIC and DFEM-DSMR.
Figure 16.
Five spatial deflection curves of DIC and DFEM-DSMR.
Figure 17.
Comparison of the deflection at t = 1.2 s between the two methods.
Figure 17.
Comparison of the deflection at t = 1.2 s between the two methods.
Table 1.
Equipment types and main parameters.
Table 1.
Equipment types and main parameters.
| Equipment | Manufacturer/Model | Main Parameters | Main Usage |
|---|
Industrial
camera | Basler/a2A5320-7gmBAS | Resolution 5320 × 3032 px;
Frame rate 50 fps | Data acquisition |
| Lens | C11-1220-12M | Lens focal length 12.0 mm;
Aperture F2.0-F16.0 | Auxiliary devices |
| Computer | MSI/GL62M | Intel(R) Core (TM) i5;
7300HQ CPU @ 2.50 GHz | Data storage |
Table 2.
Mismatch removal at different times.
Table 2.
Mismatch removal at different times.
| Time | Total Match Number | Coarse
Mismatch Removal Number | Coarse
Mismatch
Rate m1 | Secondary
Mismatch
Removal Number | Secondary
Mismatch
Rate m2 | Total
Mismatch Rate |
|---|
| t = 0.2 s | 6838 | 4579 | 33.03% | 3455 | 16.44% | 49.47% |
| t = 0.4 s | 4325 | 36.75% | 3053 | 18.60% | 55.35% |
| t = 0.8 s | 4464 | 34.72% | 3221 | 18.18% | 52.90% |
| t = 1.2 s | 4444 | 35.01% | 3186 | 18.40% | 53.41% |
| t = 0.6 s | 4090 | 40.19% | 2693 | 20.43% | 60.62% |
| t = 2.0 s | 4319 | 36.84% | 3095 | 17.90% | 54.74% |
Table 3.
Temporal displacement measurement error of DIC and DFEM-DSMR.
Table 3.
Temporal displacement measurement error of DIC and DFEM-DSMR.
| Time | Maximum Error
/mm | Average Error
/mm | RMSE/mm |
|---|
| DFEM-DSMR | References |
|---|
| left end | 0.032 | 0.005 | 0.007 | 0.1–0.2 [27]
0.1–0.3 [28] |
| 1/4 point | 0.053 | 0.009 | 0.012 |
| mid-span | 0.049 | 0.010 | 0.015 |
| 3/4 point | 0.025 | 0.006 | 0.007 |
| right end | 0.034 | 0.013 | 0.015 |
Table 4.
Spatial deflection measurement error of DIC and DFEM-DSMR.
Table 4.
Spatial deflection measurement error of DIC and DFEM-DSMR.
| Times | Maximum Error
/mm | Average Error
/mm | Correlation Coefficient ρ |
|---|
| DFEM-DSMR | References |
|---|
| t = 0.4 s | 0.037 | 0.008 | 0.9994 | 0.9689–0.9887 [29]
0.9805 [30] |
| t = 0.8 s | 0.047 | 0.011 | 0.9991 |
| t = 1.2 s | 0.038 | 0.010 | 0.9969 |
| t = 1.6 s | 0.046 | 0.012 | 0.9984 |
| t = 2.0 s | 0.047 | 0.012 | 0.9964 |
| Disclaimer/Publisher’s Note: The statements, opinions and data contained in all publications are solely those of the individual author(s) and contributor(s) and not of MDPI and/or the editor(s). MDPI and/or the editor(s) disclaim responsibility for any injury to people or property resulting from any ideas, methods, instructions or products referred to in the content. |
© 2024 by the authors. Licensee MDPI, Basel, Switzerland. This article is an open access article distributed under the terms and conditions of the Creative Commons Attribution (CC BY) license (https://creativecommons.org/licenses/by/4.0/).


