
Silencing of SbPPCK1-3 Negatively Affects Development, Stress Responses and Productivity in Sorghum
 ,
,  , , , ,
  and
and 
Abstract
:1. Introduction
2. Results
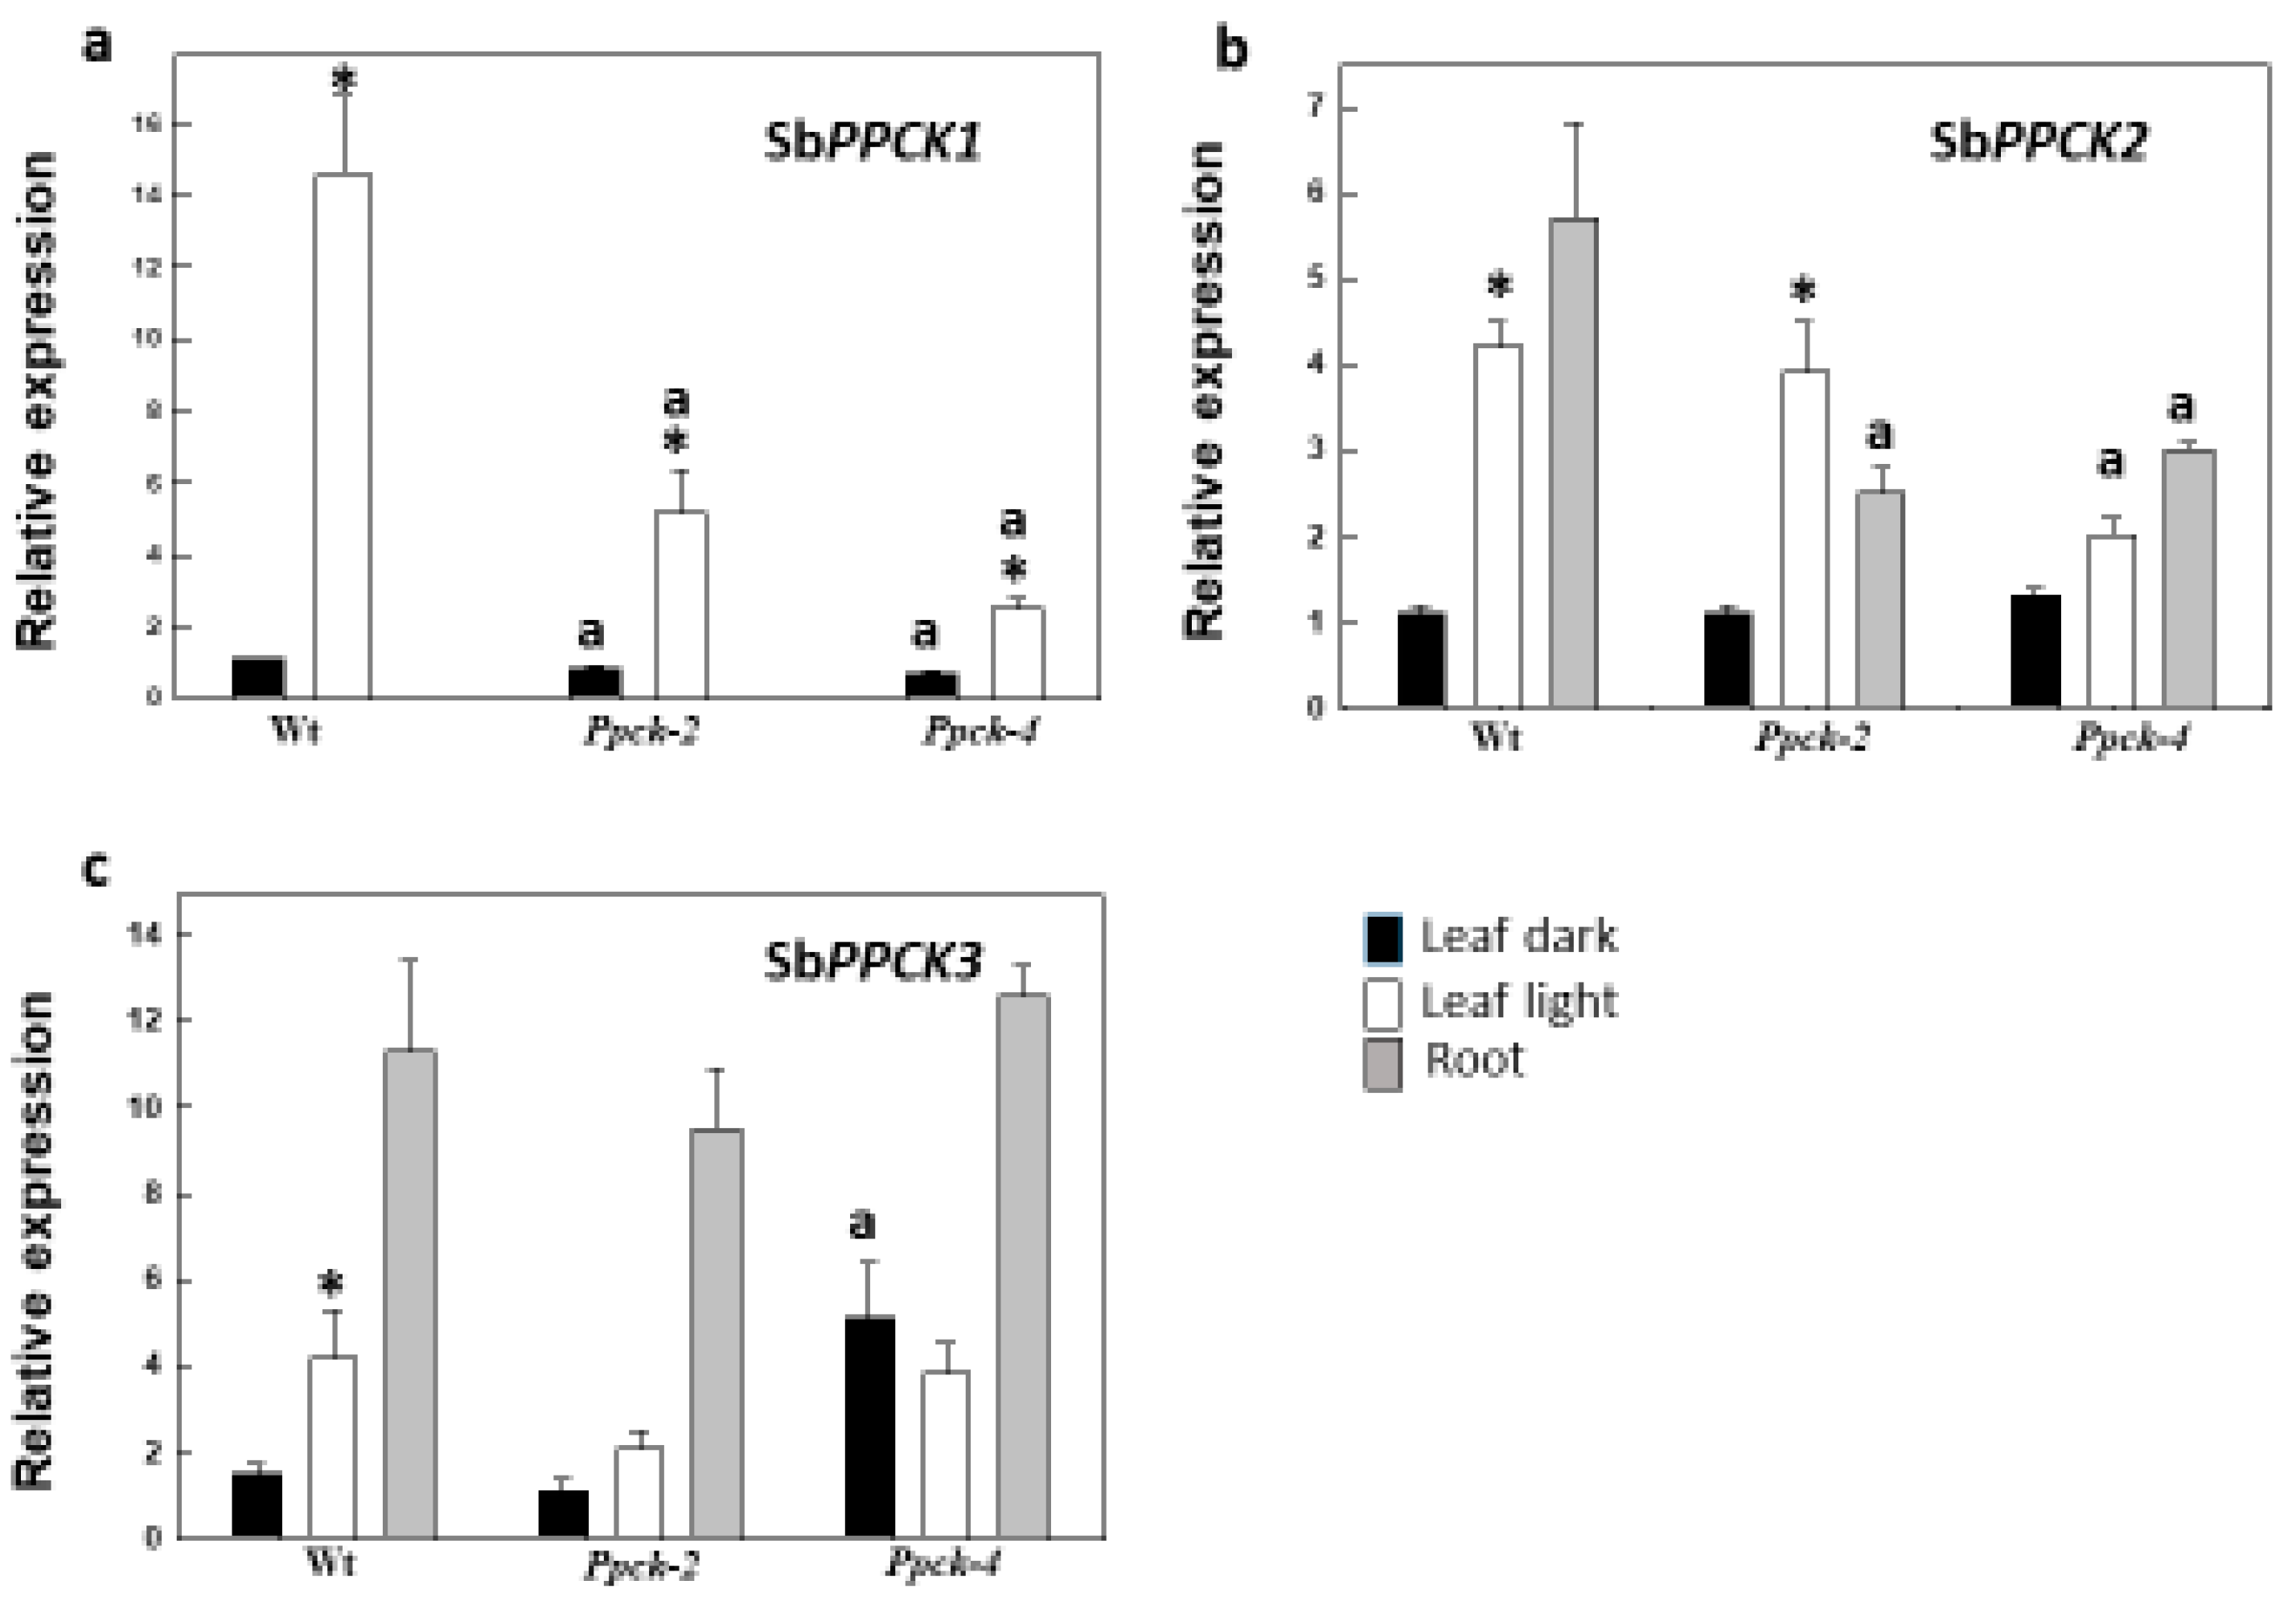
2.1. Effects of SbPPCK1-3 Silencing on SbPPCK Gene Expression and PEPCk Activity
2.2. Impact of SbPPCK1-3 Silencing on Phosphorylation of PEPC and Vegetative Development
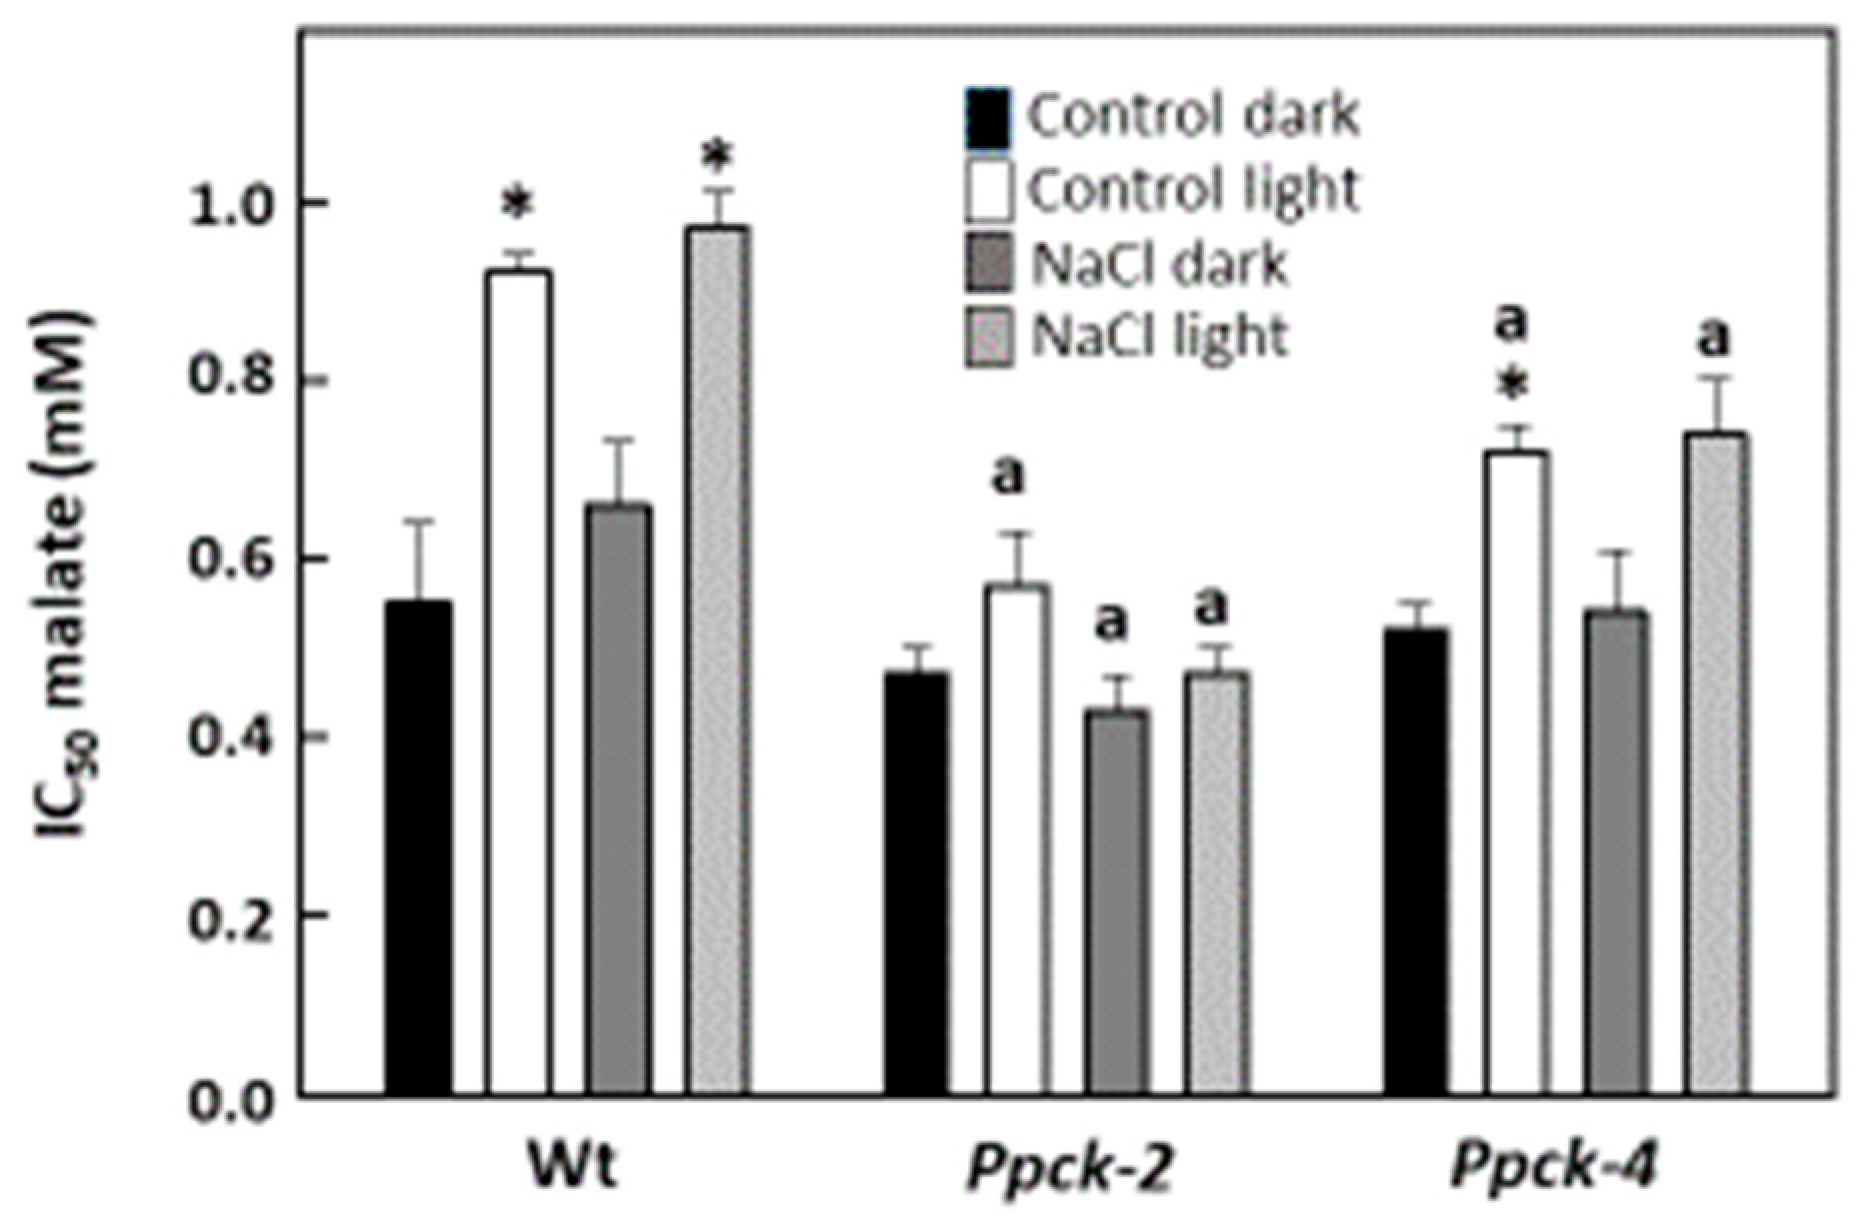
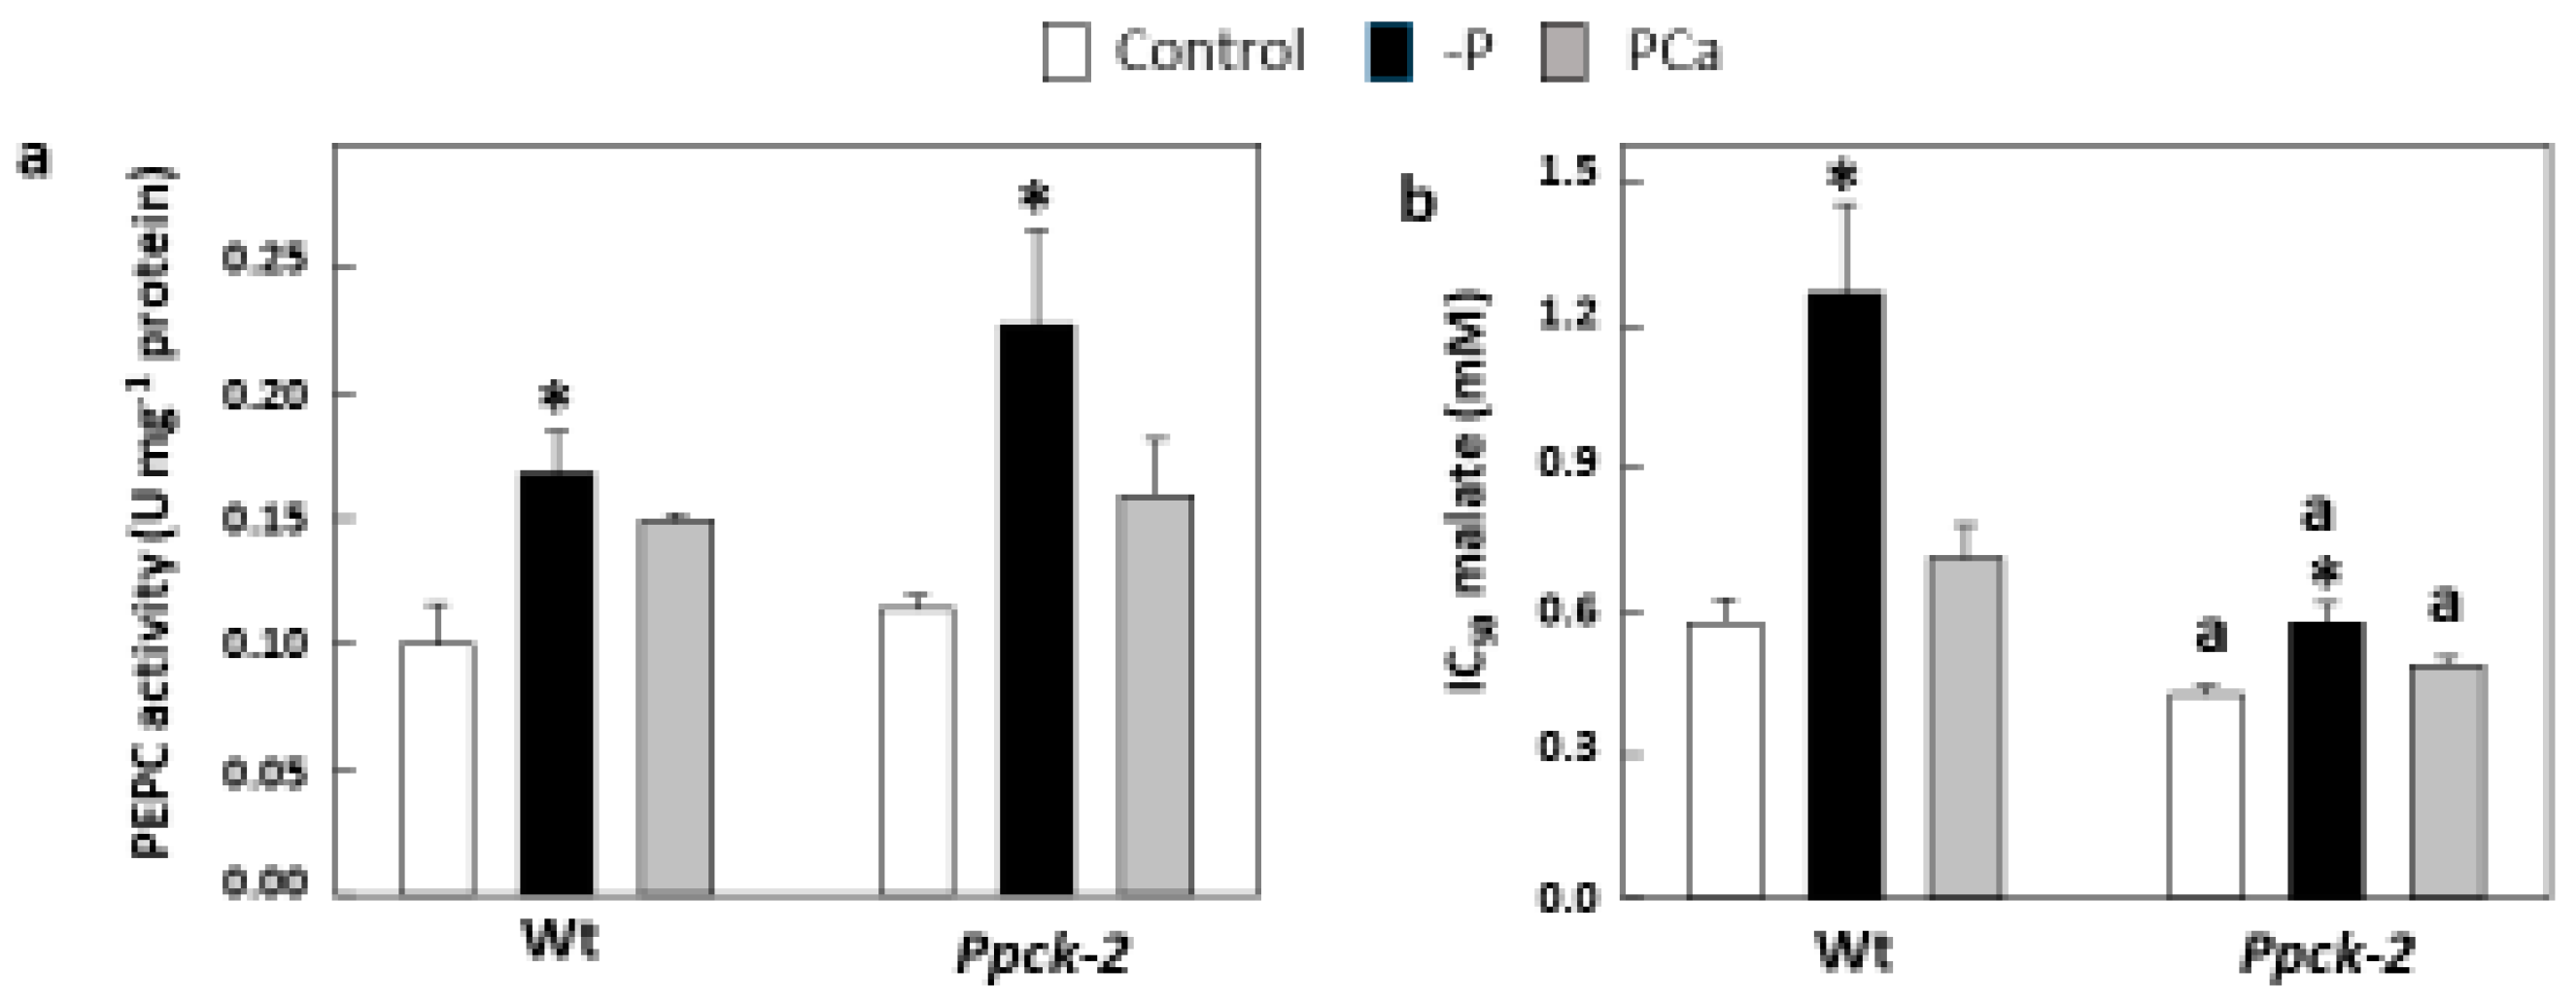
2.3. Metabolic Changes in Ppck Lines
2.4. Impact of SbPPCK1-3 Silencing on Reproductive Development and Seed Production
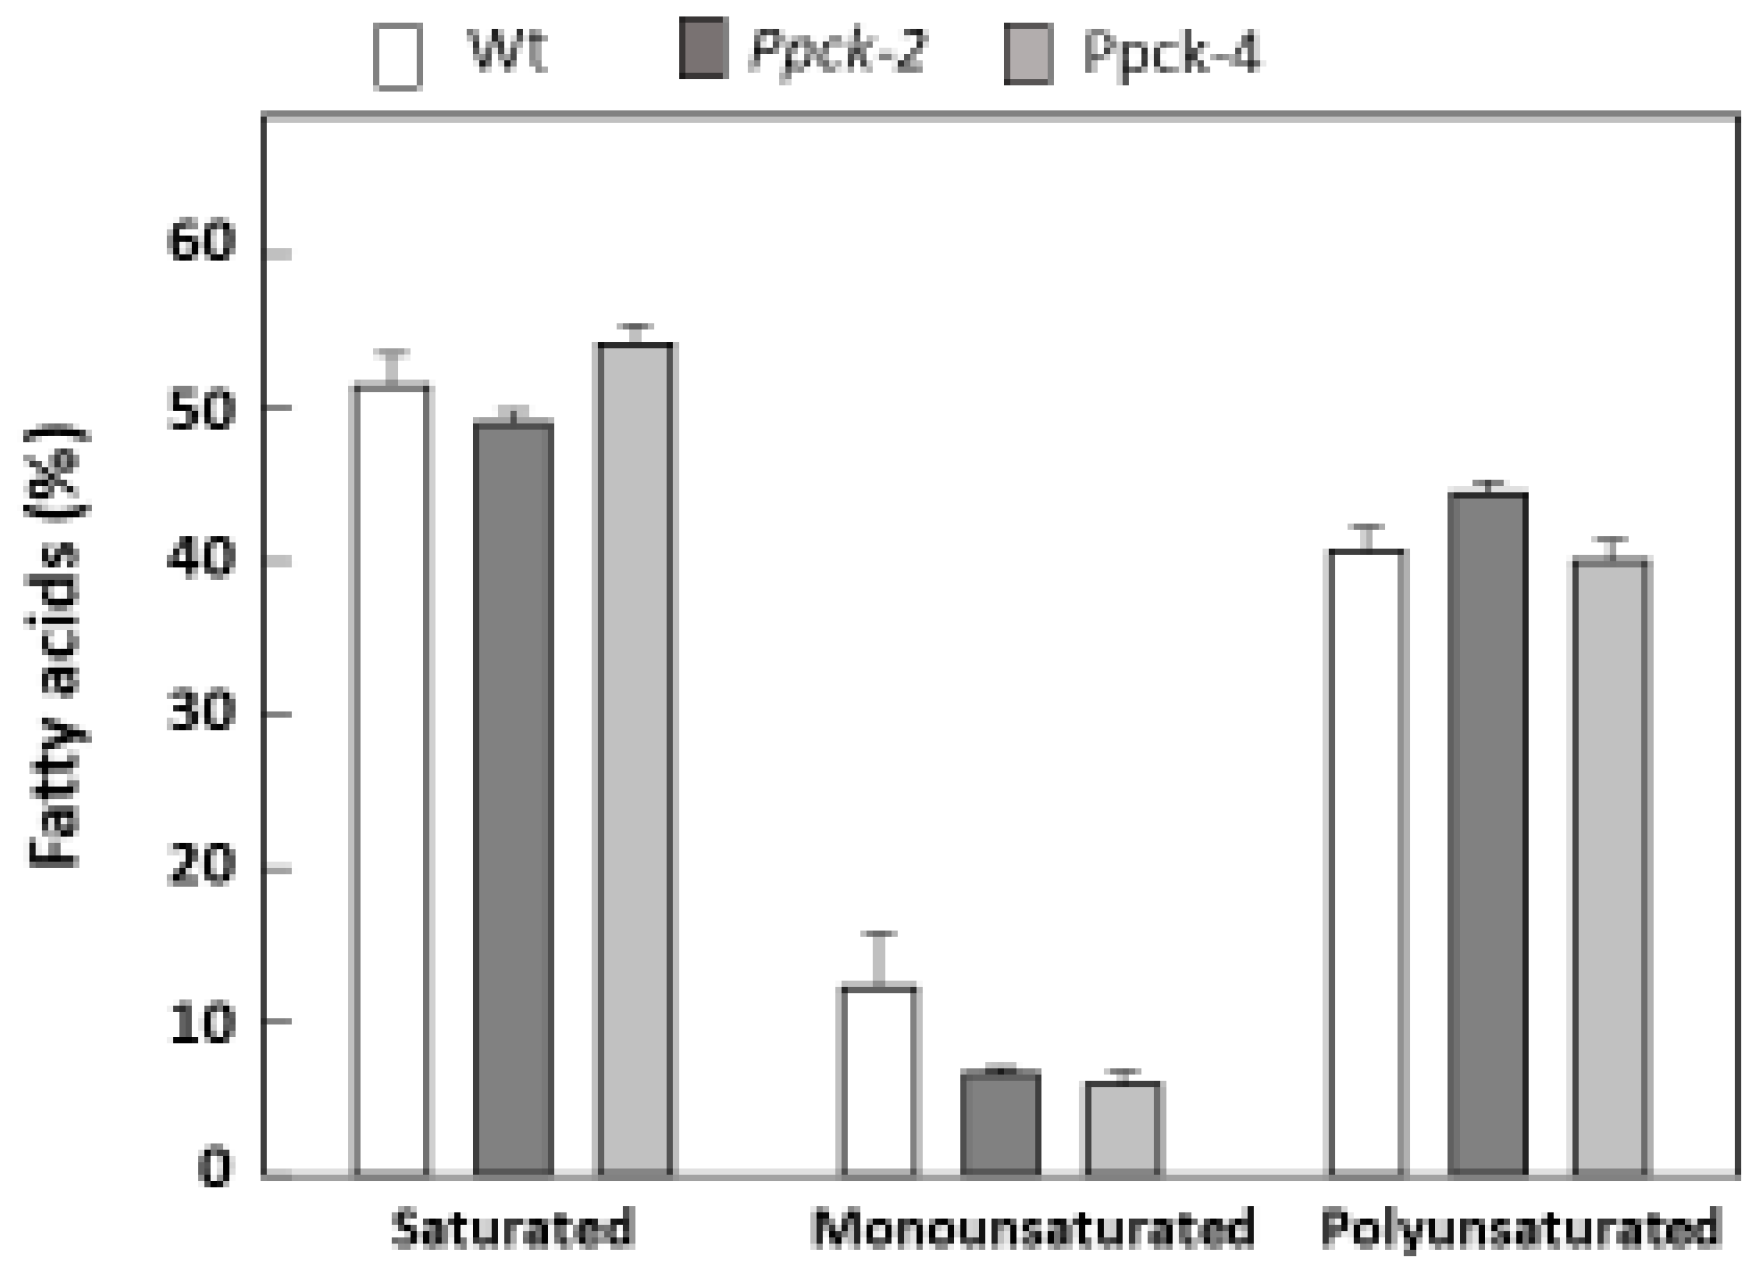
2.5. Impact of SbPPCK1-3 Silencing on the Composition of Seeds
3. Discussion
4. Materials and Methods
4.1. Plant Material and Growth Conditions
4.2. Generation of Sorghum Ppck Lines
4.3. Selection of Transformed Ppck Plants
4.4. Site of Insertion of the T-DNA into Ppck Lines Genome
4.5. Determination of Enzyme Activity and Protein Quantification
4.6. RNA Extraction and cDNA Synthesis
4.7. Quantitative Real-Time PCR (qPCR)
4.8. Quantification of Amino Acids
4.9. Determination of C/N Ratio
4.10. Quantification of Starch
4.11. Quantification of Fatty Acids
4.12. Quantification of Tannins
4.13. Quantification of Phytates
4.14. Statistical Analysis
5. Conclusions
Author Contributions
Funding
Data Availability Statement
Acknowledgments
Conflicts of Interest
References
- Chollet, R.; Vidal, J.; O’Leary, M.H. Phosphoenolpyruvate carboxylase: A ubiquitous, highly regulated enzyme in plants. Annu. Rev. Plant Physiol. Plant Mol. Biol. 1996, 47, 273–298. [Google Scholar] [CrossRef] [PubMed] [Green Version]
- Nimmo, H.G. The regulation of PEPC in CAM plants. Trends Plant. Sci. 2000, 5, 75–80. [Google Scholar] [CrossRef]
- O’Leary, B.; Park, J.; Plaxton, W.C. The remarkable diversity of plant PEPC (phosphoenolpyruvate carboxylase): Recent insights into the physiological functions and post-translational controls of non-photosynthetic PEPCs. Biochem. J. 2011, 436, 15–34. [Google Scholar] [CrossRef] [PubMed] [Green Version]
- Paterson, A.H.; Bowers, J.E.; Bruggmann, R.; Dubchak, I.; Grimwood, J.; Gundlach, H.; Haberer, G.; Hellsten, U.; Mitros, T.; Poliakov, A.; et al. The Sorghum bicolor genome and the diversification of grasses. Nature 2009, 457, 551–556. [Google Scholar] [CrossRef] [PubMed] [Green Version]
- Echevarría, C.; Vidal, J. The unique phosphoenolpyruvate carboxylase kinase. Plant Physiol. Biochem. 2003, 41, 541–547. [Google Scholar] [CrossRef]
- Arias-Baldrich, C.; de la Osa, C.; Bosch, N.; Ruiz-Ballesta, I.; Monreal, J.A.; García-Mauriño, S. Enzymatic activity, gene expression and posttranslational modifications of photosynthetic and non-photosynthetic phosphoenolpyruvate carboxylase in ammonium-stressed sorghum plants. J. Plant Physiol. 2017, 214, 39–47. [Google Scholar] [CrossRef] [PubMed]
- Ruiz-Ballesta, I.; Feria, A.B.; Ni, H.; She, Y.M.; Plaxton, W.C.; Echevarría, C. In vivo monoubiquitination of anaplerotic phosphoenolpyruvate carboxylase occurs at Lys624 in germinating sorghum seeds. J. Exp. Bot. 2014, 65, 443–451. [Google Scholar] [CrossRef] [Green Version]
- Ruiz-Ballesta, I.; Baena, G.; Gandullo, J.; Wang, L.; She, Y.M.; Plaxton, W.C.; Echevarría, C. New insights into the post-translational modification of multiple phosphoenolpyruvate carboxylase isoenzymes by phosphorylation and monoubiquitination during sorghum seed development and germination. J. Exp. Bot. 2016, 67, 3523–3536. [Google Scholar] [CrossRef] [Green Version]
- Baena, G.; Feria, A.; Echevarría, C.; Monreal, J.A.; García-Mauriño, S. Salinity promotes opposite patterns of carbonylation and nitrosylation of C4 phosphoenolpyruvate carboxylase in sorghum leaves. Planta 2017, 246, 1203–1214. [Google Scholar] [CrossRef]
- Aroca, A.; Benito, J.M.; Gotor, C.; Romero, L.C. Persulfidation proteome reveals the regulation of protein function by hydrogen sulfide in diverse biological processes in Arabidopsis. J. Exp. Bot. 2017, 68, 4915–4927. [Google Scholar] [CrossRef] [Green Version]
- Hartwell, J.; Gill, A.; Nimmo, G.A.; Wilkins, M.B.; Jenkins, G.I.; Nimmo, H.G. Phosphoenolpyruvate carboxylase kinase is a novel protein kinase regulated at level of expression. Plant J. 1999, 20, 333–342. [Google Scholar] [CrossRef]
- Echevarría, C.; Vidal, J.; Jiao, J.A.; Chollet, R. Reversible light activation of phosphoenolpyruvate carboxylase protein-serine kinase in maize leaves. FEBS Lett. 1990, 275, 25–28. [Google Scholar] [CrossRef] [PubMed] [Green Version]
- Furumoto, T.; Izui, K.; Quinn, V.; Furbank, R.T.; von Caemmerer, S. Phosphorylation of phosphoenolpyruvate carboxylase is not essential for high photosynthetic rates in the C4 species Flaveria bidentis. Plant Physiol. 2007, 144, 1936–1945. [Google Scholar] [CrossRef] [PubMed] [Green Version]
- Boxall, S.F.; Dever, L.V.; Knrová, J.; Gould, P.D.; Hartwell, J. Phosphorylation of phosphoenolpyruvate carboxylase is essential for maximal and sustained dark CO2 fixation and core circadian clock operation in the obligate Crassulacean Acid Metabolism species Kalanchoë fedtschenkoi. Plant Cell 2017, 29, 2519–2536. [Google Scholar] [CrossRef] [PubMed] [Green Version]
- Wang, X.; Gowik, U.; Tang, H.; Bowers, J.E.; Westhoff, P.; Paterson, A.H. Comparative genome analysis of C4 photosynthetic pathway evolution in grasses. Genome Biol. 2009, 10, R68. [Google Scholar] [CrossRef] [PubMed] [Green Version]
- Shenton, M.; Fontaine, V.; Hartwell, J.; Marsh, J.T.; Jenkins, G.I.; Nimmo, H.G. Distinct patterns of control and expression amongst members of the PEP carboxylase kinase gene family in C4 plants. Plant J. 2006, 48, 45–53. [Google Scholar] [CrossRef]
- Doubnerová, V.; Ryšlavá, H. What can enzymes of C4 photosynthesis do for C3 plants under stress? Plant Sci. 2011, 180, 575–583. [Google Scholar] [CrossRef]
- García-Mauriño, S.; Monreal, J.A.; Álvarez, R.; Vidal, J.; Echevarría, C. Characterization of salt stress-enhanced phosphoenolpyruvate carboxylase kinase activity in leaves of Sorghum vulgare: Independence from osmotic stress, involvement of ion toxicity and significance of dark phosphorylation. Planta 2003, 216, 648–655. [Google Scholar] [CrossRef]
- Echevarría, C.; García-Mauriño, S.; Alvarez, R.; Soler, A.; Vidal, J. Salt stress increases the Ca2+-independent phosphoenolpyruvate carboxylase kinase activity in Sorghum plants. Planta 2001, 214, 283–287. [Google Scholar] [CrossRef]
- Monreal, J.A.; Feria, A.B.; Vinardell, J.M.; Vidal, J.; Echevarría, C.; García-Mauriño, S. ABA modulates the degradation of phosphoenolpyruvate carboxylase kinase in sorghum leaves. FEBS Lett. 2007, 581, 3468–3472. [Google Scholar] [CrossRef] [Green Version]
- de la Osa, C.; Pérez-López, J.; Feria, A.B.; Baena, G.; Marino, D.; Coleto, I.; Pérez-Montaño, F.; Gandullo, J.; Echevarría, C.; García-Mauriño, S.; et al. Knock-down of phosphoenolpyruvate carboxylase 3 negatively impacts growth, productivity, and responses to salt stress in sorghum (Sorghum bicolor L.). Plant J. 2022, 111, 231–249. [Google Scholar] [CrossRef] [PubMed]
- Feria, A.B.; Bosch, N.; Sánchez, A.; Nieto-Ingelmo, A.; de la Osa, C.; Echevarría, C.; García-Mauriño, S.; Monreal, J.A. Phosphoenolpyruvate carboxylase (PPC) and PPC-kinase (PPC-k) isoenzymes in Arabidopsis thaliana: Role in control and abiotic stress conditions. Planta 2016, 244, 901–913. [Google Scholar] [CrossRef] [PubMed]
- Britto, D.T.; Krozunker, H.J. NH4+ toxicity in higher plants: A critical review. J. Plant Physiol. 2002, 159, 567–584. [Google Scholar] [CrossRef] [Green Version]
- Niu, Y.F.; Chai, R.S.; Jin, G.L.; Wang, H.; Tang, C.X.; Zhang, Y.S. Responses of root architecture development to low phosphorus availability: A review. Ann. Bot. 2013, 112, 391–408. [Google Scholar] [CrossRef] [PubMed]
- Gregory, A.L.; Hurley, B.A.; Tran, H.T.; Valentine, A.J.; She, Y.M.; Knowles, V.L.; Plaxton, W.C. In vivo regulatory phosphorylation of the phosphoenolpyruvate carboxylase AtPPC1 in phosphate-starved Arabidopsis thaliana. Biochem. J. 2009, 420, 57–65. [Google Scholar] [CrossRef] [Green Version]
- Chen, Z.H.; Nimmo, G.A.; Jenkins, G.I.; Nimmo, H.G. BHLH32 modulates several biochemical and morphological processes that respond to Pi starvation in Arabidopsis. Biochem. J. 2007, 405, 191–198. [Google Scholar] [CrossRef] [PubMed] [Green Version]
- Begum, H.H.; Osaki, M.; Watanabe, T.; Shinano, T. Mechanisms of aluminum tolerance in phosphoenolpyruvate carboxylase transgenic rice. J. Plant Nut. 2009, 32, 84–96. [Google Scholar] [CrossRef]
- de Carvalho Goncalves, J.F.; Cambraia, J.; Mosquim, P.R.; Araujo, E.F. Aluminum effect on organic acid production and accumulation in sorghum. J. Plant Nut. 2005, 28, 507–520. [Google Scholar] [CrossRef]
- Pérez-López, J.; Gandullo, J.; de la Osa, C.; Feria, A.B.; Echevarría, C.; Monreal, J.A.; García-Mauriño, S. Responses to aluminum and cadmium of a RNAi sorghum line with decreased levels of phosphoenolpyruvate carboxylase 3 (PPC3). Environ. Exp. Bot. 2023, 205, 105–139. [Google Scholar] [CrossRef]
- Willick, I.R.; Plaxton, W.C.; Lolle, S.J.; Macfie, S.M. Transcriptional and post-translational upregulation of phosphoenolpyruvate carboxylase in Arabidopsis thaliana (L. Heynh) under cadmium stress. Environ. Exp. Bot. 2019, 164, 29–39. [Google Scholar] [CrossRef]
- Feria, A.B.; Álvarez, R.; Cochereau, L.; Vidal, J.; García-Mauriño, S.; Echevarría, C. Regulation of phosphoenolpyruvate carboxylase phosphorylation by metabolites and ABA during the development and germination of barley seeds. Plant Physiol. 2008, 148, 761–774. [Google Scholar] [CrossRef] [PubMed] [Green Version]
- Feria, A.B.; Ruíz-Ballesta, I.; Baena, G.; Ruiz-López, N.; Echevarría, C.; Vidal, J. Phosphoenolpyruvate carboxylase and phosphoenolpyruvate carboxylase kinase isoenzymes play an important role in the filling and quality of Arabidopsis thaliana seed. Plant Physiol. Biochem. 2022, 190, 70–80. [Google Scholar] [CrossRef]
- Shi, J.; Yi, K.; Liu, Y.; Xie, L.; Zhou, Z.; Chen, Y.; Hu, Z.; Zheng, T.; Liu, R.; Chen, Y.; et al. Phosphoenolpyruvate carboxylase in Arabidopsis leaves plays a crucial role in carbon and nitrogen metabolism. Plant Physiol. 2015, 167, 671–681. [Google Scholar] [CrossRef] [Green Version]
- Lian, L.; Lin, Y.; Wei, Y.; He, W.; Cai, Q.; Huang, W.; Zheng, Y.; Xu, H.; Wang, F.; Zhu, Y.; et al. PEPC of sugarcane regulated glutathione S-transferase and altered carbon–nitrogen metabolism under different N source concentrations in Oryza sativa. BMC Plant Biol. 2021, 21, 287. [Google Scholar] [CrossRef] [PubMed]
- Aboubacar, A.; Axtell, J.D.; Huang, C.P.; Hamaker, B.R. A rapid protein digestibility assay for identifying highly digestible sorghum lines. Cereal Chem. 2001, 78, 160–165. [Google Scholar] [CrossRef]
- Li, A.; Jia, S.; Yobi, A.; Ge, Z.; Sato, S.J.; Zhang, C.; Angelovici, R.; Clemente, T.E.; Holding, D.R. Editing of an alpha-kafirin gene family increases, digestibility and protein quality in sorghum. Plant Physiol. 2018, 177, 1425–1438. [Google Scholar] [CrossRef] [PubMed] [Green Version]
- Fontaine, V.; Hartwell, J.; Jenkins, G.I.; Nimmo, G.A.; Nimmo, H.G. Arabidopsis thaliana contains two phosphoenolpyruvate carboxylase kinase genes with different expression patterns. Plant Cell Environ. 2002, 25, 115–122. [Google Scholar] [CrossRef]
- Meimoun, P.; Gousset-Dupont, A.; Lebouteiller, B.; Ambard-Bretteville, F.; Besin, E.; Lelarge, C.; Mauve, C.; Hodges, M.; Vidal, J. The impact of PEPC phosphorylation on growth and development of Arabidopsis thaliana: Molecular and physiological characterization of PEPC-kinase mutants. FEBS Lett. 2009, 583, 1649–1652. [Google Scholar] [CrossRef]
- Díaz, C.; Lemaître, T.; Christ, A.; Azzopardi, M.; Kato, Y.; Sato, F.; Morot-Gaudry, J.F.; Le Dily, F.; Masclaux-Daubresse, C. Nitrogen recycling and remobilization are differentially controlled by leaf senescence and development stage in Arabidopsis under low nitrogen nutrition. Plant Physiol. 2008, 147, 1437–1449. [Google Scholar] [CrossRef] [Green Version]
- Alvarez, R.; Gandullo, J.; Feria, A.B.; Dever, L.V.; Vidal, J.; Echevarría, C. Characterisation of seeds of a C4 phosphoenolpyruvate carboxylases-deficient mutant of Amaranthus edulis. Plant Biol. 2011, 13, 16–21. [Google Scholar] [CrossRef]
- Kaur, N.; Chugh, V.; Gupta, A.K. Essential fatty acids as functional components of foods- a review. J. Food Sci. Technol. 2014, 51, 2289–2303. [Google Scholar] [CrossRef] [Green Version]
- Mehmood, S.; Orhan, I.E.; Ahsan, Z.; Erdem, S.A. Fatty acid composition of seed oil of different Sorghum bicolor varieties. Food Chem. 2008, 109, 855–859. [Google Scholar] [CrossRef]
- Hong, S.; Pangloli, P.; Perumal, R.; Cox, S.; Noronha, L.E.; Dia, V.P.; Smolensky, D. A comparative study on phenolic content, antioxidant activity and anti-inflammatory capacity of aqueous and ethanolic extracts of sorghum in lipopolysaccharide-induced RAW 264.7 Macrophages. Antioxidants 2020, 9, 1297. [Google Scholar] [CrossRef] [PubMed]
- Kumari, P.; Kumar, V.; Kumar, R.; Pahuja, S.K. Sorghum polyphenols: Plant stress, human health benefits, and industrial applications. Planta 2021, 254, 47. [Google Scholar] [CrossRef]
- Wang, W.; Xie, Y.; Liu, L.; King, G.J.; White, P.; Ding, G.; Wang, S.; Cai, H.; Wang, C.; Xu, F.; et al. Genetic control of seed phytate accumulation and the development of low-phytate crops: A review and perspective. J. Agric. Food Chem. 2022, 70, 3375–3390. [Google Scholar] [CrossRef] [PubMed]
- ePlant Maize. Available online: http://bar.utoronto.ca/eplant/ (accessed on 2 May 2023).
- Waese, J.; Fan, J.; Pasha, A.; Yu, H.; Fucile, G.; Shi, R.; Cumming, M.; Kelley, L.; Sternberg, M.; Krishnakumar, V.; et al. ePlant: Visualizing and exploring multiple levels of data for hypothesis generation in plant biology. Plant Cell 2017, 29, 1806–1821. [Google Scholar] [CrossRef] [Green Version]
- Hewitt, E.J. Sand and water culture methods used in the study of plant nutrition. Soil Sci. Soc. Am. J. 1953, 17, 301. [Google Scholar] [CrossRef]
- Do, P.T.; Lee, H.; Nelson-Vasilchik, K.; Kausch, A.; Zhang, Z.J. Rapid and efficient genetic transformation of sorghum via Agrobacterium-mediated method. Curr. Protoc. Plant Biol. 2018, 3, e20077. [Google Scholar] [CrossRef] [PubMed]
- Vanholme, R.; Cesarino, I.; Rataj, K.; Xiao, Y.; Sundin, L.; Goeminne, G.; Kim, H.; Cross, J.; Morreel, K.; Araujo, P.; et al. Caffeoyl shikimate esterase (CSE) is an enzyme in the lignin biosynthetic pathway in Arabidopsis. Science 2013, 341, 1103–1106. [Google Scholar] [CrossRef]
- Bradford, M.M. A rapid and sensitive method for the quantitation of microgram quantities of protein utilizing the principle of protein-dye binding. Anal. Biochem. 1976, 72, 248–254. [Google Scholar] [CrossRef]
- Echevarría, C.; Pacquit, V.; Bakrim, N.; Osuna, L.; Delgado, B.; Arrio-Dupont, M.; Vidal, J. The effect of pH on the covalent and metabolic control of C4 phosphoenolpyruvate carboxylase from Sorghum leaf. Arch. Biochem. Biophys. 1994, 315, 425–430. [Google Scholar] [CrossRef] [PubMed]
- Livak, K.J.; Schmittgen, T.D. Analysis of relative gene expression data using real-time quantitative PCR and the 2−ΔΔCt method. Methods 2001, 25, 402–408. [Google Scholar] [CrossRef] [PubMed]
- Miller, G.L. Use of dinitrosalicylic acid reagent for determination of reducing sugar. Anal. Chem. 1959, 3, 426–428. [Google Scholar] [CrossRef]
- Sukhija, P.S.; Palmquist, D.L. Rapid method for determination of total fatty acid content and composition of feedstuffs and feces. J. Agric. Food Chem. 1988, 36, 1202–1206. [Google Scholar] [CrossRef]
- Porter, L.J.; Hrstich, L.N.; Chan, B.G. The conversion of procyanidins and prodelphinidins to cyanidin and delphinidin. Phytochemistry 1986, 25, 223–230. [Google Scholar] [CrossRef] [Green Version]


| Line | Pro-Q/SYPRO (%) |
|---|---|
| Wt dark | 100 |
| Wt light | 138 ± 22 |
| Ppck-2 dark | 134 ± 29 |
| Ppck-2 light | 141 ± 36 |
| Ppck-4 dark | 119 ± 25 |
| Ppck-4 light | 125 ± 24 |
| Line | Treatment | Plant Length (cm) | Shoot Weight (g) | Root Weight (g) |
|---|---|---|---|---|
| Wt | Control | 54.3 ± 0.5 | 5.4 ± 0.2 | 4.1 ± 0.3 |
| NaCl | 20.9 ± 0.3 * | 0.5 ± 0.1 * | 0.5 ± 0.1 | |
| Ppck-2 | Control | 34.2 ± 3.6 a | 1.6 ± 0.1 a | 1.7 ± 0.2 |
| NaCl | 12.4 ± 0.1 *a | 0.2 ± 0.1 *a | 0.2 ± 0.1 | |
| Ppck-4 | Control | 50.8 ± 1.1 a | 5.4 ± 0.7 | 3.8 ± 0.7 |
| NaCl | 19.0 ± 2.4 * | 0.4 ± 0.1 * | 0.3 ± 0.1 |
| Line | Treatment | Plant Length (cm) | Shoot Weight (g) | Root Weight (g) |
|---|---|---|---|---|
| Wt | Control | 61.5 ± 0.7 | 22.9 ± 1.8 | 11.5 ± 1.1 |
| -P | 29.7 ± 3.1 * | 3.0 ± 0.2 * | 4.0 ± 0.1 * | |
| PCa | 51.6 ± 2.0 * | 12.1 ± 3.1 * | 9.4 ± 2.2 | |
| Ppck-2 | Control | 56.6 ± 1.2 a | 22.6 ± 3.9 | 11.2 ± 1.4 |
| -P | 26.5 ± 0.2 * | 2.8 ± 0.1 * | 3.8 ± 0.1 * | |
| PCa | 48.8 ± 1.5 *a | 10.8 ± 2.8 | 8.1 ± 1.4 |
| Amino Acid (mg g−1 fw) | Wt | Ppck-2 | Ppck-4 |
|---|---|---|---|
| Asp | 1.82 ± 0.02 | 1.78 ± 0.04 | 1.57 ± 0.10 |
| Glu | 2.11 ± 0.02 | 2.00 ± 0.04 | 1.70 ± 0.08 a |
| Ala | 1.36 ± 0.05 | 1.40 ± 0.02 | 1.22 ± 0.08 |
| Arg | 1.01 ± 0.02 | 0.93 ± 0.02 a | 0.86 ± 0.05 a |
| Cys | 0.07 ± 0.01 | 0.06 ± 0.01 | 0.07 ± 0.01 |
| Phe | 1.28 ± 0.02 | 1.23 ± 0.02 | 1.14 ± 0.05 a |
| Gly | 1.04 ± 0.07 | 1.01 ± 0.06 | 0.97 ± 0.07 |
| His | 0.60 ± 0.01 | 0.57 ± 0.01 | 0.52 ± 0.03 a |
| Ile | 0.78 ± 0.01 | 0.75 ± 0.02 | 0.67 ± 0.03 a |
| Leu | 1.79 ± 0.03 | 1.70 ± 0.05 | 1.47 ± 0.10 a |
| Lys | 1.46 ± 0.02 | 1.36 ± 0.03 a | 1.25 ± 0.08 a |
| Met | 0.32 ± 0.01 | 0.34 ± 0.01 | 0.22 ± 0.03 a |
| Pro | 1.30 ± 0.01 | 1.29 ± 0.06 | 1.17 ± 0.02 a |
| Ser | 0.79 ± 0.01 | 0.78 ± 0.01 | 0.73 ± 0.04 |
| Tyr | 0.52 ± 0.01 | 0.49 ± 0.02 | 0.45 ± 0.04 |
| Hyp | 0.09 ± 0.01 | 0.09 ± 0.01 | 0.08 ± 0.01 |
| Thr | 0.91 ± 0.01 | 0.89 ± 0.01 | 0.81 ± 0.05 |
| Val | 0.89 ± 0.04 | 0.75 ± 0.01 a | 0.73 ± 0.01 a |
| Line | Amino Acids (mg g−1 fw) | Total C (%) | Total N (%) | C/N Ratio |
|---|---|---|---|---|
| Wt | 18.10 ± 0.18 | 39.73 ± 2.58 | 3.92 ± 0.19 | 10.12 ± 0.26 |
| Ppck-2 | 17.39 ± 0.40 | 42.93 ± 0.40 | 4.17 ± 0.07 | 10.30 ± 0.11 |
| Ppck-4 | 15.62 ± 0.81 a | 42.55 ± 0.14 | 3.76 ± 0.08 | 11.32 ± 0.26 a |
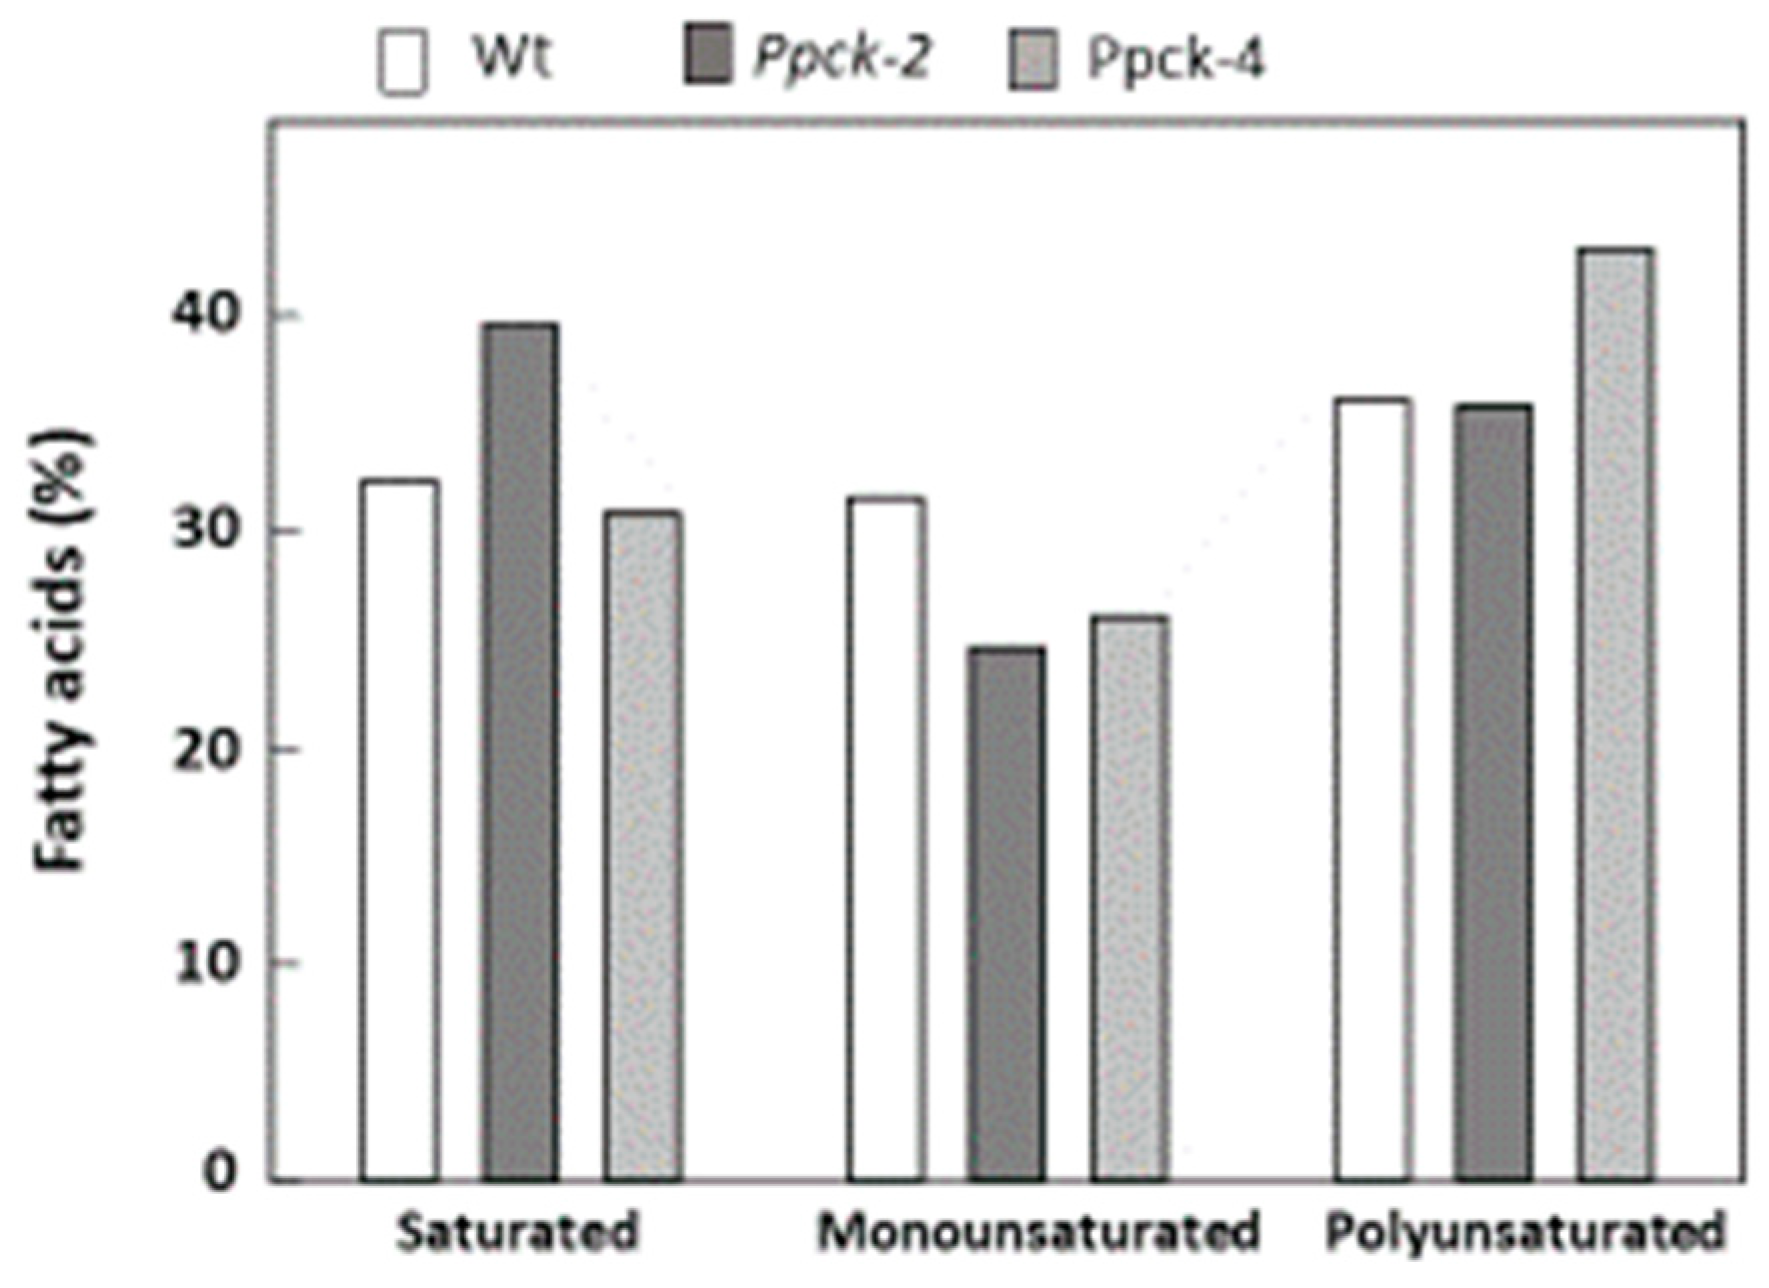
| Fatty Acid (%) | Wt | Ppck-2 | Ppck-4 |
|---|---|---|---|
| Palmitic acid | 26.88 ± 0.68 | 25.55 ± 0.38 | 28.01 ± 0.63 |
| Palmitoleic acid | 1.26 ± 0.04 | 1.55 ± 0.06 a | 1.59 ± 0.06 a |
| Suberic acid | 0.18 ± 0.01 | 0.29 ± 0.01 a | 0.34 ± 0.03 a |
| Azelaic acid | 0.16 ± 0.01 | 0.30 ± 0.02 a | 0.29 ± 0.02 a |
| Stearic acid | 12.54 ± 1.48 | 12.59 ± 0.25 | 14.17 ± 0.71 |
| Oleic acid | 7.73 ± 2.98 | 2.96 ± 0.39 | 2.29 ± 0.63 |
| Linoleic acid | 6.67 ± 0.59 | 8.17 ± 0.48 | 5.86 ± 0.22 |
| γ-Linolenic acid | 0.37 ± 0.05 | 0.26 ± 0.04 | 0.34 ± 0.04 |
| Arachidic acid | 0.53 ± 0.04 | 0.53 ± 0.07 | 0.60 ± 0.08 |
| α-Linolenic acid | 28.64 ± 3.61 | 34.85 ± 0.58 | 32.44 ± 1.06 |
| Eicosenoic acid | 0.74 ± 0.26 | 0.33 ± 0.04 | 0.17 ± 0.02 a |
| Arachidonic acid | 0.11 ± 0.02 | 0.25 ± 0.04 a | 0.33 ± 0.04 a |
| Line | Panicle Length (cm) | Panicle Weight (g) | Seed Weight (g) | Seed Number |
|---|---|---|---|---|
| Wt | 9.3 ± 0.8 | 6.9 ± 0.8 | 5.7 ± 0.6 | 204 ± 20 |
| Ppck-2 | 7.3 ± 0.1 a | 4.0 ± 0.5 a | 3.4 ± 0.4 a | 101 ± 20 a |
| Ppck-4 | 8.2 ± 0.6 | 5.2 ± 1.1 | 4.3 ± 0.6 | 131 ± 22 |
| Amino Acid (mg g−1 fw) | Wt | Ppck-2 | Ppck-4 |
|---|---|---|---|
| Asp | 4.86 ± 0.40 | 3.45 ± 0.18 a | 2.44 ± 0.39 a |
| Glu | 16.01 ± 1.55 | 9.91 ± 0.62 a | 6.64 ± 1.12 a |
| Ala | 6.62 ± 0.46 | 4.23 ± 0.26 a | 2.89 ± 0.57 a |
| Arg | 2.56 ± 0.30 | 1.94 ± 0.02 | 0.29 ± 0.04 a |
| Cys | 0.54 ± 0.03 | 0.41 ± 0.01 a | 0.07 ± 0.01 a |
| Phe | 3.50 ± 2.61 | 2.55 ± 0.16 a | 1.85 ± 0.27 a |
| Gly | 2.30 ± 0.21 | 1.64 ± 0.10 a | 1.20 ± 0.22 a |
| His | 2.09 ± 0.17 | 1.49 ± 0.08 a | 1.01 ± 0.15 a |
| Ile | 2.38 ± 0.21 | 1.59 ± 0.06 a | 1.15 ± 0.19 a |
| Leu | 10.40 ± 0.95 | 6.76 ± 0.40 a | 4.25 ± 0.69 a |
| Lys | 1.95 ± 0.18 | 1.47 ± 0.08 a | 1.08 ± 0.17 a |
| Met | 0.43 ± 0.09 | 0.25 ± 0.02 | 0.28 ± 0.02 |
| Pro | 7.85 ± 0.60 | 5.02 ± 0.25 a | 3.81 ± 0.72 a |
| Ser | 2.99 ± 0.22 | 2.01 ± 0.13 a | 1.31 ± 0.20 a |
| Tyr | 0.82 ± 0.01 | 0.71 ± 0.03 | 0.48 ± 0.08 a |
| Hyp | 0.12 ± 0.01 | 0.11 ± 0.01 a | 0.09 ± 0.01 a |
| Thr | 2.23 ± 0.18 | 1.57 ± 0.07 a | 1.10 ± 0.18 a |
| Val | 3.42 ± 0.35 | 2.12 ± 0.18 a | 1.43 ± 0.25 a |
| Line | Amino Acids (mg g−1 fw) | Starch (µmol mg−1) | Tannins (mg g−1) | Phytates (g%) |
|---|---|---|---|---|
| WT | 71.05 ± 6.13 | 1.43 ± 0.02 | 1.39 ± 0.36 | 4.37 ± 0.08 |
| Ppck-2 | 47.23 ± 2.66 | 1.41 ± 0.03 | 2.36 ± 0.25 a | 4.78 ± 0.07 a |
| Ppck-4 | 32.52 ± 5.46 a | 1.23 ± 0.04 a | 1.50 ± 0.36 | 5.47 ± 0.08 a |
| Line | Total C (%) | Total N (%) | C/N Ratio |
|---|---|---|---|
| Wt | 41.90 | 1.51 | 27.75 |
| Ppck-2 | 40.64 | 1.32 | 30.81 |
| Ppck-4 | 40.07 | 1.13 | 35.59 |
| Fatty Acid (%) | Wt | Ppck-2 | Ppck-4 |
|---|---|---|---|
| Palmitic acid | 19.20 | 24.81 | 19.91 |
| Palmitoleic acid | 0.49 | 1.24 | 0.16 |
| Suberic acid | 0.05 | 0.05 | 0.05 |
| Azelaic acid | 0.05 | 0.05 | 0.04 |
| Stearic acid | 5.69 | 11.09 | 7.40 |
| Oleic acid | 26.62 | 22.21 | 25.45 |
| Linoleic acid | 34.00 | 33.64 | 39.40 |
| γ-Linolenic acid | 0.16 | 0.20 | 0.31 |
| Arachidic acid | 0.16 | 0.00 | 0.00 |
| α-Linolenic acid | 1.52 | 1.43 | 2.40 |
| Eicosenoic acid | 1.31 | 0.18 | 0.07 |
| Arachidonic acid | 0.10 | 0.06 | 0.36 |
| Line | Plant Length (cm) | Panicle Length (cm) | Panicle Weight (g) | Seed Weight (g) | Seed Number |
|---|---|---|---|---|---|
| Wt | 142.1 ± 3.2 | 13.5 ± 0.6 | 12.0 ± 2.6 | 9.9 ± 2.2 | 365.4 ± 64.7 |
| Ppck-1 | 138.9 ± 3.2 | 14.4 ± 1.0 | 10.8 ± 0.8 | 9.9 ± 1.2 | 300.0 ± 48.0 |
| Ppck-2 | 128.7 ± 4.2 a | 12.1 ± 0.7 | 9.2 ± 1.7 | 8.3 ± 1.4 | 271.2 ± 52.7 |
| Ppck-3 | 119.7 ± 4.5 a | 13.8 ± 0.8 | 17.0 ± 2.2 a | 12.8 ± 2.3 | 478.9 ± 67.0 |
| Ppck-4 | 150.8 ± 3.8 | 11.7 ± 0.3 a | 9.0 ± 0.8 | 8.2 ± 0.7 | 268.3 ± 23.7 |
| Ppck-5 | 147.0 ± 7.6 | 13.2 ± 1.3 | 11.2 ± 2.2 | 13.0 ± 5.2 | 453.3 ± 133.1 |
| Ppck-6 | 144.7 ± 4.5 | 11.4 ± 0.5 a | 9.4 ± 0.7 | 7.5 ± 0.8 | 245.8 ± 23.7 |
| Ppck-7 | 137.8 ± 8.6 | 15.1 ± 0.7 | 18.2 ± 3.0 | 15.4 ± 2.2 a | 587.3 ± 89.6 a |
| Ppck-8 | 138.0 ± 5.1 | 12.5 ± 1.4 | 11.4 ± 2.3 | 9.4 ± 1.8 | 391.8 ± 98.4 |
| Ppck-9 | 92.5 ± 7.4 a | 10.9 ± 0.7 a | 3.5 ± 0.9 a | 1.6 ± 0.7 a | 42.7 ± 18.0 a |
| Ppck-10 | 135.4 ± 9.8 | 12.1 ± 1.1 | 8.0 ± 2.3 | 7.1 ± 2.0 | 309.8 ± 89.3 |
| Ppck-11 | 126.6 ± 6.0 a | 12.5 ± 0.9 | 10.0 ± 1.4 | 8.2 ± 1.0 | 300.2 ± 47.5 |
| Ppck-12 | 139.6 ± 5.6 | 14.6 ± 0.8 | 13.5 ± 1.4 | 11.0 ± 1.2 | 365.4 ± 64.7 |
Disclaimer/Publisher’s Note: The statements, opinions and data contained in all publications are solely those of the individual author(s) and contributor(s) and not of MDPI and/or the editor(s). MDPI and/or the editor(s) disclaim responsibility for any injury to people or property resulting from any ideas, methods, instructions or products referred to in the content. |
© 2023 by the authors. Licensee MDPI, Basel, Switzerland. This article is an open access article distributed under the terms and conditions of the Creative Commons Attribution (CC BY) license (https://creativecommons.org/licenses/by/4.0/).
Share and Cite
Pérez-López, J.; Feria, A.B.; Gandullo, J.; de la Osa, C.; Jiménez-Guerrero, I.; Echevarría, C.; Monreal, J.A.; García-Mauriño, S. Silencing of SbPPCK1-3 Negatively Affects Development, Stress Responses and Productivity in Sorghum. Plants 2023, 12, 2426. https://doi.org/10.3390/plants12132426
Pérez-López J, Feria AB, Gandullo J, de la Osa C, Jiménez-Guerrero I, Echevarría C, Monreal JA, García-Mauriño S. Silencing of SbPPCK1-3 Negatively Affects Development, Stress Responses and Productivity in Sorghum. Plants. 2023; 12(13):2426. https://doi.org/10.3390/plants12132426
Chicago/Turabian StylePérez-López, Jesús, Ana B. Feria, Jacinto Gandullo, Clara de la Osa, Irene Jiménez-Guerrero, Cristina Echevarría, José A. Monreal, and Sofía García-Mauriño. 2023. "Silencing of SbPPCK1-3 Negatively Affects Development, Stress Responses and Productivity in Sorghum" Plants 12, no. 13: 2426. https://doi.org/10.3390/plants12132426