Article

The Gas Production Characteristics of No. 3 Coal Seam Coalbed Methane Well in the Zhengbei Block and the Optimization of Favorable Development Areas

1
Key Laboratory of Coalbed Methane Resources and Reservoir Formation Process, Ministry of Education, China University of Mining and Technology, Xuzhou 221008, China
2
CBM Branch Company, Huabei Oilfield of PetroChina, Changzhi 046000, China
*
Author to whom correspondence should be addressed.
Processes 2024, 12(9), 2018; https://doi.org/10.3390/pr12092018
Submission received: 22 July 2024 / Revised: 31 August 2024 / Accepted: 9 September 2024 / Published: 19 September 2024
(This article belongs to the Special Issue Advances in Enhancing Unconventional Oil/Gas Recovery, 2nd Edition)

Abstract

:
The characteristics and influencing factors of gas production in CBM wells are analyzed based on the field geological data and the productivity data of coalbed methane (CBM) wells in the Zhengbei block, and then the favorable areas are divided. The results show that the average gas production of No. 3 coal seam CBM wells in the study area is in the range of 0~1793 m3/d, with an average of 250.97 m3/d; 80% of the wells are less than 500 m3/d, and there are fewer wells above 1000 m3/d. The average gas production is positively correlated with gas content, critical desorption pressure, permeability, Young’s modulus, and Schlumberger ratio, and negatively correlated with fracture index, fault fractal dimension, Poisson’s ratio, and horizontal stress difference coefficient. The relationship between coal seam thickness and the minimum horizontal principal stress is not strong. The low-yield wells have the characteristics of multiple pump-stopping disturbances, unstable casing pressure control, overly rapid pressure reduction in the single-phase flow stage, sand and pulverized coal production, and high-yield water in the later stage during the drainage process. It may be caused by the small difference in compressive strength between the roof and floor and the coal seam, and the small difference in the Young’s modulus of the floor. The difference between the two high-yield wells is large, and the fracturing cracks are easily controlled in the coal seam and extend along the level. The production control factors from strong to weak are as follows: critical desorption pressure, permeability, Schlumberger ratio, fault fractal dimension, Young’s modulus, horizontal stress difference coefficient, minimum horizontal principal stress, gas content, Poisson’s ratio, fracture index, coal seam thickness. The type I development unit (development of favorable areas) of the Zhengbei block is interspersed with the north and south of the block on the plane, and the III development unit is mainly located in the east of the block and near the Z-56 well. The comprehensive index has a significant positive correlation with the gas production, and the prediction results are accurate.

1. Introduction

Coalbed methane (CBM), celebrated for its clean and efficient energy profile, has captured the attention of the global community. The significance of CBM in the energy sector is underscored by recent studies, which highlight its potential as a sustainable alternative to conventional fossil fuels [1,2]. The development of CBM resources in China holds profound strategic importance, as it not only diversifies the nation’s energy portfolio but also aligns with the global shift towards sustainable energy solutions [3]. China, with its numerous CBM-rich basins, is leading the way in leveraging this resource to fulfill its burgeoning energy requirements and to advance environmental sustainability. Most of the commercial development of CBM is in the southern part of the Qinshui Basin and some areas in the eastern part of the Ordos Basin [4]. The development area is limited and the number of gas-producing coal seams is small. The commercial development area of CBM in the south of Qinshui Basin is less than one-fifth of the whole basin. The Zhengbei block in the south of Qinshui Basin, as an important coal production base in China, is one of the earliest commercially developed blocks of high-rank coal-bed methane in China. The geological profile is characterized by a high gas content, robust sealing properties, intricate fault structures, significant variations in burial depth, low permeability, and pronounced heterogeneity. At present, the focus of commercial development is on the No. 3 coal seam of Shanxi Formation, and the early development is mainly of vertical wells and directional wells [5]. The mature technology of the Fanzhuang block, with relatively simple structure and geological conditions and high permeability, was copied in the early stage. The vertical well spacing and conventional fracturing were adopted. The overall developmental efficacy of open-hole multi-branch horizontal wells was suboptimal, with inefficient wells emerging consecutively. The average daily gas production from vertical wells was suboptimal, with the production rate of the combined production and construction scheme falling below 30% [6,7].
Given the aforementioned issue, prior research on the Zhengbei block has predominantly concentrated on the attributes of the coal reservoir and the enrichment patterns of CBM [8,9], CBM well drilling technology research [10,11], CBM well gas production difference and favorable area prediction [5,12], fracturing and reformable line evaluation [13,14], lack of systematic and in-depth research on gas production and its influencing factors, and lack of understanding of favorable areas for geological development and main controlling factors of production control, which seriously restricts the development of CBM resources in the Zhengbei block.
The gas production of CBM wells is closely related to the enrichment degree of CBM, reservoir permeability, reservoir modifiability, and other factors. This paper seeks to identify the factors and mechanisms influencing gas production by examining the geological conditions of CBM development in the No. 3 coal seam of the Zhengbei block. The entropy method is used to clarify the relationship between each influencing factor and gas production, and the distribution of favorable development areas is clarified, which provides theoretical support and practical guidance for the efficient development of CBM.

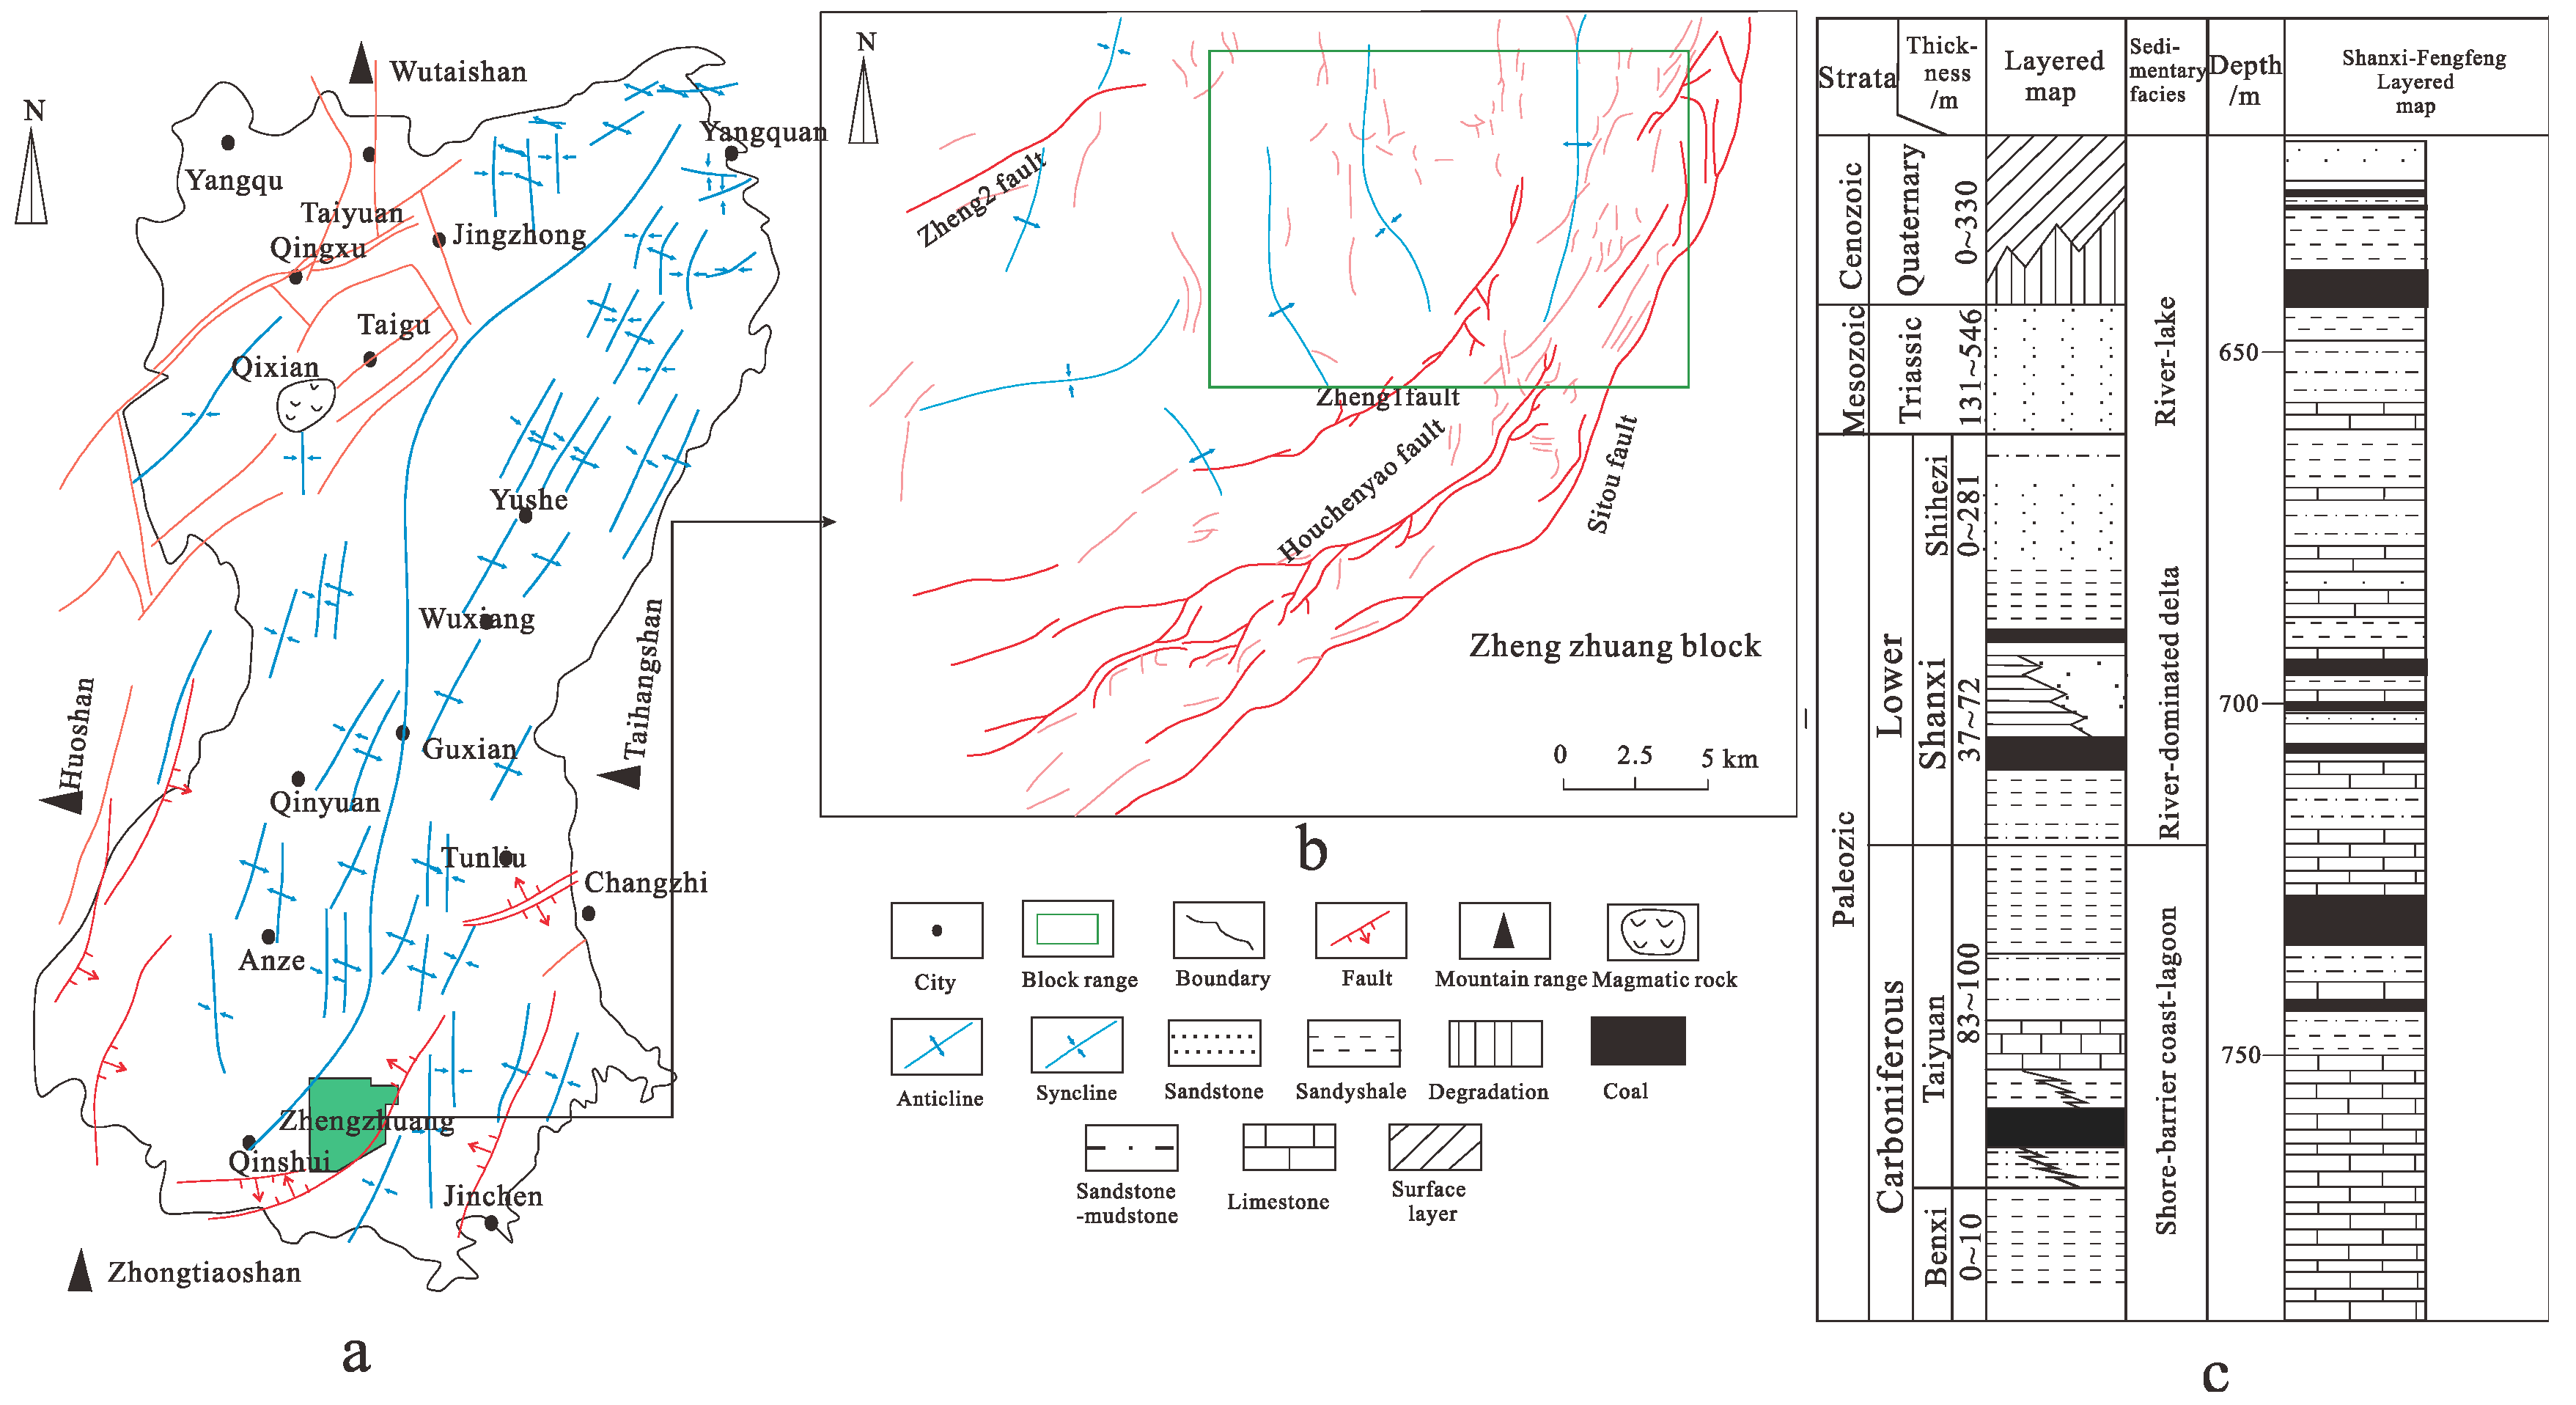
2. Geological Background

The Zhengzhuang block is located in the structural slope zone in the southern part of the Qinshui Basin. The southeast and Fanzhuang blocks are bounded by the Sitou fault, and there is no obvious boundary between the north and the west (Figure 1a). The overall structural form is a nearly NW–NNW-trending horseshoe-shaped inclined monoclinic structure. NE-trending normal faults are mainly developed in the block, with a small amount of NNE- or NEE-trending normal faults. The larger faults include the Zheng 1 fault, Zheng 2 fault, Houchengyao fault, and Sitou fault [15] (Figure 1b). All the data in the paper are from CBM Branch Company, Huabei Oilfield of PetroChina, Changzhi, China. The contour map is drawn by DFDraw4.0 (Beijing, China), the scatter plot is drawn by Origin2018 (Northampton, MA, USA), and the structural geological map and histogram are drawn by Coreldraw 2018 (Ottawa, ON, Canada).
The northern strata of the Zhengzhuang block are stable and gentle. From oldest to newest, they include the Fengfeng Formation, Benxi Formation, Taiyuan Formation, Shanxi Formation, Lower Shihezi Formation, Upper Shihezi Formation, Triassic, and Quaternary [14] (Figure 1c). The No. 3 target coal seam is located in the middle and lower section of Shanxi, which is stable in distribution and belongs to the delta plain swamp facies deposit. The buried depth of the coal seam is 601.3~1336.9 m, the thickness is 3.2~7.2 m, and the average thickness is 5.8 m. The maximum vitrinite reflectance is 3.29~3.98%, which belongs to anthracite. The well test permeability is between 0.011 mD and 0.75 mD, with an average of 0.164 mD. The macroscopic coal rock types are mainly semi-bright coal and bright coal. The micropores and small pores in the coal seam are more developed, and the CBM reservoir capacity is strong; the roof is mainly mudstone, the floor is mudstone or sandstone, and the sealing condition is good. The gas content of the coal seam is 11.09~29.68 m3/t, the average gas content is 21.12 m3/t, and the gas content is good.

3. CBM Well Productivity Characteristics

It is found that the average gas production of CBM wells is low, 80% of the wells are less than 500 m3/d, and there are few wells more than 1000 m3/d according to the drainage data of 75 CBM wells in the Zhengbei block. The water production is mostly concentrated at about 4 m3/d, and the local level is higher than 20 m3/d. The drainage time of CBM wells in the block is longer, and 64% of the wells have a drainage time of more than 10 years (Figure 2). The average gas production and cumulative gas production of coal seam drainage wells in the study area are mainly analyzed. The average gas production is between 0 and 1793 m3/d, with an average of 250.97 m3/d; the cumulative gas production ranges from 0 to 3,072,182 m3, with an average of 254,264.67 m3. The highest points of average gas production and cumulative gas production are mainly concentrated in the northern, central, and southeastern parts of the block, and the rest are low (Figure 3).

4. Control Factors of CBM Well Productivity

4.1. Gas-Bearing Enrichment Factors
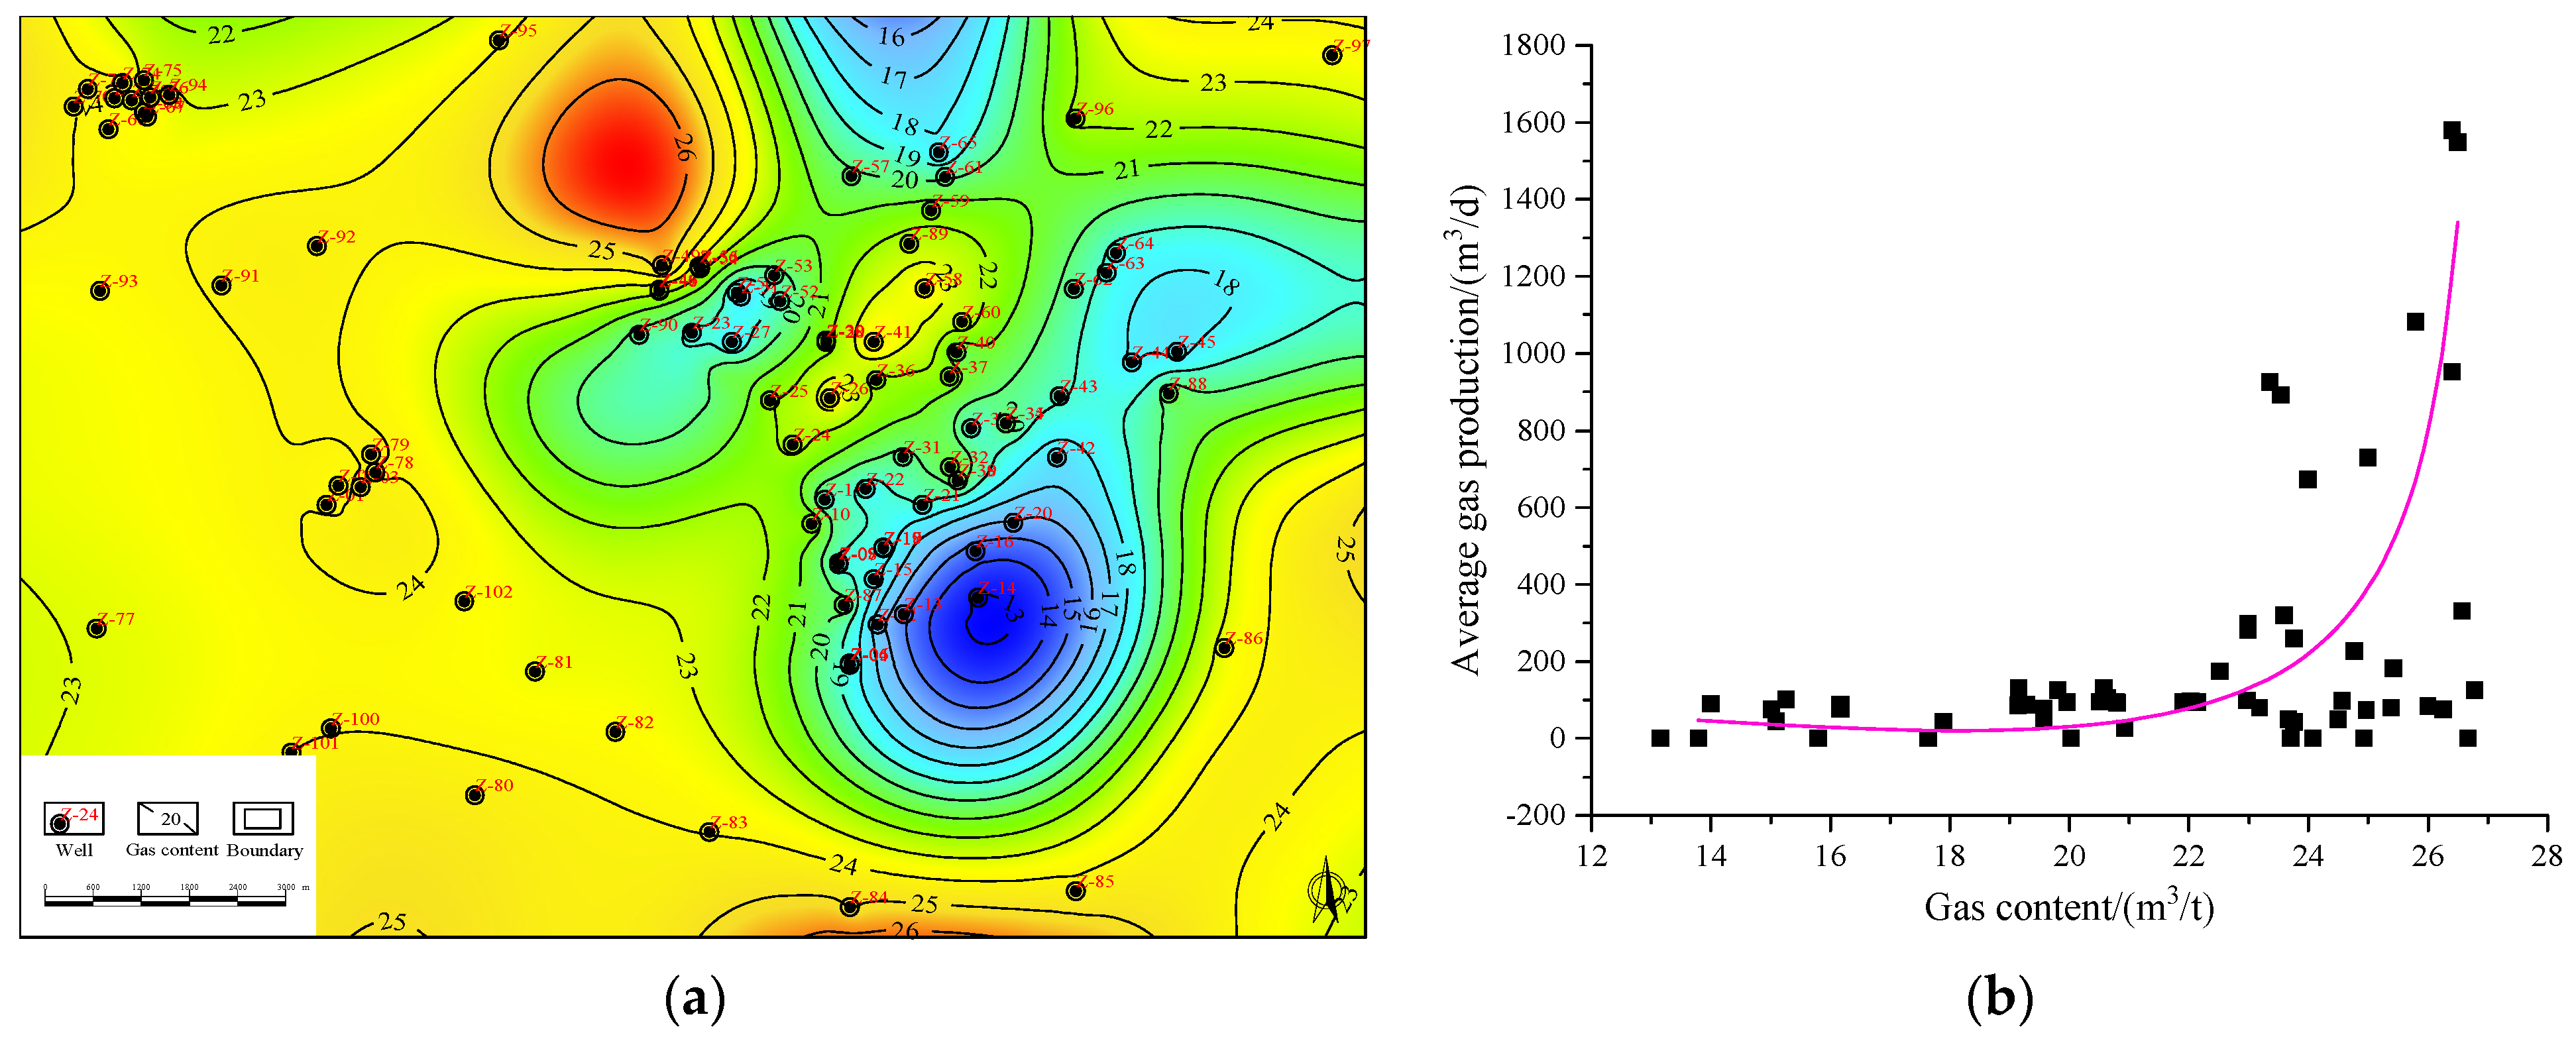
The enrichment degree of CBM is mainly controlled by four aspects, CBM content, coal seam thickness, fault fractal dimension, and critical desorption pressure. The thickness of the coal seam and its gas content form the foundation of CBM resources. The degree of resource enrichment is embodied in CBM saturation [16]. Furthermore, the fault fractal dimension serves as an indicator of structural strength and is associated with the dissipation of CBM. The fault zone is usually accompanied by the formation of cracks, which will change the permeability of the formation and affect the reservoir capacity of CBM [17]. The critical desorption pressure is usually used to describe the release capacity of CBM [16].

4.1.1. Gas Content

The gas content of No. 3 coal seam is in the range of 11.09~29.68 m3/t, with an average of 21.12 m3/t. The enrichment area is located in the west and south of the block and near the Z-95 well. The gas content is the lowest in the east, and the lowest point is near the Z-14 well (Figure 4a). The relationship between gas content and average gas production was analyzed. The study revealed that as the gas content increased, so did the gas production, and the correlation between these two variables was strong (Figure 4b).

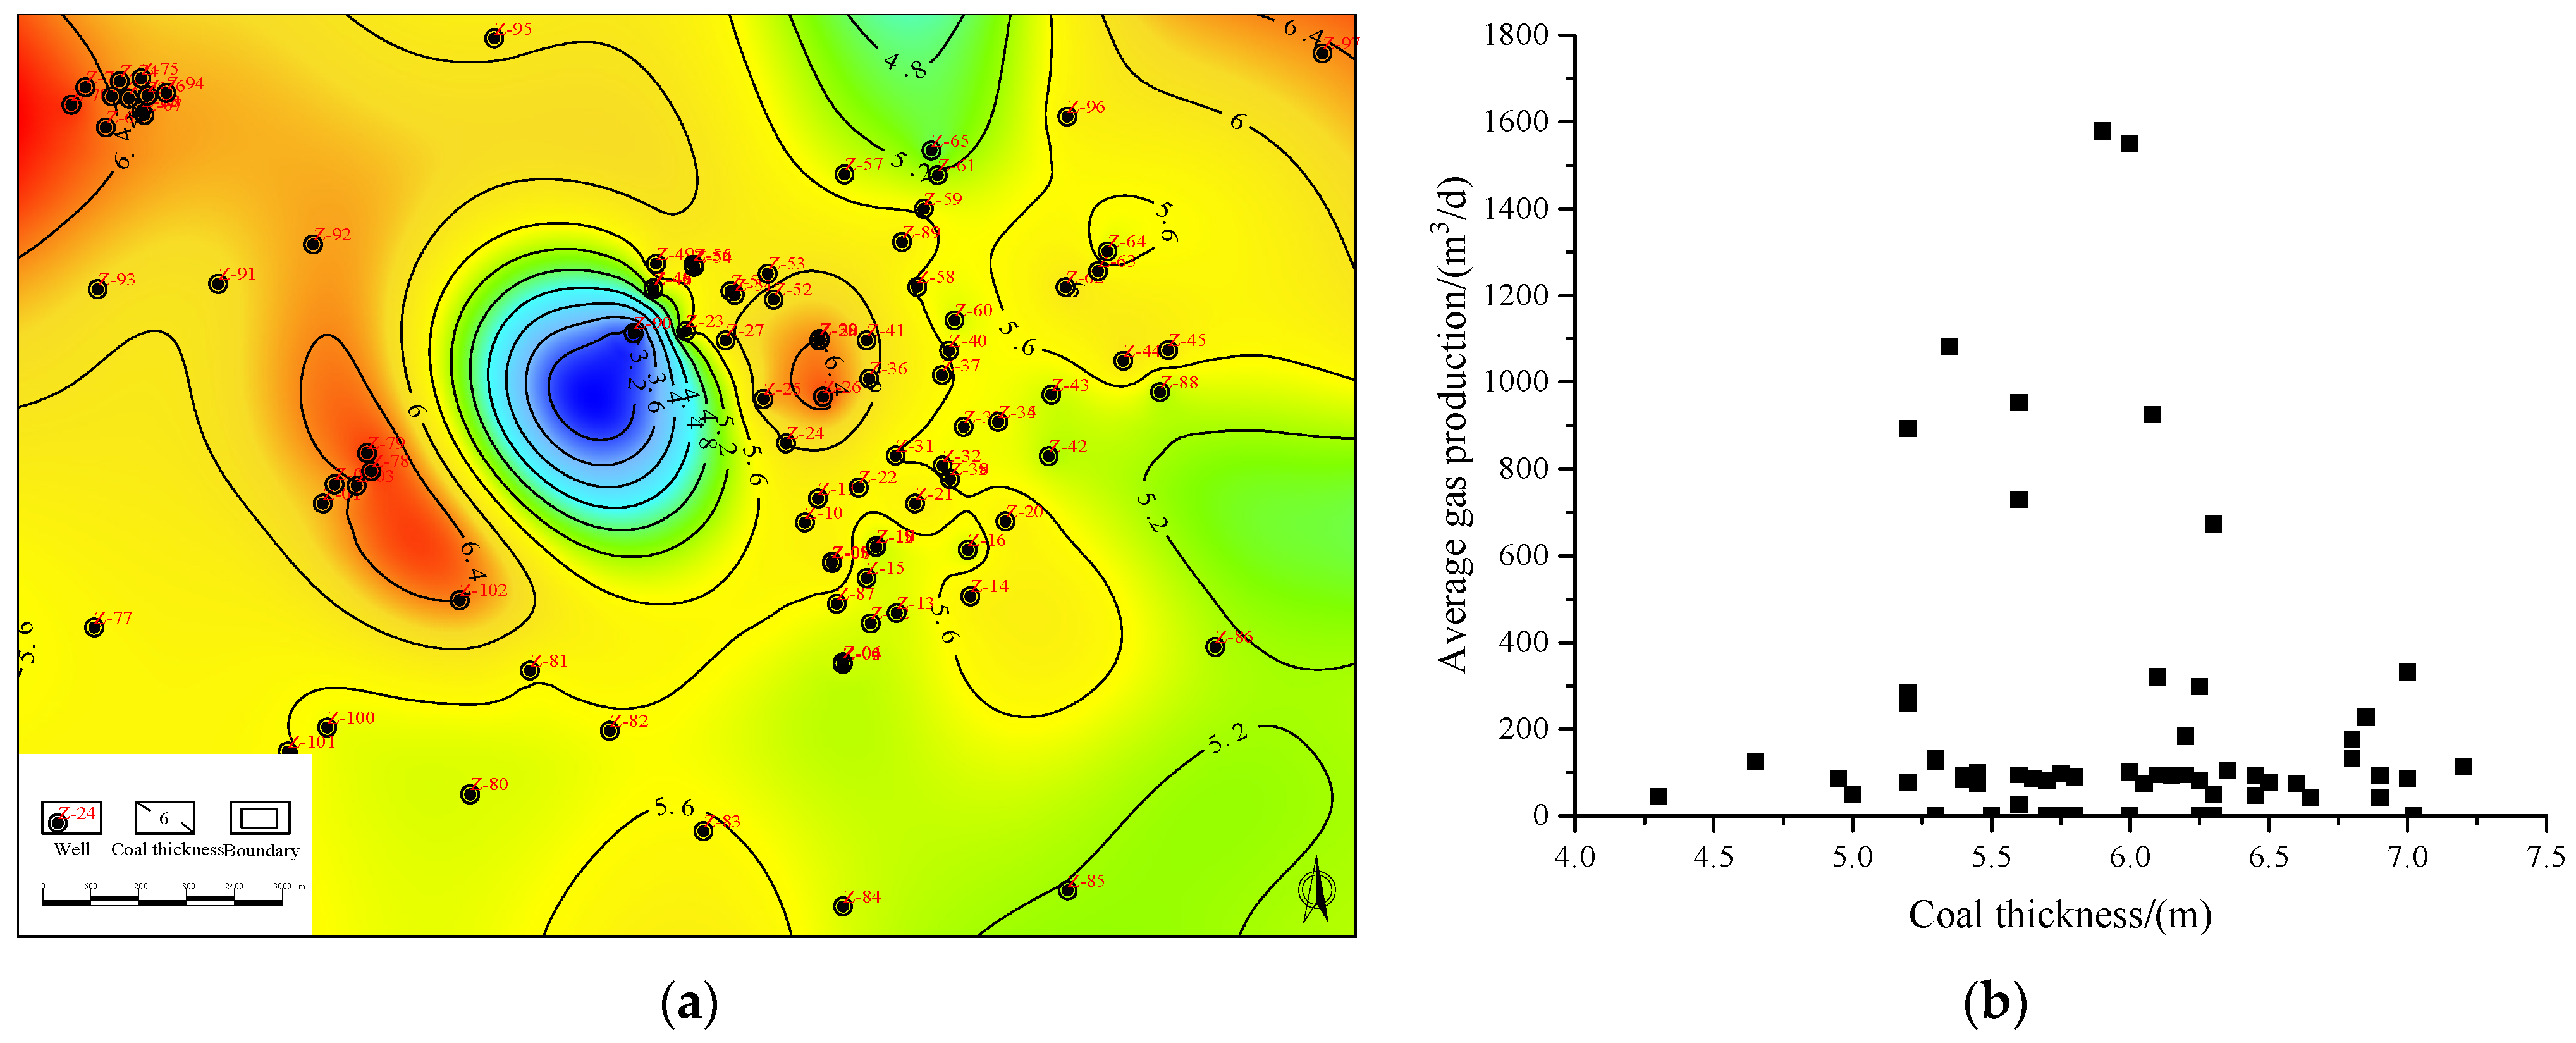
4.1.2. Coal Seam Thickness

The No. 3 coal seam is prevalent throughout the entire area, with a thickness ranging from 3.2 to 7.2 m. The average thickness of the coal seam is approximately 5.80 m, although in certain localized areas, it can exceed 6.5 m. The high-value area of more than 6 m is mainly located in the northwest of the block and near the Z-78 well. The thin coal seam is mainly distributed near the Z-90 well, and the distribution of the remaining areas is relatively uniform. The relationship between coal seam thickness and average gas production is relatively discrete, which may be related to the difference of CBM well drainage and reservoir physical properties [18] (Figure 5).

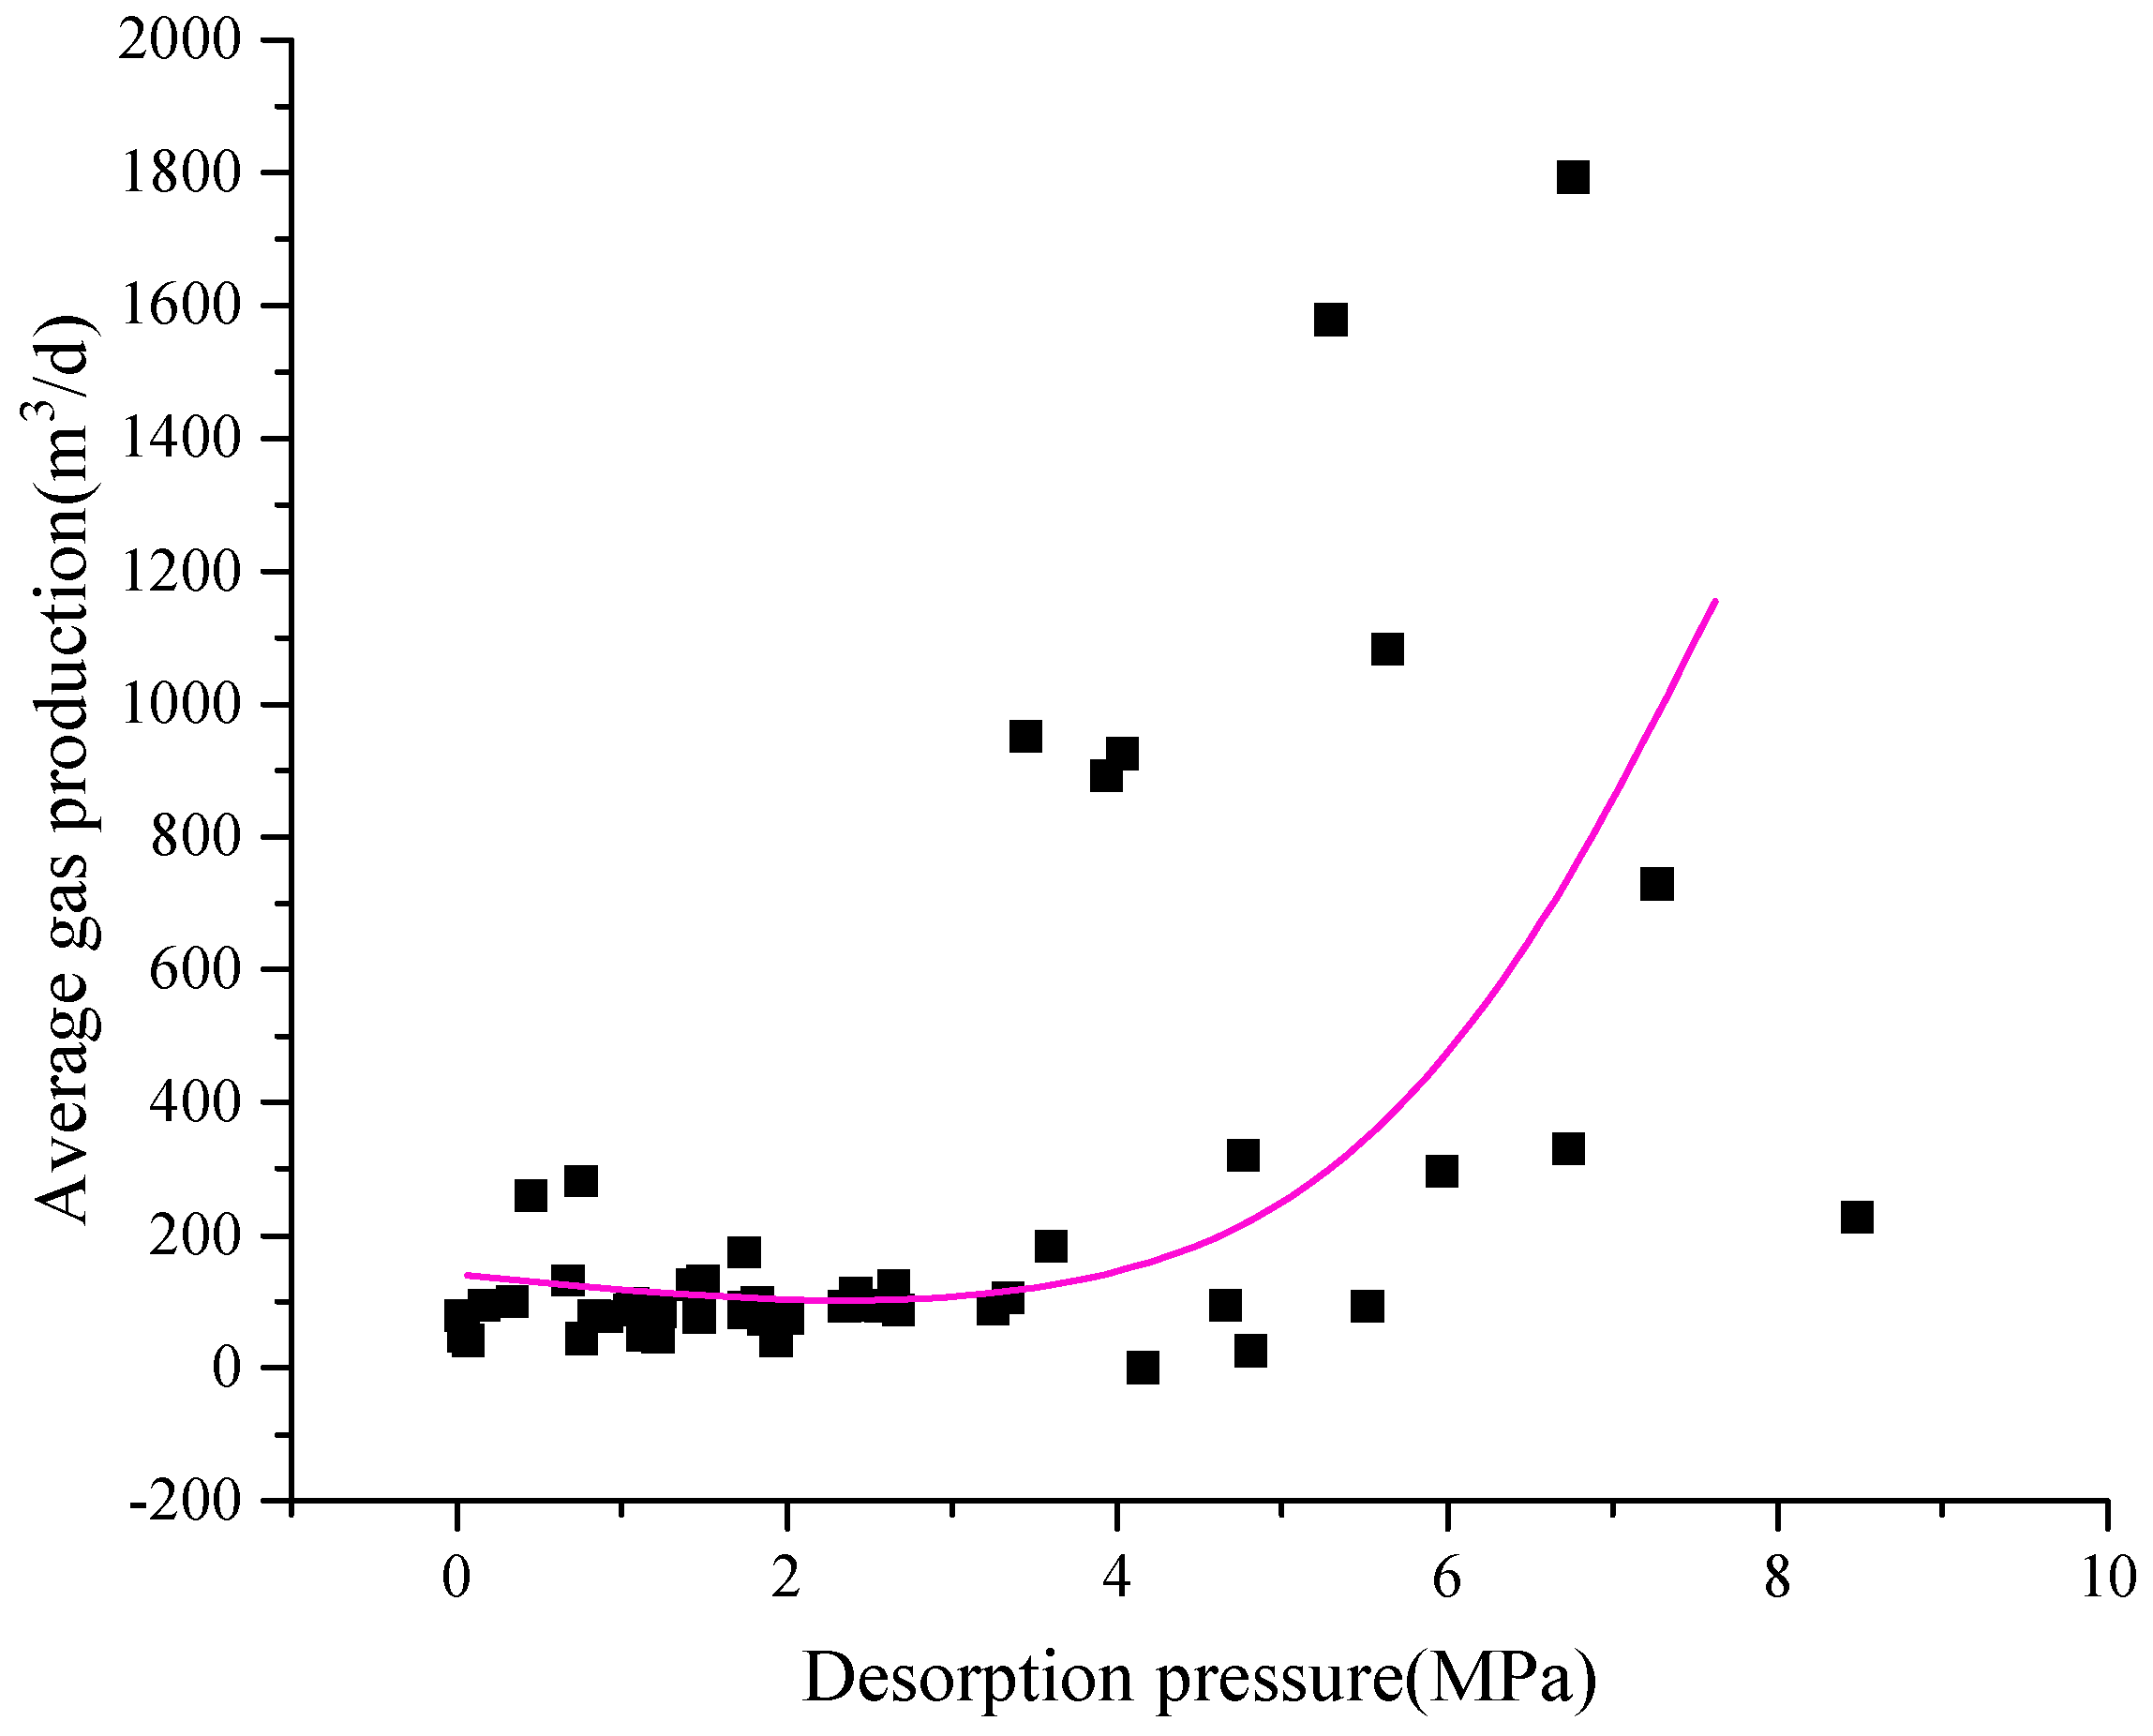
4.1.3. Critical Desorption Pressure

The CBM wells facilitate the production of coal seam water and reduce coal seam pressure by generating surface suction and expanding the production pressure difference. This process aims to maintain coal seam pressure below the critical desorption pressure, thereby ensuring continuous and stable gas production in the coal seam. Through the analysis of gas content, Langmuir volume, Langmuir pressure, and reservoir pressure, the critical desorption pressure of different well positions was further calculated (Equation (1)). Some well positions did not undergo isothermal adsorption experiments. Therefore, combined with the drainage data of CBM wells, the formation pressure at the time of gas breakthrough or a certain time before gas breakthrough (usually one day) was selected as the critical desorption pressure [19]. The average gas production in the study area is positively correlated with the critical desorption pressure (Figure 6). The critical desorption pressure of low-yield wells (<200 m3/d) is mostly lower than 4 MPa, and high-yield wells are accompanied by higher critical desorption pressure. Researchers have demonstrated that, given the same pressure, an increase in Langmuir volume corresponds to a higher degree of gas desorption and subsequently greater gas production [20]. The critical desorption pressure represents the driving energy of the coal reservoir after the gas production begins, affecting the time of CBM production.
P c d = V s P L V L V s
Pcd is the critical desorption pressure (MPa), vs. is the measured gas content (m3/t), PL is the Langmuir pressure (MPa), and VL is the Langmuir volume (m3/t).

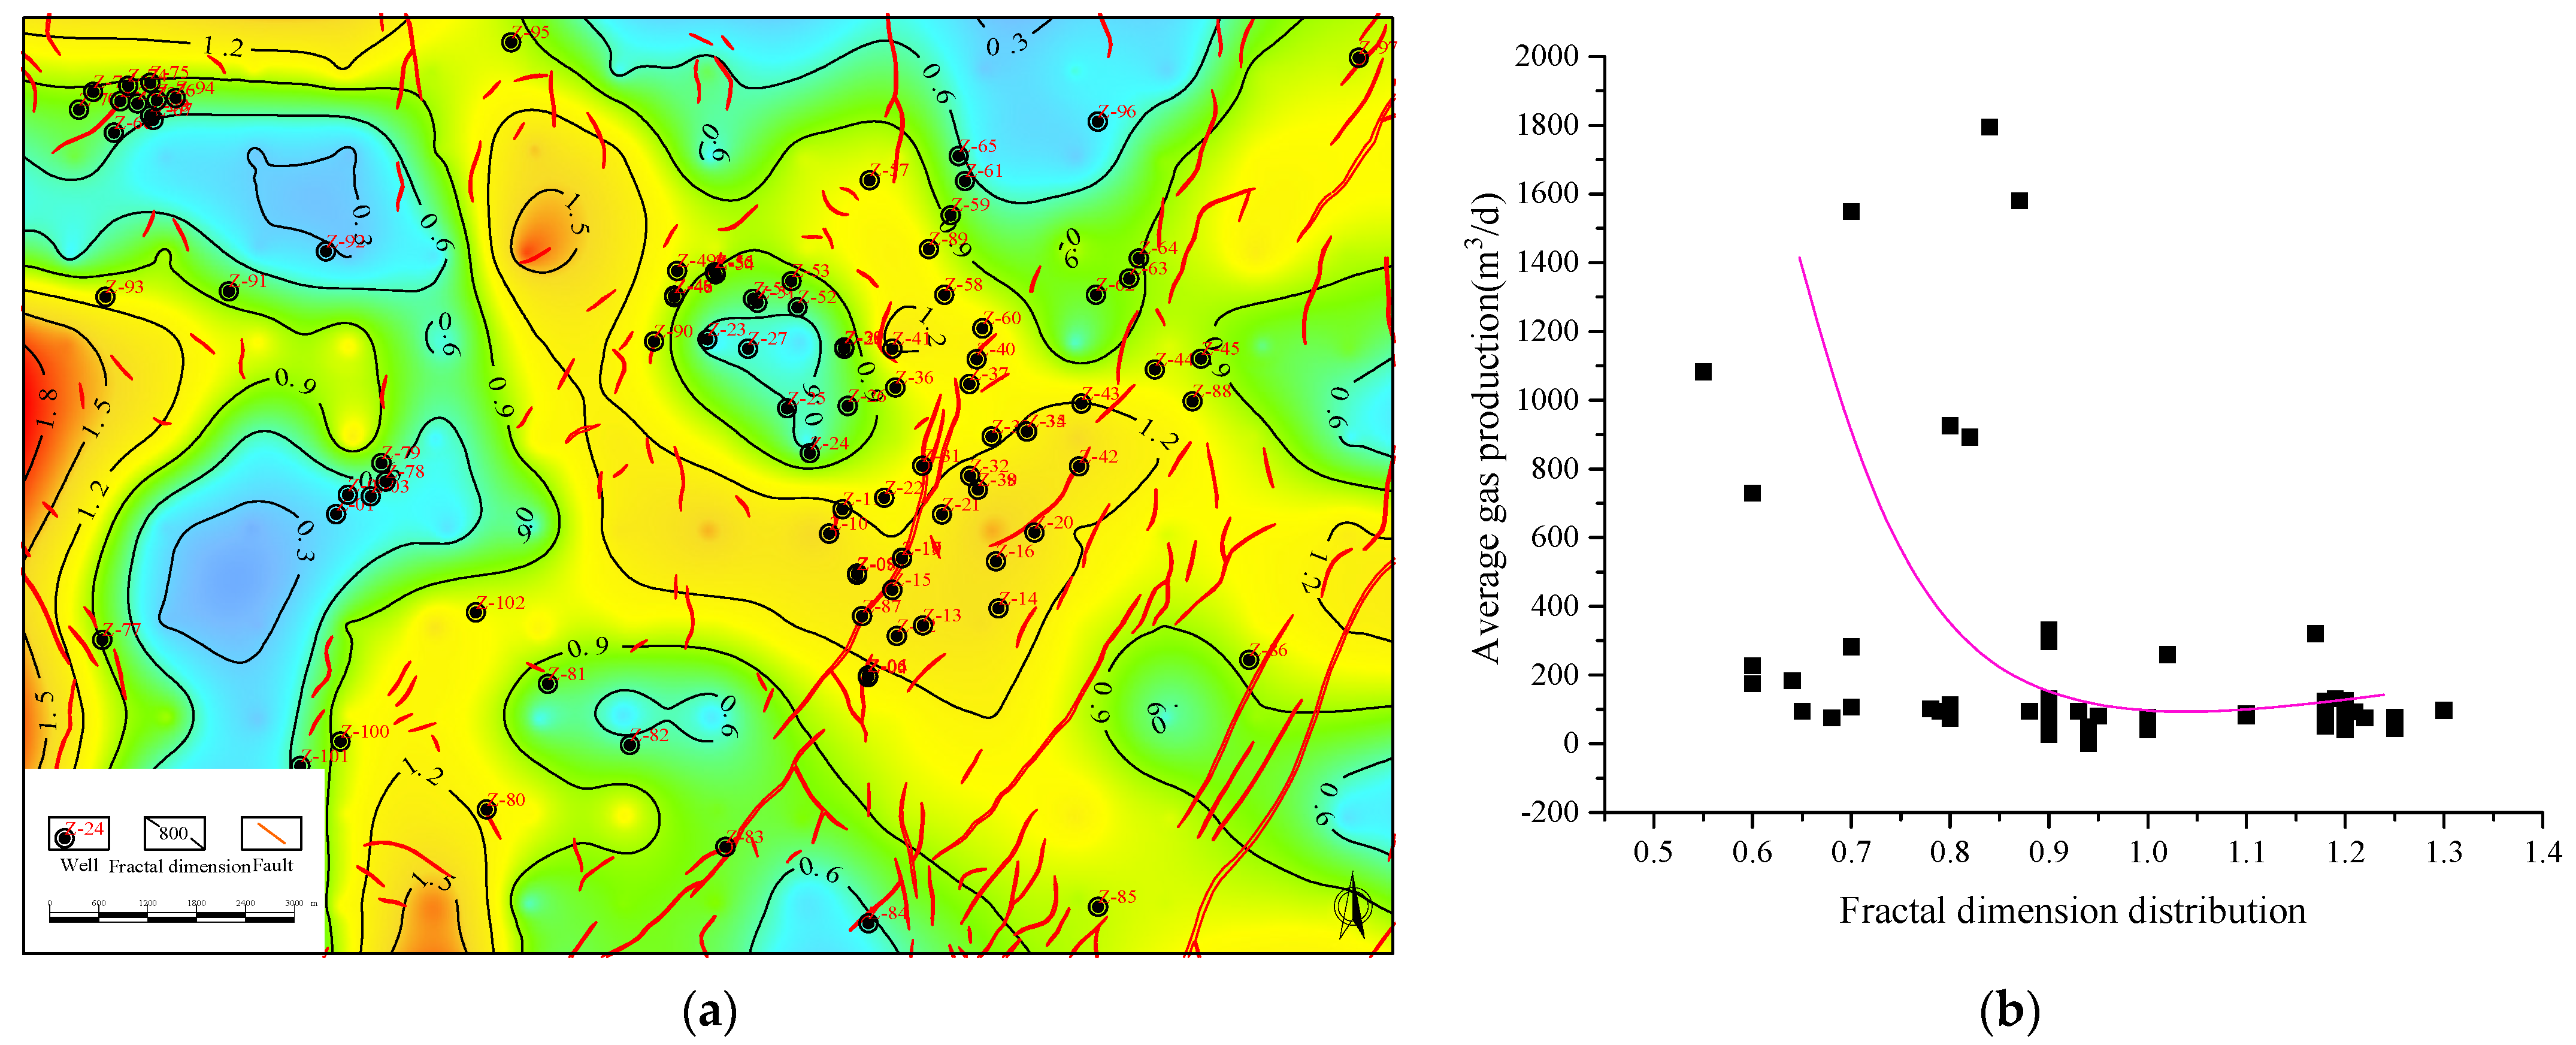
4.1.4. Fault Fractal Dimension

The fault structure serves as a crucial conduit for both CBM and water within the study area. To accurately and quantitatively represent the inherent complexity of this fault structure (Equation (2)), we employ similar dimension parameters for evaluation. The fractal dimension of the fault is determined using the grid covering method, as proposed by Wang in 2023 [21]. In the case of a research subject exhibiting self-similarity, if it can be segmented into N units, each of which maintains similarity to the whole at a ratio r, then the similarity dimension is defined accordingly,
D s = lg N r lg r
Ds is the similarity dimension, N(r) is the number of grids containing fault traces, and r is the similarity ratio.
The fractal dimension of faults in the study area is 0~2.493, with an average of 0.89. The faults are concentrated in the middle of the block, and the high-value area is in the west of the block. When integrated with the actual fault distribution, the results demonstrate consistency and reliability (Figure 7a). The relationship between the fractal dimension of faults and the average gas production shows that there is a negative correlation between them (Figure 7b). Tectonic action easily causes the fracture deformation of the formation, resulting in the development of faults and the destruction of the preservation conditions of CBM. At the same time, the local area is affected by the fracture structure’s communication with the aquifer, the water abundance is enhanced, and the difficulty of coal seam pressure reduction is also increased accordingly.

4.2. Permeability Factors
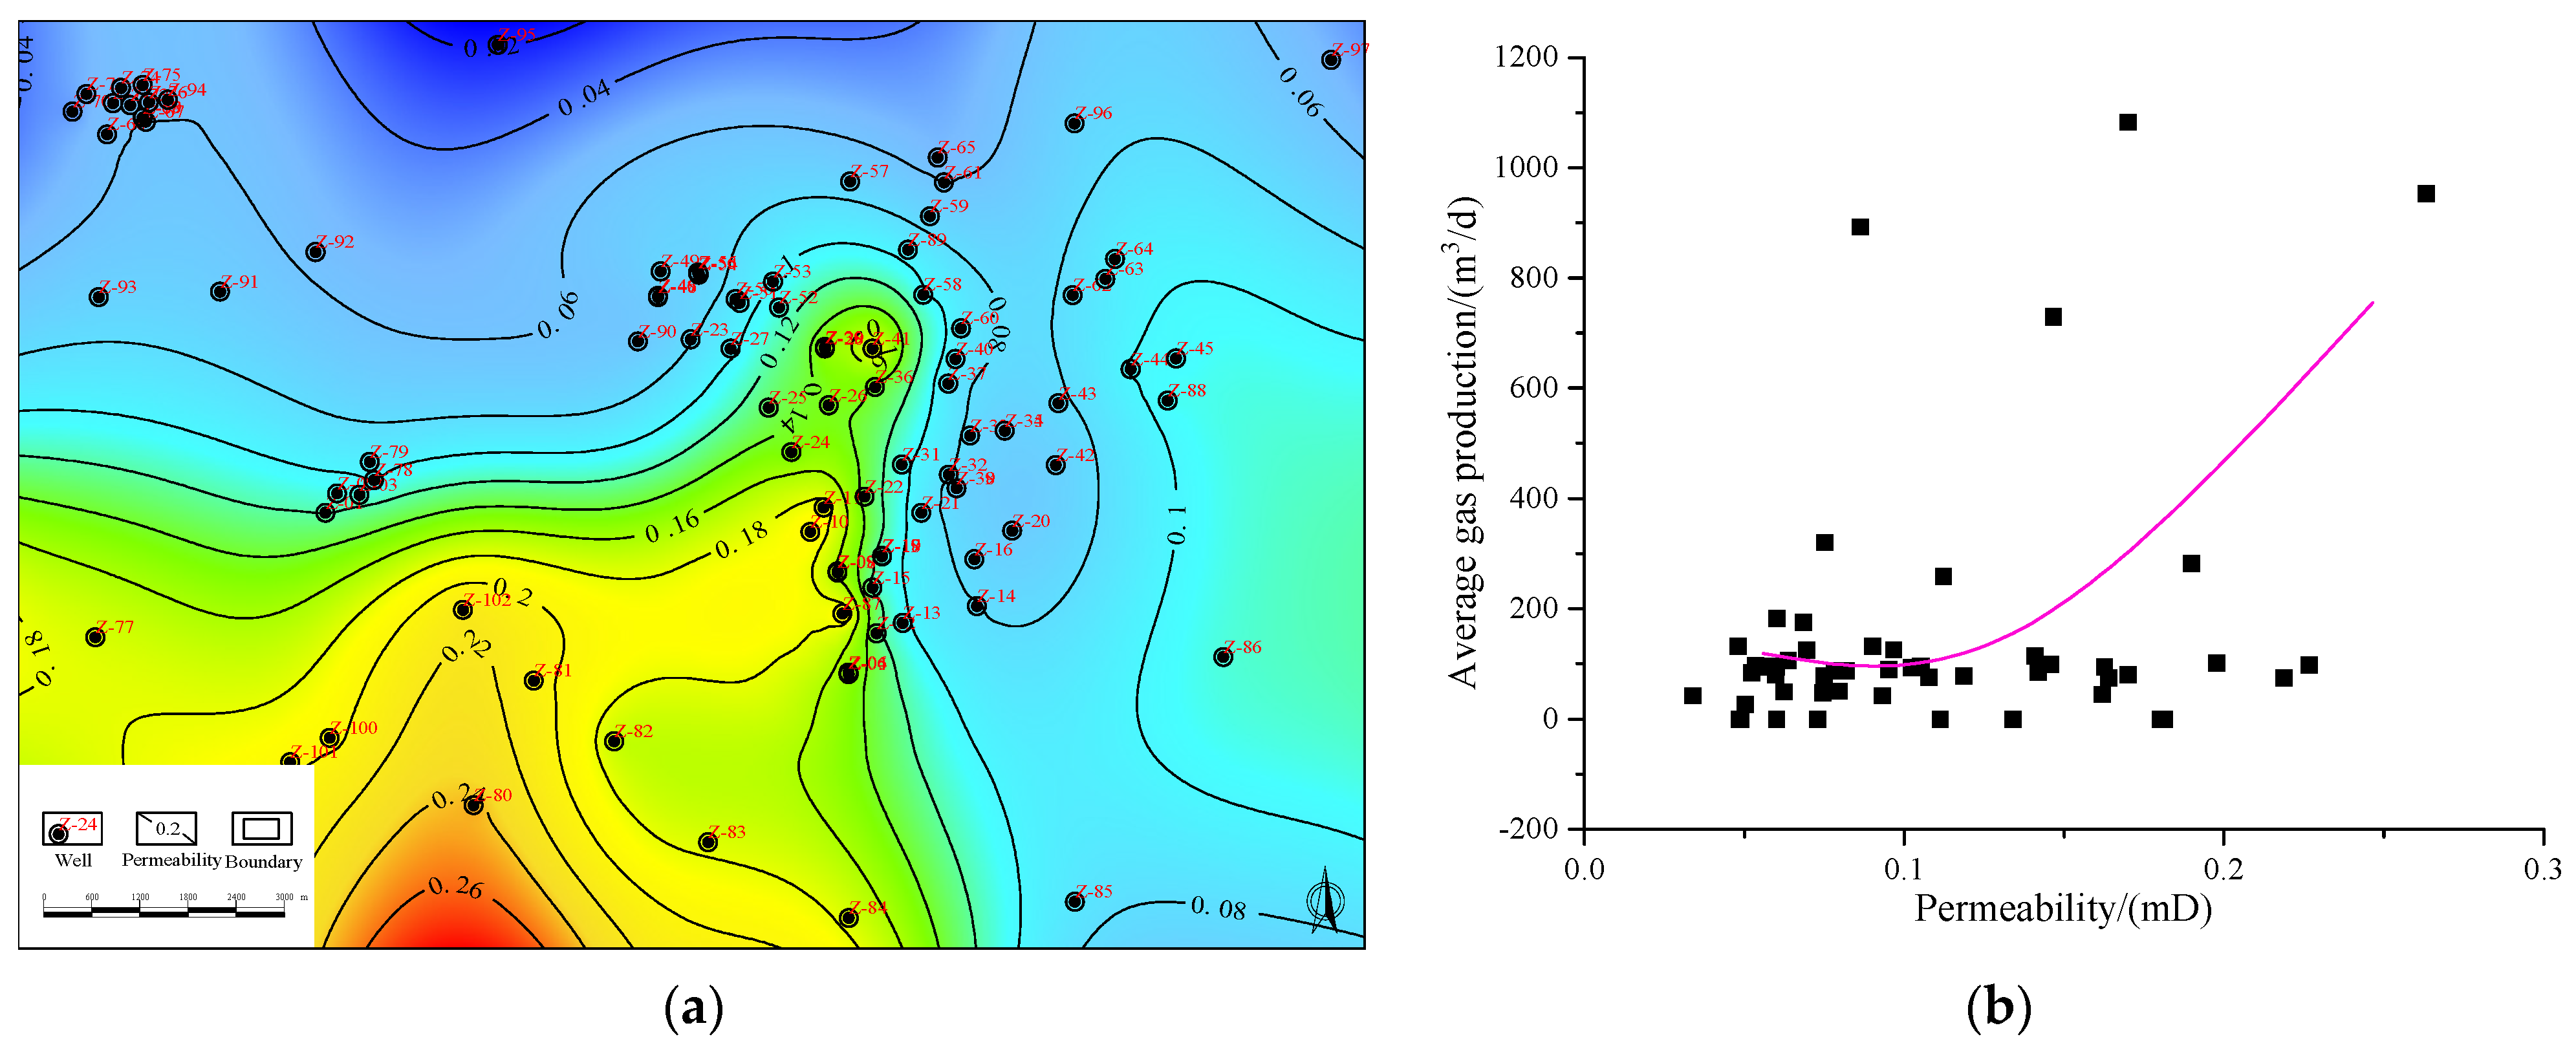
The permeability of the coal seam is the main influencing factor of CBM production. Permeability refers to the conductivity of a coal seam. The distribution of fractures within the coal seam is influenced by in situ stress, with the fracture index serving as an indicator of fracture enrichment. The permeability of the coal seam determines the strength of CBM transportation capacity [22,23].

4.2.1. Permeability

The permeability data in the study area are mainly from the injection pressure drop test. The permeability of the No. 3 coal seam is in the range of 0.011~0.75 mD, with an average of 0.164 mD. The plane distribution characteristics of permeability are shown in Figure 8a. The overall permeability shows that the southern and central parts of the block have higher values, and the northern part of the block is a low-permeability area, at less than 0.1 mD, which may be closely related to the monoclinic structure with high north and low south in the block. The well test permeability in the area is positively correlated with the gas production of CBM wells (Figure 8b).

4.2.2. Fracture Index

Previous studies have shown that rock mechanics parameters such as Young’s modulus can reflect the degree of fracture development of rock. The fracture index formula proposed by predecessors [24] is used to characterize the development of coal reservoir fractures from the perspective of the coal seam itself (Equation (3)). The larger the fracture index is, the more developed the fracture is, and the higher the degree of coal fragmentation. The fracture index of the No. 3 coal seam in the study area is between 0.28 and 0.35, with an average of 0.3. The high-value area is mainly located in the middle of the block on the plane, and the rest is low-value (Figure 9a). Overall, the fracture index is negatively correlated with the average gas production(Figure 9b). The reason for the result may be that the excessive development of fractures will lead to the premature dissipation of coalbed methane, and the increase of fractures will increase the risk of formation water invading the coal seam, especially in the case of the underlying or overlying aquifer connected to the coal seam.
Y = E ma E E ma
Y is the fracture index, Ema is the dynamic Young’s modulus of coal rock skeleton (GPa), and E is the Young’s modulus of the coal seam (GPa).

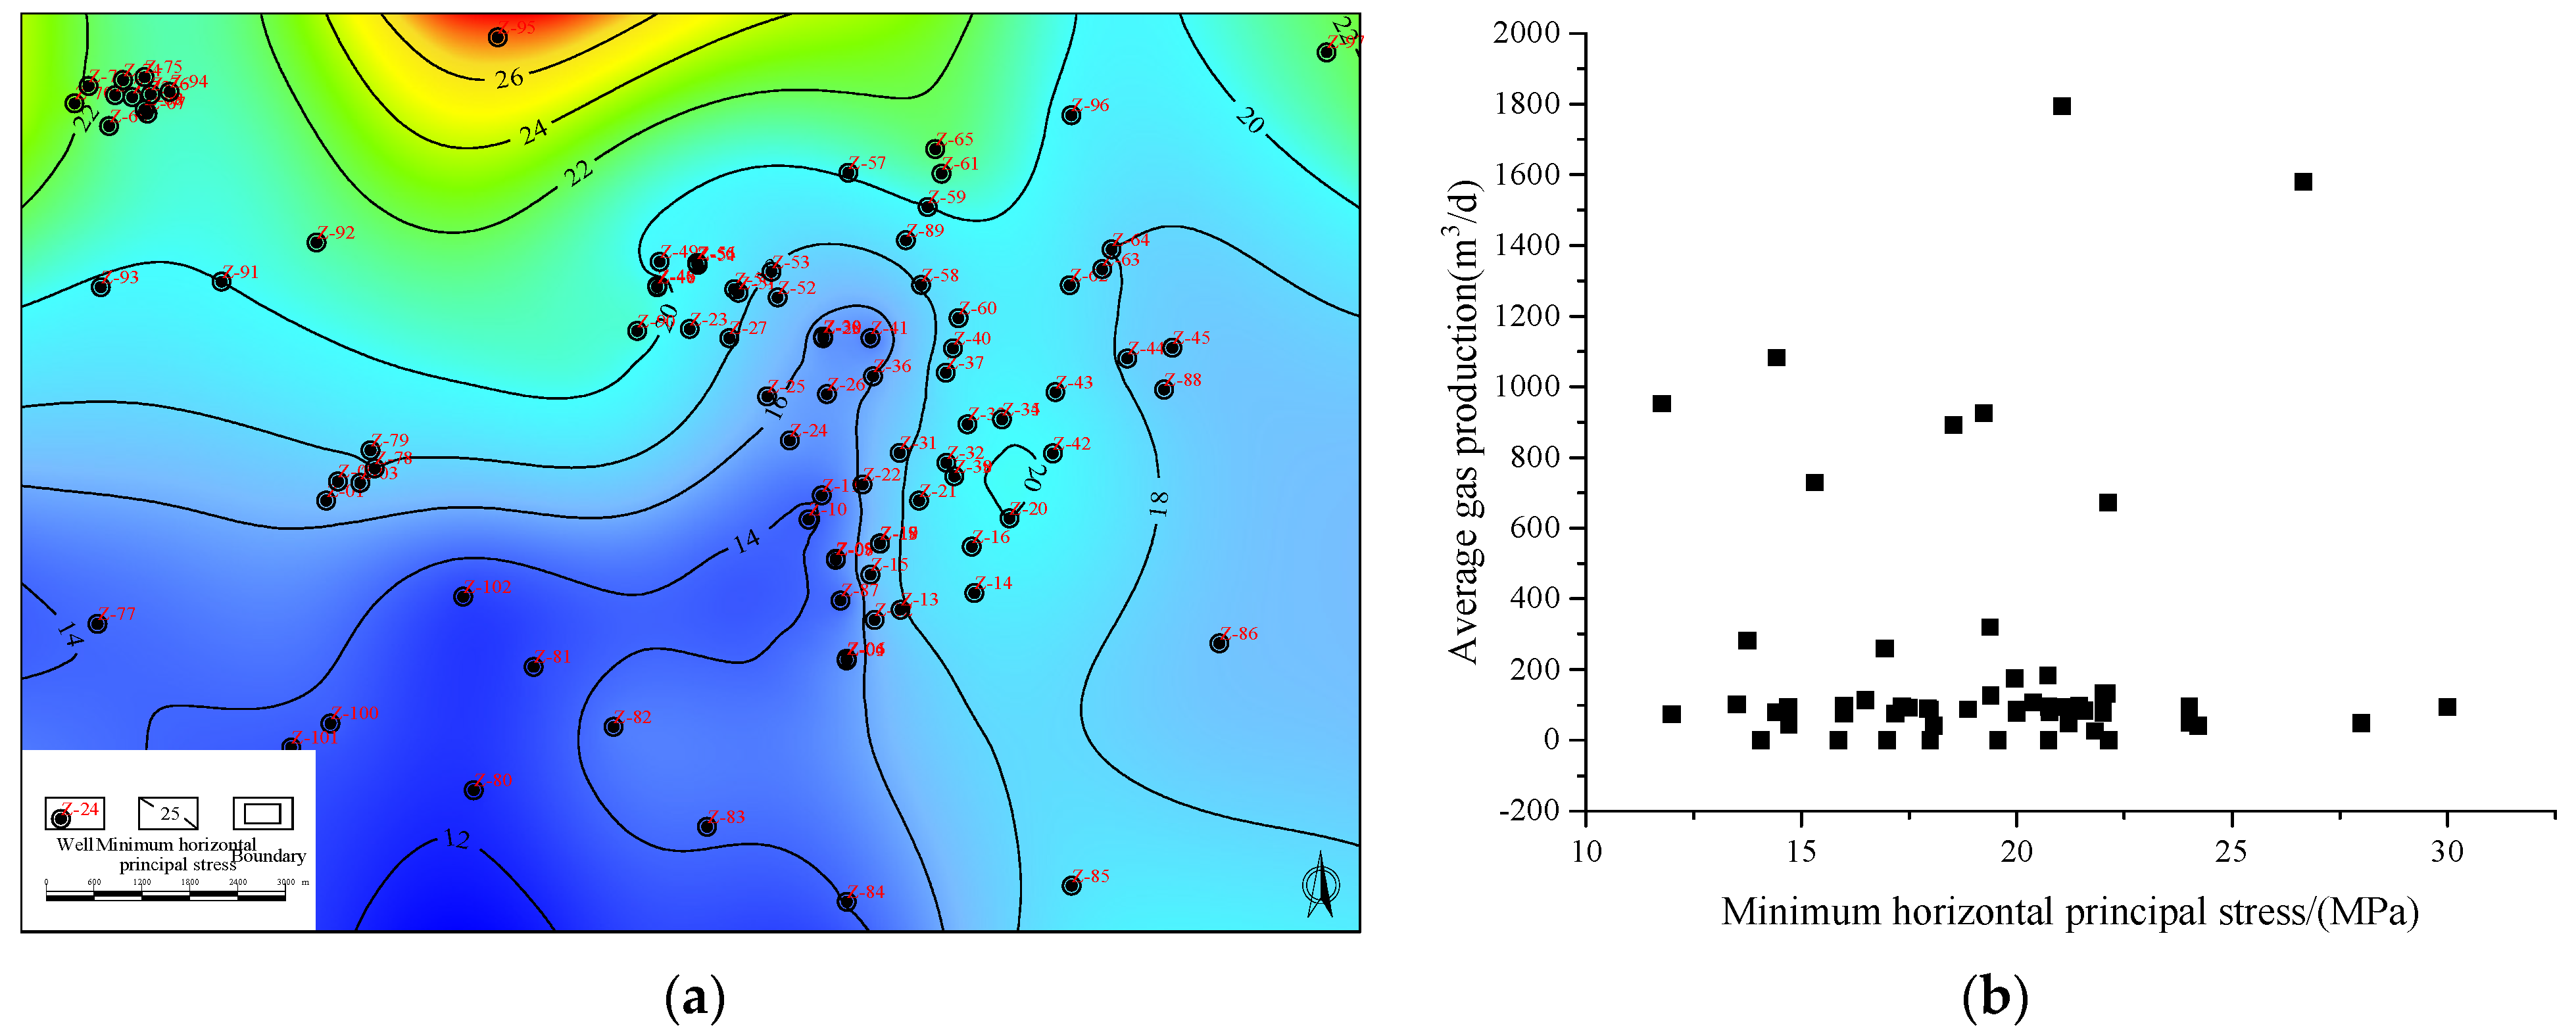
4.2.3. Minimum Horizontal Principal Stress

The minimum horizontal principal stress is an important basic datum for fracturing design, fracture height control, and post-fracturing effect evaluation of unconventional oil and gas reservoirs. It is closely related to the closure pressure of fractures during fracturing [22,25]. Based on the collected logging data, the Huang’s model [26] is used to calculate Equations (4) and (5),
S H = ( μ 1 μ + β ) ( S V α P p ) + α P p
S h = ( μ 1 μ + γ ) ( S V α P p ) + α P p
SH is the maximum horizontal principal stress (MPa), Sh is the minimum horizontal principal stress (MPa), Sv is the vertical column stress (MPa), v is Poisson’s ratio (dimensionless), α is the Biot’s coefficient, Pp is the reservoir pressure (MPa), and β and γ are the structural coefficients in the horizontal direction.
The minimum horizontal principal stress is between 8.48 MPa and 26.66 MPa, with an average of 18.13 MPa. On the plane, it shows a distribution pattern of low in the south and high in the north, among which Z-95 is higher and Z-80 is lower. The distribution of three-dimensional principal stress is similar to that of coal seam burial depth. The correlation between CBM production and minimum horizontal principal stress in the study area is poor, indicating that gas production is greatly affected by other factors (Figure 10).

4.3. Favorable Fracturing Factors

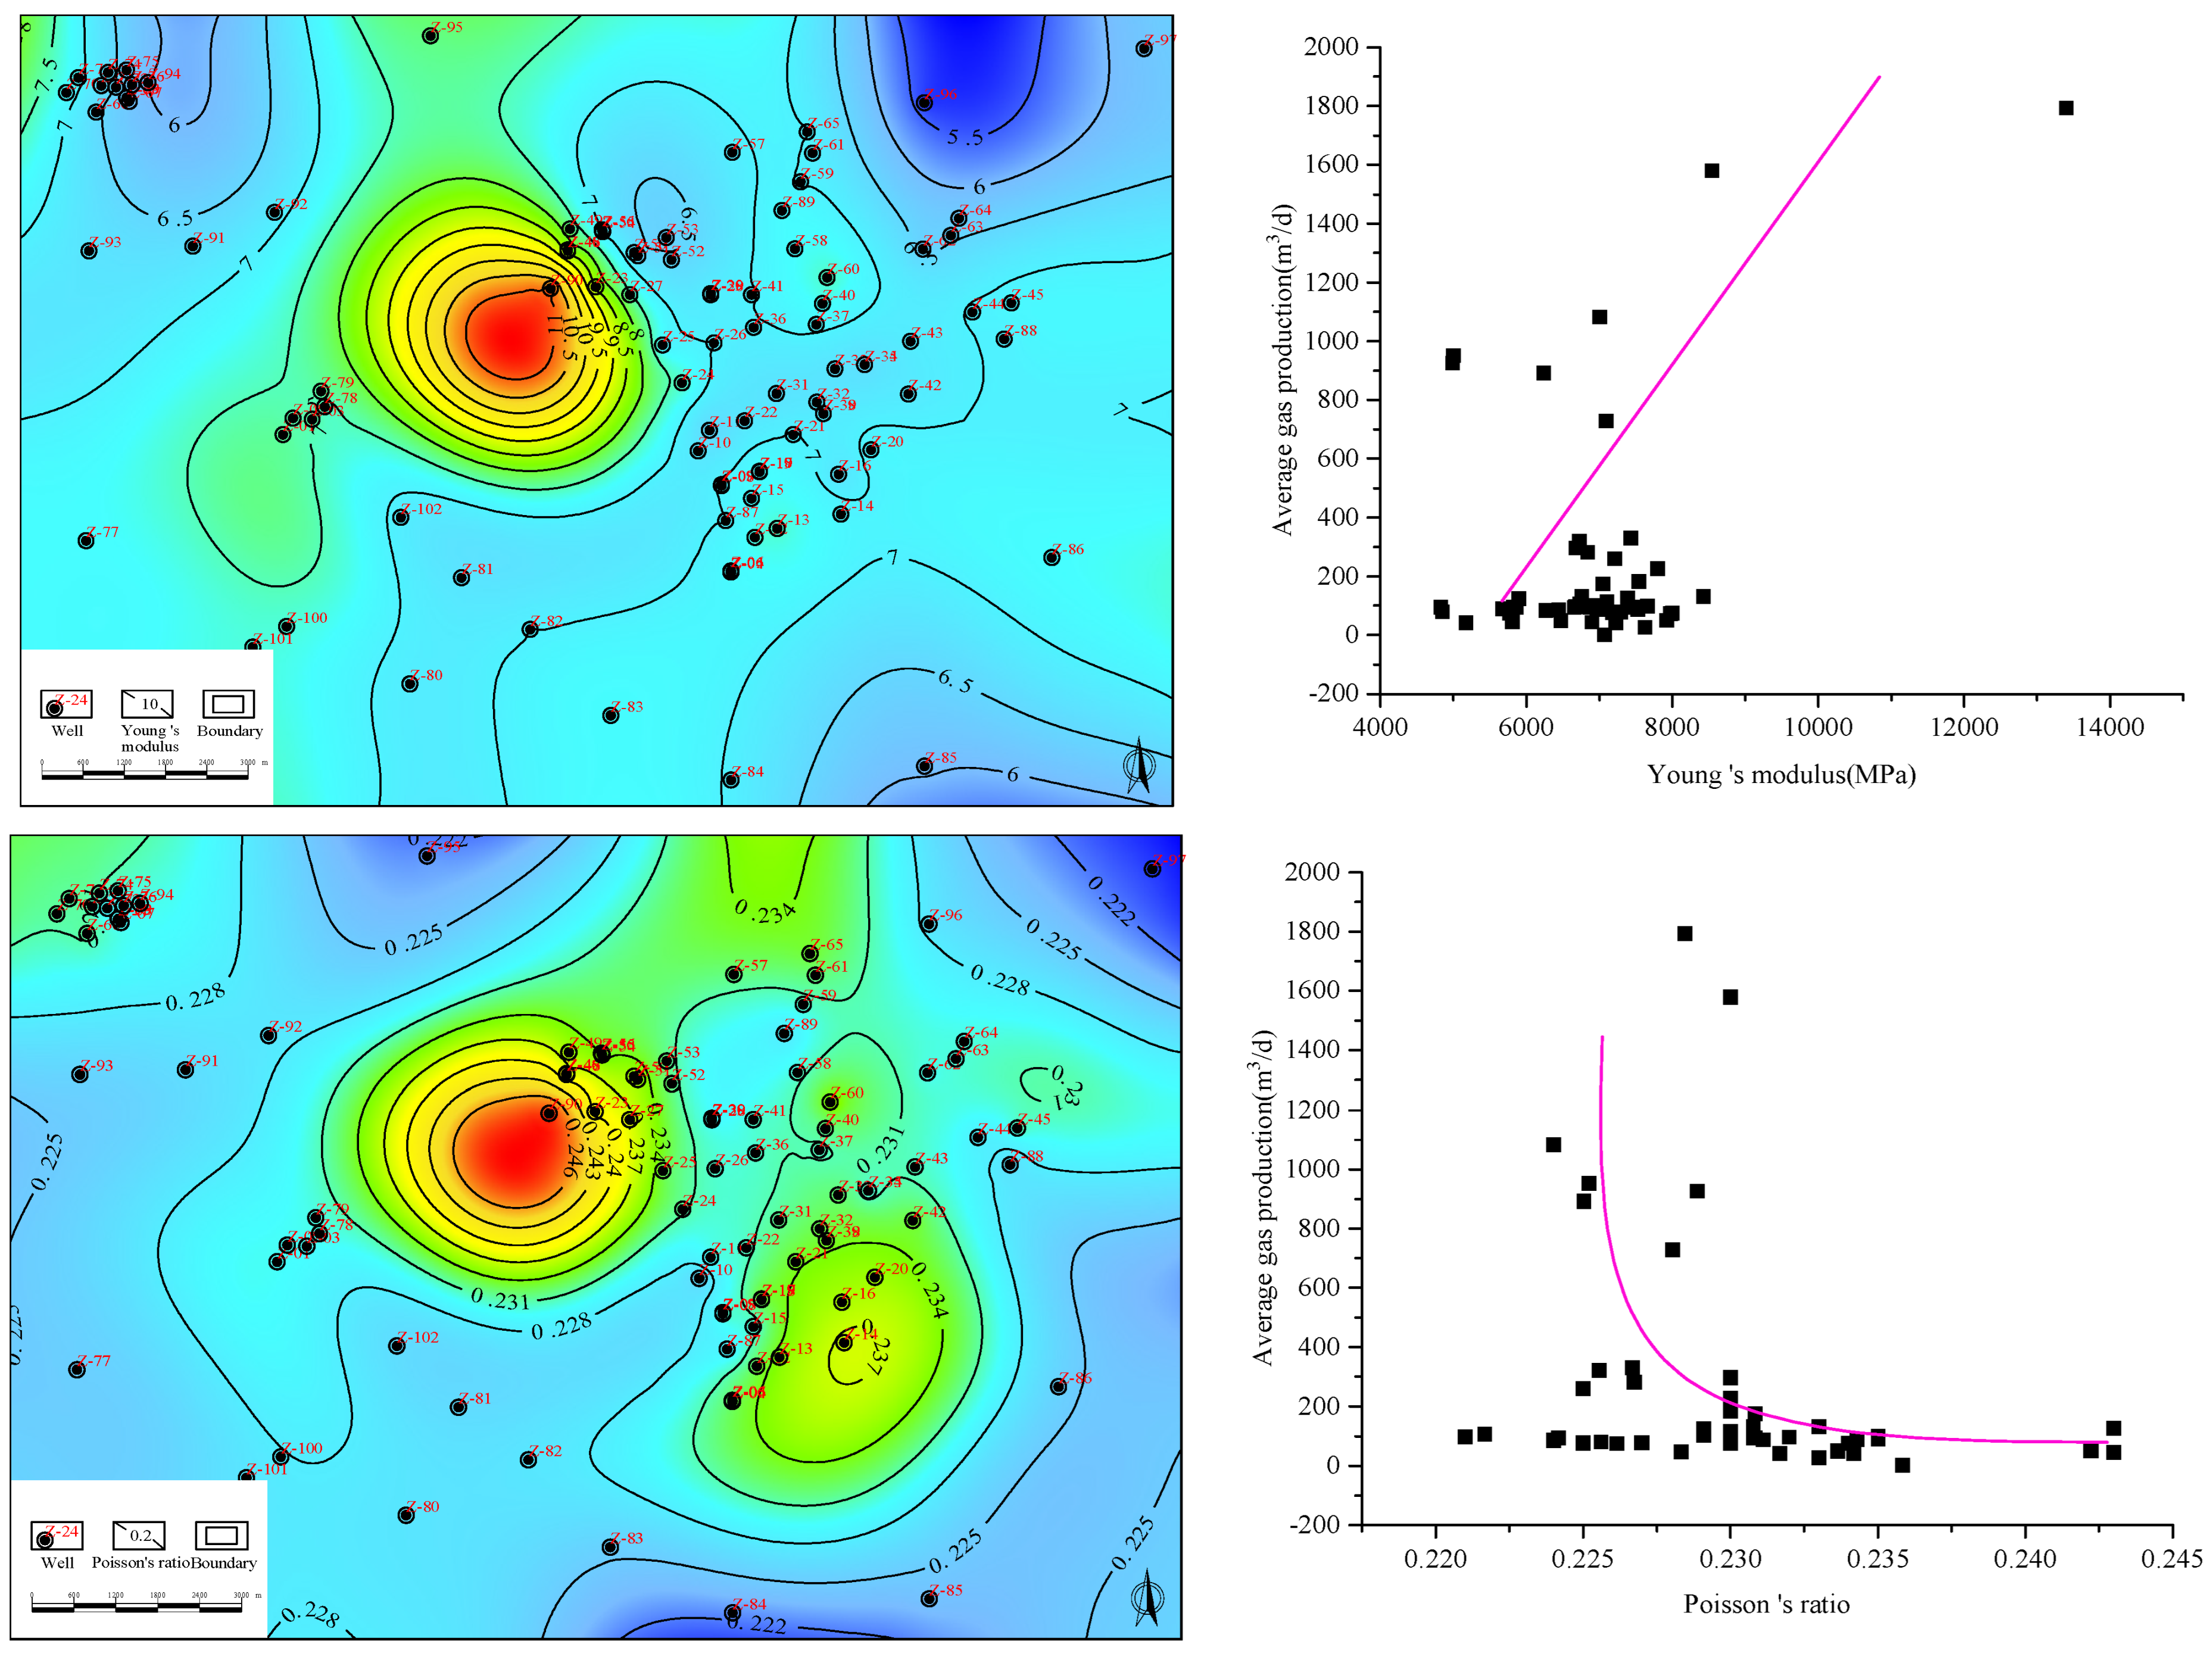
4.3.1. Young’s Modulus and Poisson’s Ratio

The Young’s modulus (E) (Equation (6)) and Poisson’s ratio (μ) (Equation (7)) of coal rock can be obtained according to the elastic wave theory of rock, combined with density logging and array acoustic logging data. The Young’s modulus is in the range of 4825~13,397.5 MPa, with an average of 6921.4 MPa, and the Poisson’s ratio is in the range of 0.221~0.243, with an average of 0.23. The Young’s modulus is positively correlated with the average gas production, and the Poisson’s ratio is negatively correlated with the average gas production. The higher the Young’s modulus and the lower the Poisson’s ratio, the greater the brittleness of the rock, and the easier it is to form complex fractures during the fracturing process [27]. However, the high-value areas of Young’s modulus and Poisson’s ratio in the study area are in the middle of the block, which is different from the traditional understanding (Figure 11). Therefore, the gas production may be less affected by these two factors.
μ = 1 2 Δ t s 2 2 Δ t s 2 Δ t s 2 Δ t p 2
E = ρ Δ t s 2 9.29 10 4 3 Δ t s 2 4 Δ t s 2 Δ t s 2 Δ t p 2
μ is the Poisson’s ratio of rock (dimensionless), ρ is rock density (g/cm3), Δts is the time difference of longitudinal wave (μs/m), Δtp is the P-wave time difference of the stratigraphic framework (μs/m), and E is Young’s modulus (Gpa).

4.3.2. Schlumberger Ratio

The Schlumberger ratio is often used to characterize whether sand is produced during conventional reservoir mining. Here, the Schlumberger ratio is applied to coal seams to characterize the amount of pulverized coal produced in coal reservoirs [28]. The smaller the Schlumberger ratio, the more pulverized coal is produced. According to the array acoustic logging data, the mechanical characteristic parameters of the coal reservoir are extracted and the Schlumberger ratio is calculated (Equation (8)). The Schlumberger ratio is in the range of 0.06~0.51, with an average of 0.14. The high-value area of the study area is mainly located in the middle of the block, and the eastern region is the lowest-value (Figure 12). The average gas production is positively correlated with the Schlumberger ratio, and 200 m3/d drainage wells. The overall Schlumberger is relatively small and relatively concentrated.
S = 1 2 μ 1 + μ ρ 2 6 1 μ Δ t s ( 9.94 10 8 ) 2
μ is the Poisson’s ratio of rock (dimensionless), ρ is rock density (g/cm3), and Δts is the time difference of longitudinal wave (μs/m).

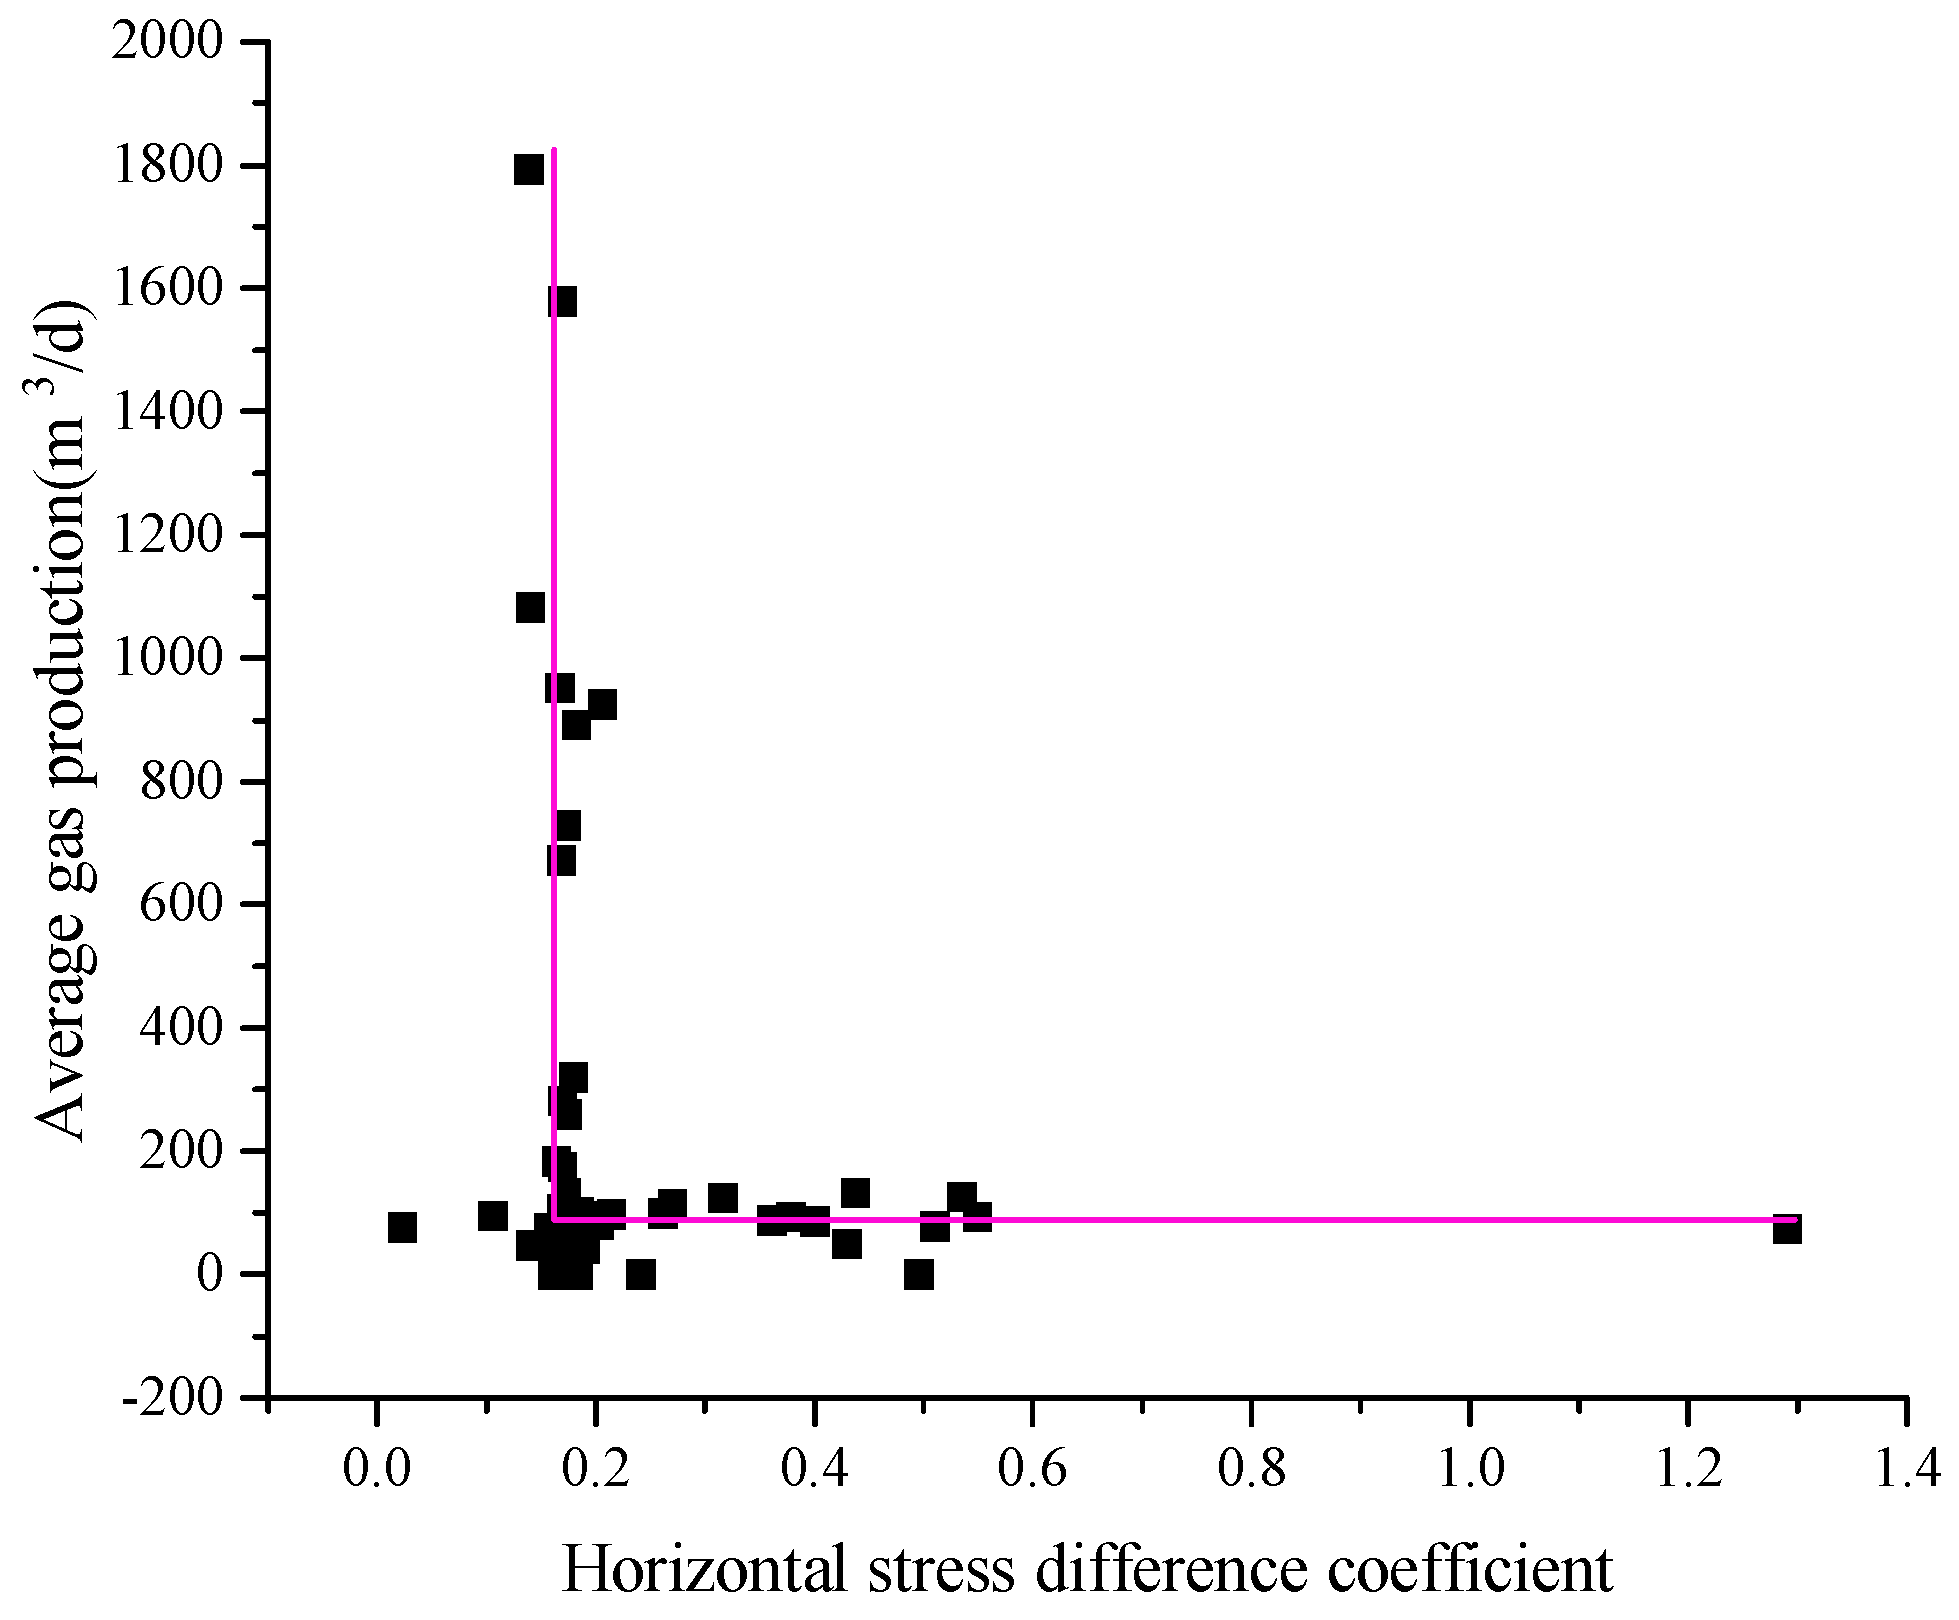
4.3.3. Horizontal Stress Difference Coefficient

In addition to overcoming the tensile strength of rock, the initiation and extension of fracturing cracks must also overcome the constraints of in situ stress in the stratum. The difference in in situ stress will have a greater impact on the formation of cracks. The smaller the horizontal principal stress difference is, the more favorable it is to form network fractures, and the more easily the reservoir is fractured, the better the rework ability is [29]. The horizontal stress difference coefficient refers to the ratio of the two-phase horizontal principal stress difference to the minimum horizontal principal stress. The horizontal stress difference coefficient of the Zhengbei block is between 0.01 and 1.31, with an average of 0.18. The gas production of coal seam in the study area is negatively correlated with the horizontal stress difference coefficient (Figure 13).

4.4. Control Factors of CBM Well Productivity Engineering

The gas production of vertical wells in the Zhengbei block is generally lower than 1000 m3/d. According to the previous productivity classification of the block, it is divided into three levels. The daily production of high-yield wells is ≥2000 m3/d, the daily production of medium-yield wells is 2000 > stable production ≥ 1000 m3/d, and the daily production of low-yield wells is <1000 m3/d (Figure 14). Overall, there are many low-yield wells. By analyzing the drainage performance of several low-yield wells in the block, it is found that the drainage time of CBM wells in the Zhengbei block is the longest, the peak gas production is low, and the gas production after stable production is low. In the process of drainage, there are many times of pump-stopping disturbance. The casing pressure control is unstable, and the pressure reduction speed in the single-phase flow stage is too fast, which is not conducive to the expansion of pressure drop. It is easy to cause coal seam excitation, sand production, and pulverized coal production. The pressure reduction speed of some wells is stable in the early stage, and it is easy to reach the peak value of gas production quickly. However, in the later stage, there is high water production, and the flow pressure increases after the shutdown, resulting in shutdown or low production.
Further combined with the rock mechanics parameters of the roof and floor and the coal seam, it is found that the difference in the compressive strength ratio between the roof and floor of the low-yield well (Z-86/Z-81/Z-96) and the coal seam is small (Figure 15). At the same time, it is found that the compressive strength ratio of the roof and floor to the coal seam is generally lower than 5 (Figure 16). At present, the research area mainly adopts the small- and medium-scale fracturing of vertical wells and the staged fracturing of horizontal wells [30]. The hydraulic fracturing cracks easily extend to the roof and floor of the coal seam, which may communicate with the aquifer and cause the difficulty of drainage and pressure reduction. Therefore, the reason for the high yield of water in some wells is consistent with the previous understanding [31]. Comparing the Young’s modulus of the floor with the coal seam, it is found that the two are relatively close, the crack is not easy to extend along the coal seam, and the crack extension is shorter. In contrast to the high-yield wells, it is found that the compressive strength and Young’s modulus of the roof and floor of the high-yield well (Z-103) are quite different from those of the coal seam, and the cracks are easily controlled in the coal seam. At the same time, the roof and floor limit the expansion of the cracks, and the cracks are easy to extend along the level. The cracks are in the form of a ‘T’, so the yield is higher.

5. Prediction of Favorable Development Unit of CBM

5.1. Optimization Method of Favorable Area Development

Upon conducting a thorough analysis of various factors and clarifying the concept of development unit division, we employed the entropy weight method to assign weights to the controlled factors associated with gas-rich areas, high-permeability zones, and favorable fracturing regions. Finally, the favorable area optimization index is calculated, and then the favorable development area is divided.
The entropy weight method is a statistical method to judge the degree of dispersion of different indicators of the sample. The larger the entropy value, the smaller the degree of dispersion. At the same time, the entropy weight method can also calculate the weight of each index in the overall index, which is of great significance to the comprehensive evaluation. The specific steps are as follows:
(1)
Sample data normalization
The sample data are normalized so that all the indexes in the sample are under the same dimension, to eliminate the analysis error caused by the large difference between the indexes.
(2)
Normalized data volume translation
In the entropy weight method, when xmn = 0, the entropy value is meaningless. Based on this, this paper shifts all normalized data to the right by 0.0001 units, where m is the number of samples and n is the number of indicators.
(3)
Entropy weight calculation
After the data preprocessing is completed, the entropy value and the weight of each index in the coalbed methane in the study area can be calculated (Equations (9) and (10)). The entropy calculation formula is:
Q b = 1 ln m i = 1 m f a b ln f a b ( a = 1 , 2 , , m ; b = 1 , 2 , , n )
f a b = r b ( x a ) / i = 1 m r b ( x a )
Qb is the information entropy of each index. The weight of each index is calculated according to the entropy value (Equation (11)),
ε b = 1 Q b n Q b ( b = 1 , 2 , , n )
εb is the weight of each index.
The control factors affecting the gas production of CBM according to the comparison results of correlation degree in the study area from strong to weak are critical desorption pressure, permeability, Schlumberger ratio, fault fractal dimension, Young’s modulus, horizontal stress difference coefficient, minimum horizontal principal stress, gas content, Poisson’s ratio, fracture index, and coal seam thickness (Table 1). In the development of CBM, factors such as critical desorption pressure, coal seam permeability, Schlumberger ratio, and fault fractal dimension can be given priority to achieve efficient development.

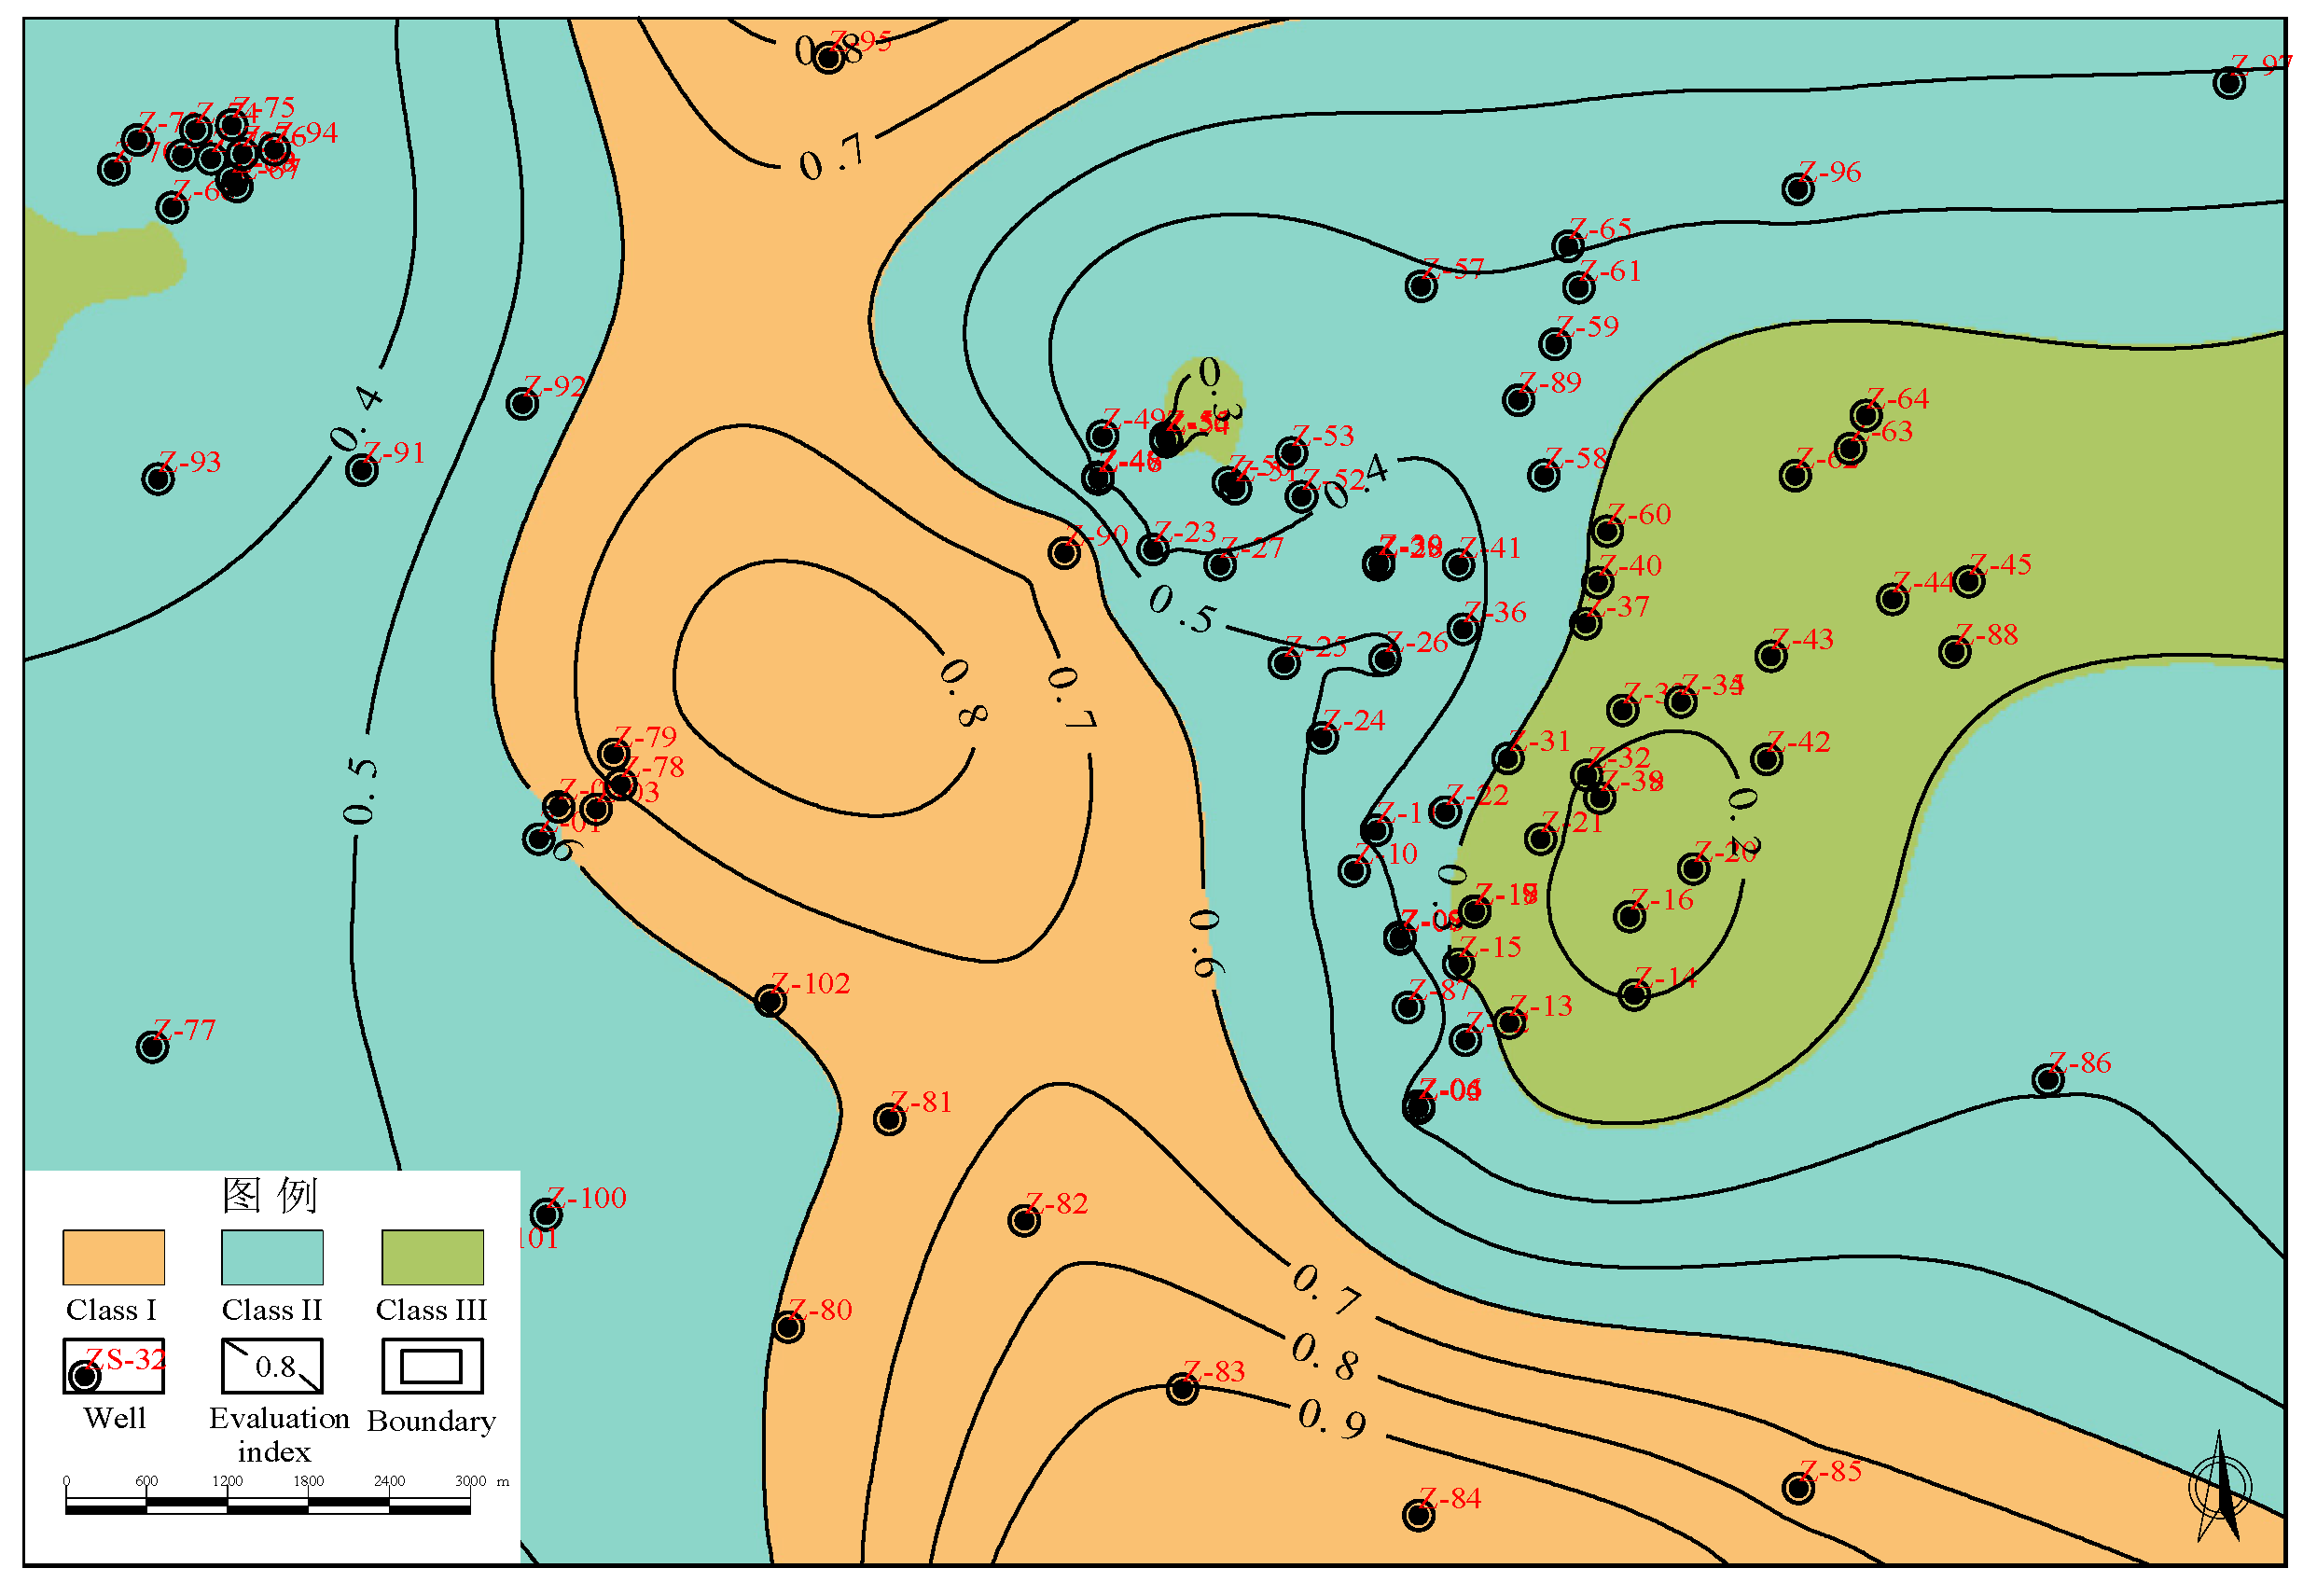
5.2. Development Unit Division

The above calculation method is used to divide the development units in the study area based on the comprehensive analysis of the parameters of the productivity control factors of CBM wells. The results show that the comprehensive evaluation index of the study area is between 0 and 1, with an average of 0.64. The type I development unit in the plane Zhengbei block is stripped and interspersed with the north and south of the block. The III development unit is mainly located in the east of the block and near the Z-56 well (Figure 17). It is found that the evaluation index is positively correlated with the average gas production, indicating that the prediction results are accurate (Figure 18).

6. Conclusions

(1)
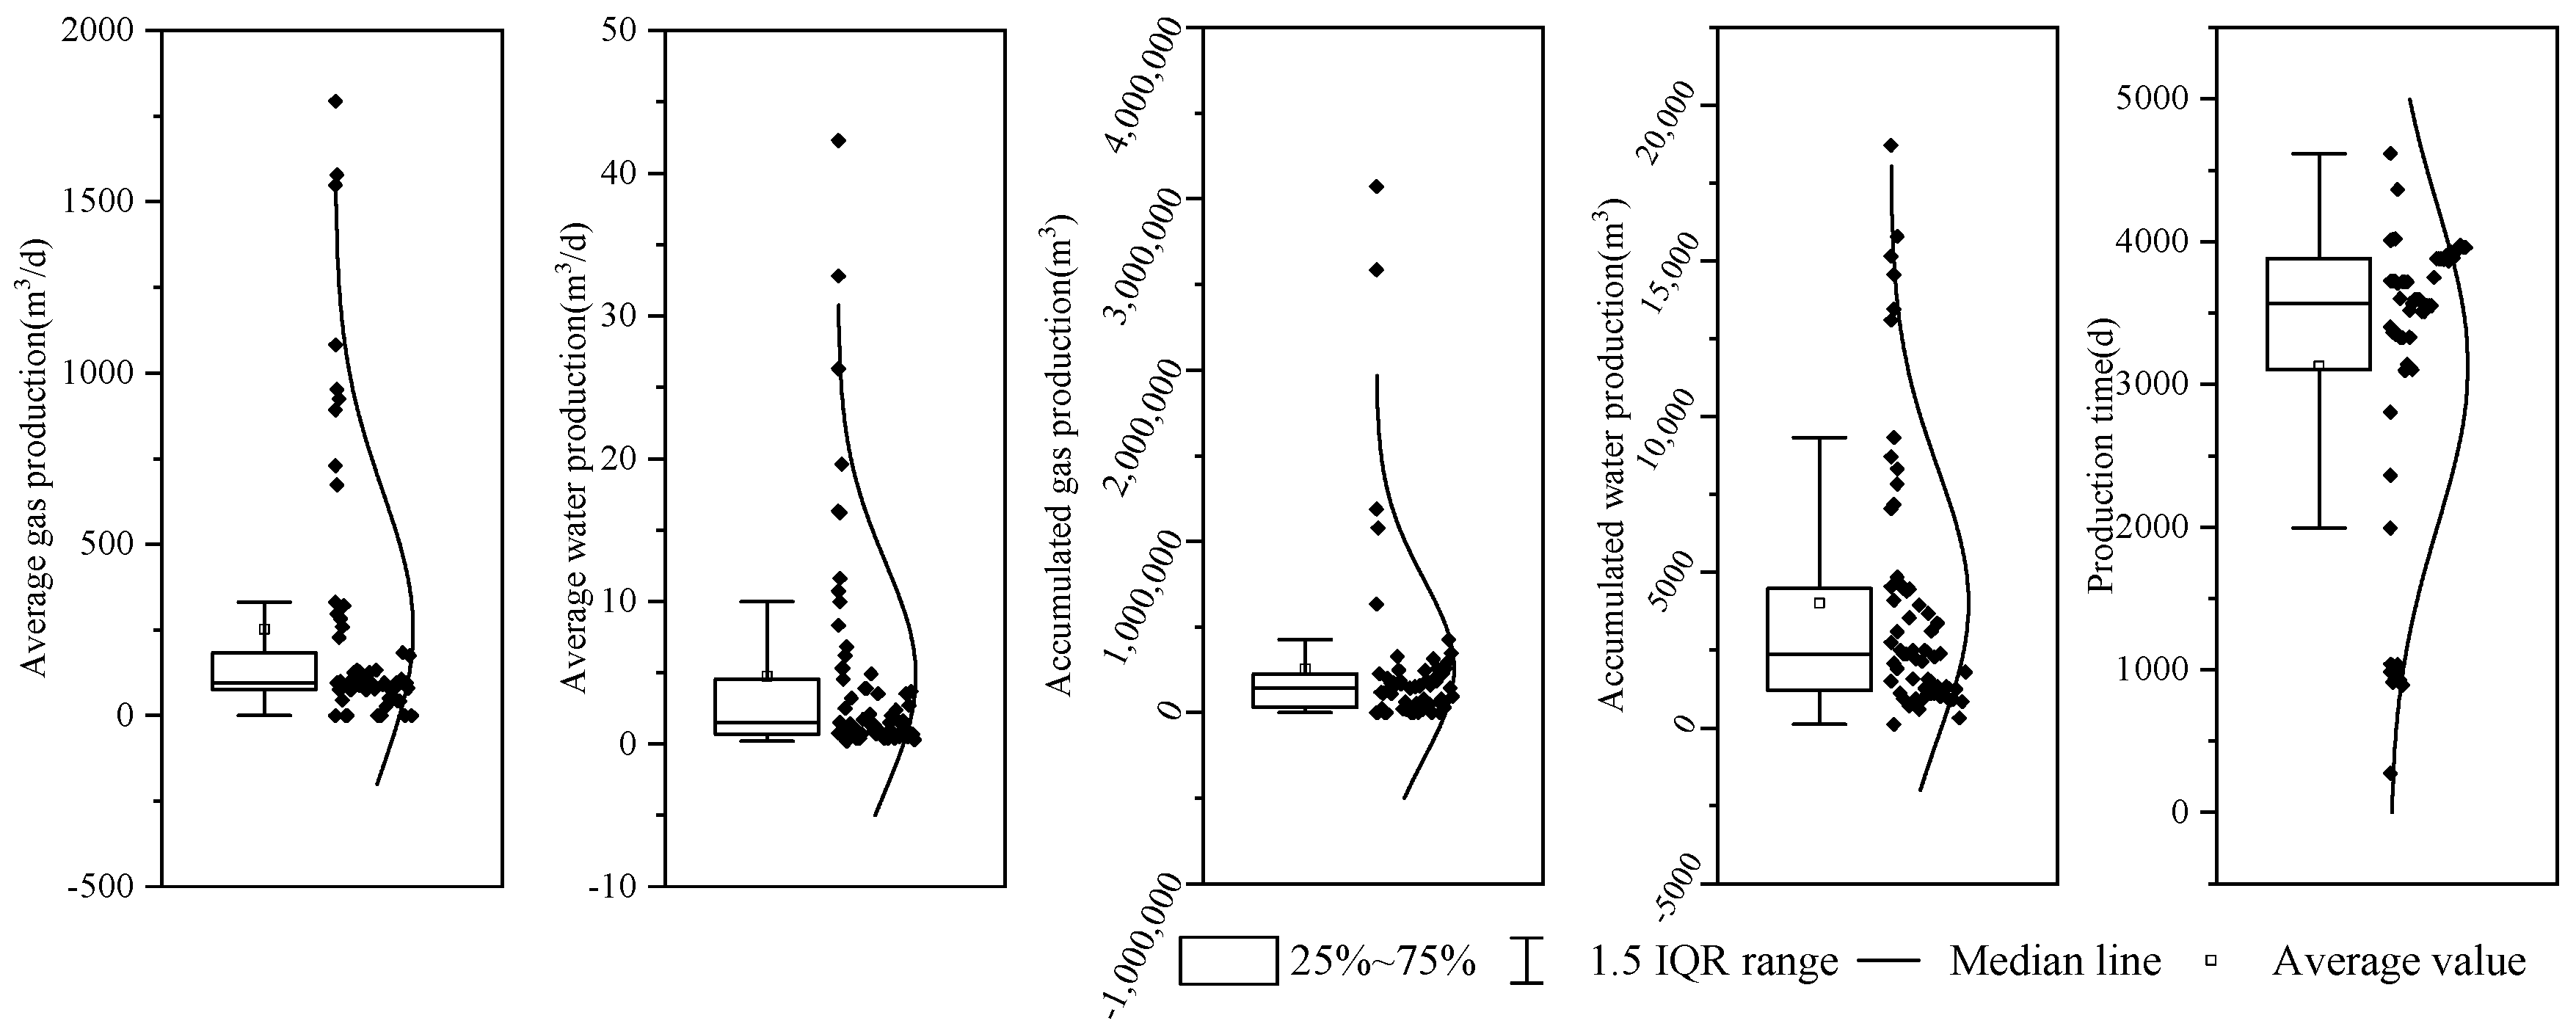
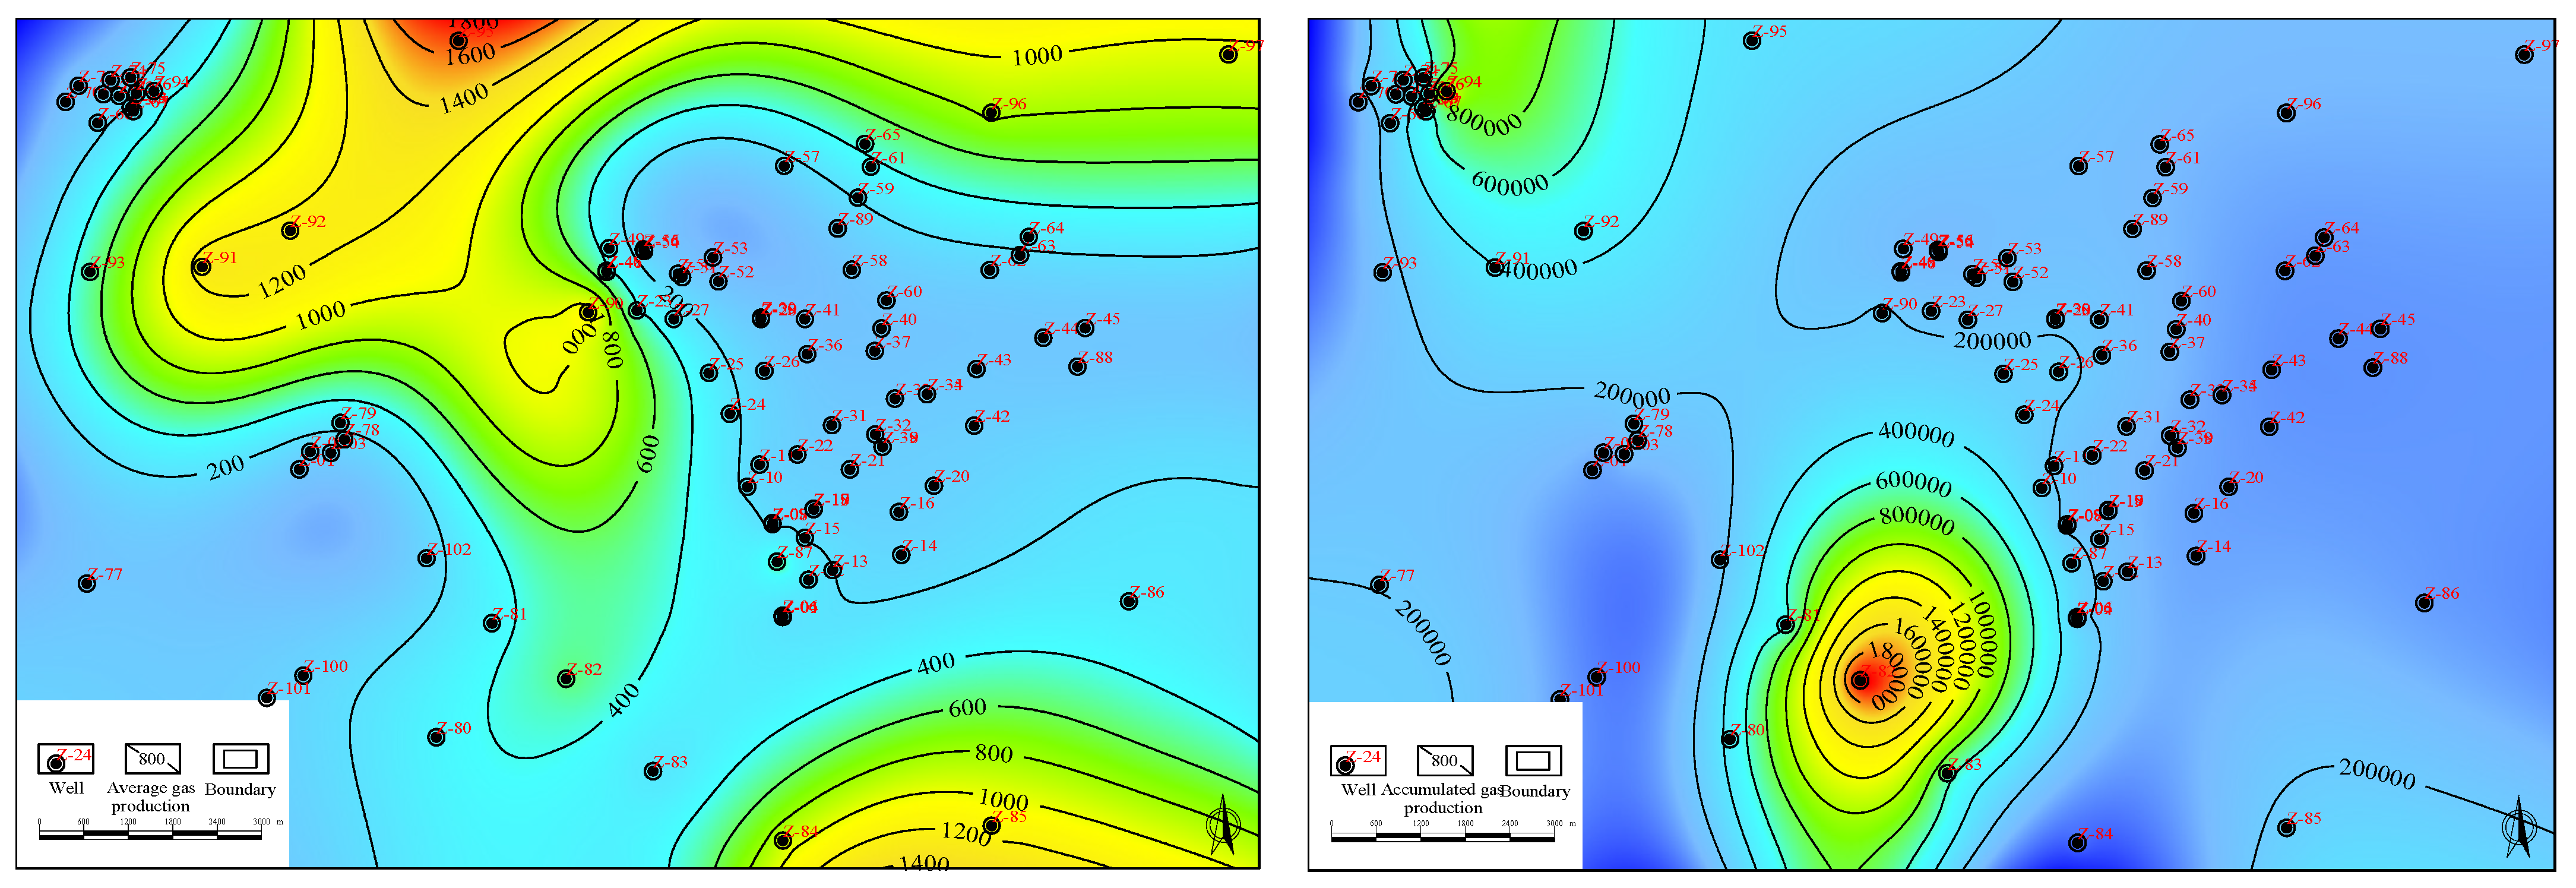
The characteristics of CBM production in the Zhengbei block have been identified. The average gas production of CBM wells in the study area is between 0 and 1793 m3/d, with an average of 250.97 m3/d. Of the wells, 80% are lower than 500 m3/d, and there are fewer wells above 1000 m3/d. The highest points of average gas production and cumulative gas production are mainly concentrated in the northern, central, and southeastern parts of the block.
(2)
The average gas production is positively correlated with gas content, critical desorption pressure, permeability, Young’s modulus, and Schlumberger ratio, and negatively correlated with fracture index, fault fractal dimension, Poisson’s ratio, and horizontal stress difference coefficient. The correlation with coal thickness and minimum horizontal principal stress is poor.
(3)
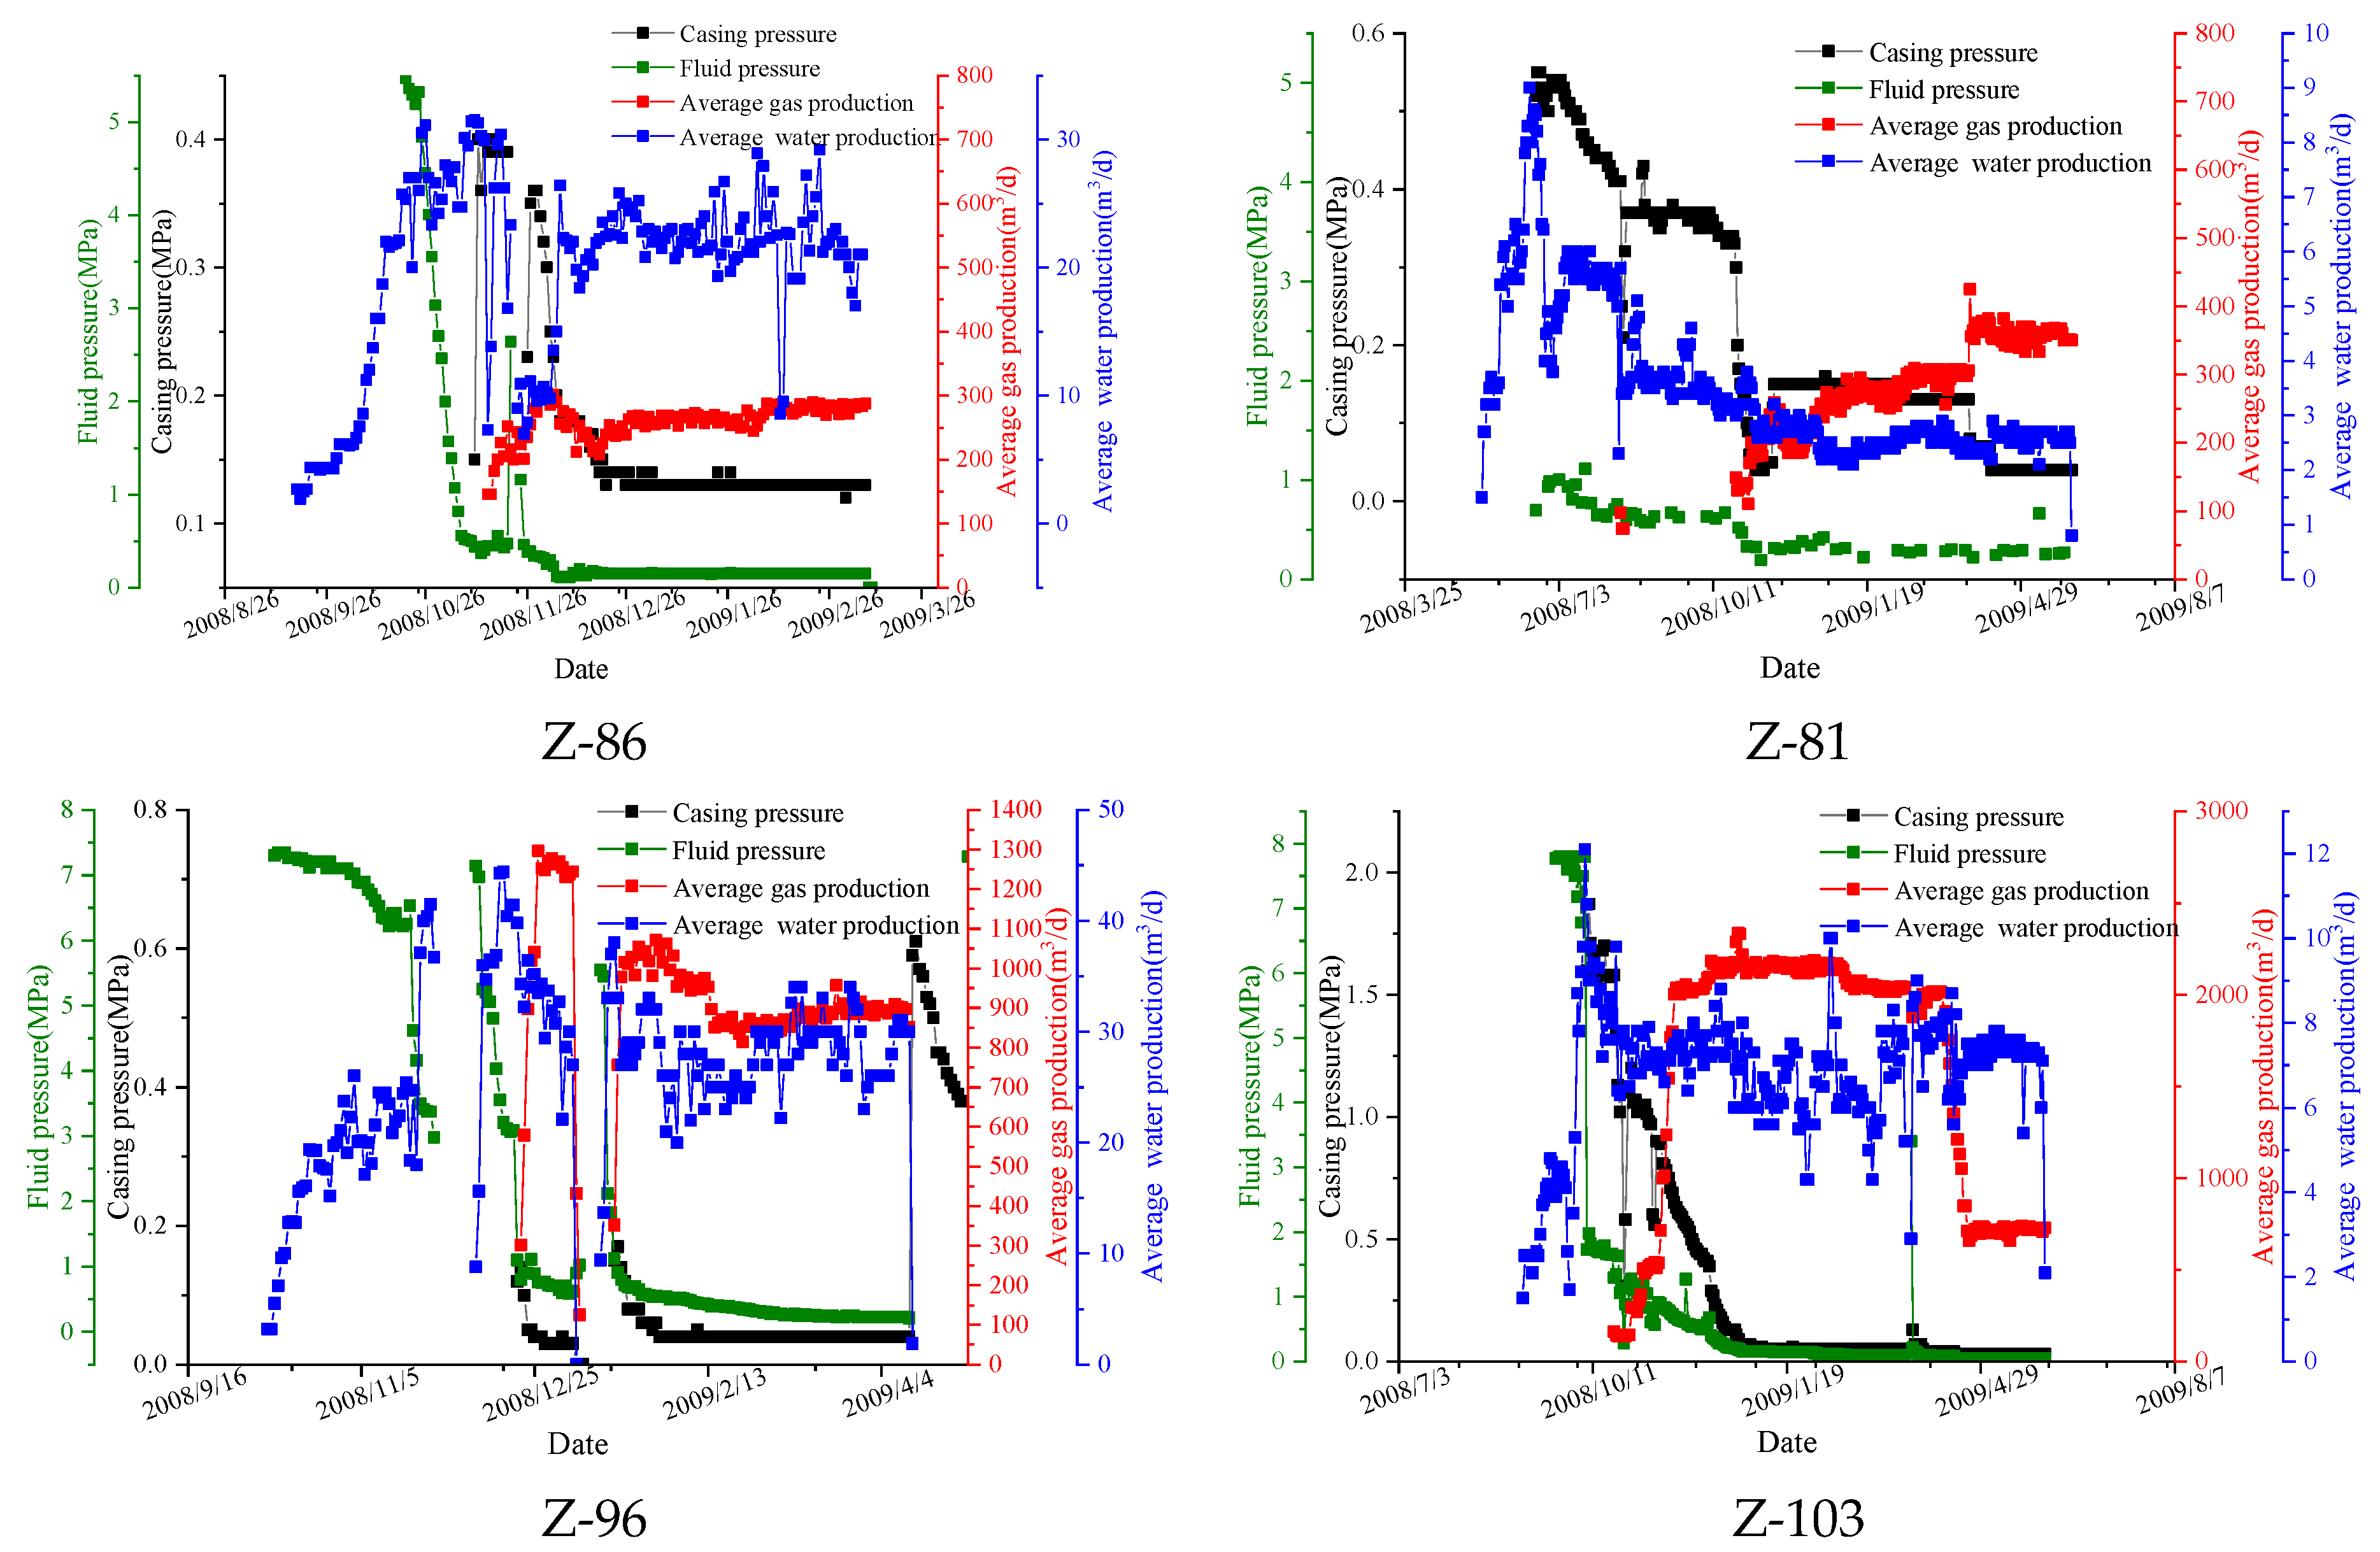
The low-yield wells in the study area have the characteristics of multiple pump-stopping disturbances, unstable casing pressure control, and overly rapid depressurization in the single-phase flow stage. CBM wells have higher sand, pulverized coal, and water production. Compared with the roof and floor rock mechanics experiments, it is found that this may be caused by the small difference in compressive strength between the roof and floor and the small difference in Young’s modulus of the floor. The difference between the two high-yield wells is large, and the fracturing cracks are easy to control in the coal seam and extend along the layer.
(4)
The production control factors from strong to weak are as follows: critical desorption pressure, permeability, Schlumberger ratio, fault fractal dimension, Young’s modulus, horizontal stress difference coefficient, minimum horizontal principal stress, gas content, Poisson’s ratio, fracture index, coal seam thickness. On the plane, the type I development unit of the Zhengbei block is stripped and interspersed with the north and south of the block, and the type III development unit is mainly located in the east of the block and near the well Z-56. The comprehensive index is positively correlated with gas production, and the prediction results are accurate.

Author Contributions

Methodology, C.Z., H.J., G.S., K.L. and Q.W.; investigation, Q.H., C.L. and K.L.; data curation, D.W.; writing—original draft, C.Z., C.L. and H.J.; writing—review and editing, Q.H. and Q.W. All authors have read and agreed to the published version of the manuscript.

Funding

This research received no external funding.

Data Availability Statement

The original contributions presented in the study are included in the article, further inquiries can be directed to the corresponding author.

Conflicts of Interest

Authors Cong Zhang, Qiujia Hu, Chunchun Liu, Huimin Jia, Guangjie Sang, Dingquan Wu and Kexin Li were employed by the CBM Branch Company, Huabei Oilfield of PetroChina. The remaining authors declare that the research was conducted in the absence of any commercial or financial relationships that could be construed as a potential conflict of interest. The CBM Branch Company, Huabei Oilfield of PetroChina had no role in the design of the study; in the collection, analyses, or interpretation of data; in the writing of the manuscript, or in the decision to publish the results.

References

  1. Wang, Y.; Bao, Y.; Hu, Y. Recent progress in improving the yield of microbially enhanced CBM production. Energy Rep. 2023, 9, 2810–2819. [Google Scholar] [CrossRef]
  2. Du, S.; Wang, M.; Yang, J.; Zhao, Y.; Wang, J.; Yue, M.; Xie, C.; Song, H. An enhanced prediction framework for CBM production incorporating deep learning and transfer learning. Energy 2023, 282, 128877. [Google Scholar] [CrossRef]
  3. Wang, G.; Qin, Y.; Xie, Y. Geochemical Characteristics of Coal in the Taiyuan Formation in the Center and North of the Xishan Coalfield. Energies 2022, 15, 8025. [Google Scholar] [CrossRef]
  4. Li, H.; Lau, H.; Huang, S. China’s CBM development: A review of the challenges and opportunities in subsurface and surface engineering. J. Pet. Sci. Eng. 2018, 166, 621–635. [Google Scholar] [CrossRef]
  5. Zhang, C.; Li, M.; Feng, S.; Hu, Q.; Qiao, M.; Wu, D.; Yu, J.; Li, K. Reservoir properties and gas production difference between No.15 coal and No.3 coal in Zhengzhuang Block, southern Qinshui Basin. Coal Geol. Explor. 2022, 50, 145–153. [Google Scholar]
  6. Zhu, Q.; Li, Z.; Li, Z.; Wang, S.; Sun, R.; Wang, Y.; Xiao, Y.; Wang, J.; Wang, J.; Guan, X. Practice and cognition of efficient CBM development under complex geological Practice and cognition of efficient CBM development under complex geological. Coal Geol. Explor. 2023, 51, 131–138. [Google Scholar]
  7. Jia, H.; Hu, Q.; Fan, B.; Mao, C.; Zhang, Q. Causes for low CBM production of vertical wells and efficient development tech-nology in northern Zhengzhuang Block in Qinshui Basin. Coal Geol. Explor. 2021, 49, 34–42. [Google Scholar]
  8. Wang, M.; Zhu, Y.; Li, W.; Zhong, H.; Wang, Y. Tectonic evolution and reservoir formation of CBM in Zhengzhuang block of Qinshui basin. J. China Univ. Min. Technol. 2012, 41, 425–431. [Google Scholar]
  9. Chen, L.; Hou, Y.; Yao, Y.; Yang, Y.; Zhong, L.; Xie, N. Study on heterogeneity of coal reservoir in Zhengzhuang Block of south Qinshui Basin. Coal Sci. Technol. 2016, 44, 147–153. [Google Scholar]
  10. Zhang, J.; Feng, Q.; Zhang, X.; Hu, Q.; Wen, S.; Chen, D.; Zhai, Y.; Yan, X. Multi-fractured horizontal well for improved coalbed methane production in eastern Ordos basin, China: Field observations and numerical simulations. J. Pet. Sci. Eng. 2020, 194, 107488. [Google Scholar] [CrossRef]
  11. Han, S.; Sang, S.; Duan, P.; Xu, A.; Zhang, J.; Xiang, W. Modified assessment method of CO2 geologic storage capacity in deep coal and its application in the Zhengzhuang Block, Qinshui Basin. J. China Univ. Min. Technol. 2023, 52, 772–788. [Google Scholar]
  12. Lu, X.; Zhang, Y.; Zhou, Q.; Wang, X.; Lu, X.; Han, Y. Characteristics of In-situ Stress Field in Zhengzhuang Block and Its influence on CBM Development. China CBM 2019, 16, 14–18. [Google Scholar]
  13. Yao, Y.; Wang, H.; Yang, Y.; Liu, D.; Lu, X.; Cao, L. Evaluation of the hydro-fracturing potential for CBM reservoir: A case study of Zhengzhuang CBM field. Coal Geol. Explor. 2021, 49, 119–129. [Google Scholar]
  14. Qiu, F.; Liu, J.; Cai, Y.; Liu, D.; Sun, F. Mechanical property evaluation of coal bed and favorable area prediction of coalbedmethane (CBM) development based on well logging: A case study of No. 3 coal bed in Zhengzhuang Block, southern Qinshui Basin. Coal Geol. Explor. 2023, 51, 46–56. [Google Scholar]
  15. Xie, N.; Yao, Y.; Yang, Y.; Chen, Y. Fracturing effect factors analysis of CBM appraisal wells in Zhengzhuang Block. Coal Sci. Technol. 2016, 44 (Suppl. S1), 180–185. [Google Scholar]
  16. Li, C.; Yang, Z.; Chen, J.; Sun, H. Prediction of Critical Desorption Pressure of Coalbed Methane in Multi-coal Seams Reservoir of Medium and High Coal Rank: A Case Study of Eastern Yunnan and Western Guizhou, China. Nat. Resour. Res. 2022, 31, 1443–1461. [Google Scholar] [CrossRef]
  17. Li, Q.; Shen, J.; Hu, H.; Ji, X. Research on the Control of CBM Well Reservoir Geological Engineering Characteristics on Productivity. Geol. J. China Univ. 2023, 29, 644–656. [Google Scholar]
  18. Liu, J.; Zhu, G.; Liu, Y.; Chao, W.; Du, J.; Yang, Q.; Mi, H.; Zhang, S. Breakthrough, future challenges and countermeasures of deep CBM in the eastern margin of Ordos Basin:a case study of Linxing-Shenfu block. Acta Pet. Sin. 2023, 44, 1827–1839. [Google Scholar]
  19. Zhang, S.; Peng, X. Calculation method of critical desorption pressure in undersaturated CBM reservoirs. Pet. Reserv. Eval. Dev. 2022, 12, 589–595. [Google Scholar]
  20. Tang, D.; Zhao, J.; Xu, H.; Li, Z.; Tao, S.; Li, S. Material and energy dynamic balance mechanism in middle-high rank CBM systems. J. China Coal Soc. 2016, 41, 40–48. [Google Scholar]
  21. Wang, H.; Wang, Q.; Huang, L.; Wang, C.; Cui, W. Intelligent decision-making system for integrated geological and engineering of deep coalbed methane development. Energy Fuels 2023, 37, 13976–13984. [Google Scholar] [CrossRef]
  22. Shen, J.; Qin, Y.; Li, Y.; Yang, Y.; Ju, W.; Yang, C.; Wang, G. In situ stress field in the FZ Block of Qinshui Basin, China: Implications for the permeability and coalbed methane production. J. Pet. Sci. Eng. 2018, 170, 744–754. [Google Scholar] [CrossRef]
  23. Pan, J.; He, H.; Li, G.; Wang, X.; Hou, Q.; Liu, L.; Cheng, N. Anisotropic strain of anthracite induced by different phase CO2 injection and its effect on permeability. Energy 2023, 284, 128619. [Google Scholar] [CrossRef]
  24. Meng, F.; Wong, L.; Zhou, H. Rock brittleness indices and their applications to different fields of rock engineering: A review. J. Rock Mech. Geotech. Eng. 2021, 13, 221–247. [Google Scholar] [CrossRef]
  25. Liao, S.; Hu, J.; Zhang, Y. Investigation on the influence of multiple fracture interference on hydraulic fracture propagation in tight reservoirs. J. Pet. Sci. Eng. 2022, 211, 110160. [Google Scholar] [CrossRef]
  26. Zhang, Q.; Wang, K.; Zhou, S.; Tang, S.; Zhang, S.; Yan, X. Yi Y., Dang F., Zhu W. lnfluence of geological factors on hydraulic fracturing effect of CBM wells in Shizhuangnan Block, Qinshui Basin in Shizhuangnan Block, Qinshui Basin. J. China Coal Soc. 2020, 45, 2636–2645. [Google Scholar]
  27. Su, X.; Wang, Q.; Yu, S.; Zhao, W.; Wang, X.; Bi, C.; Chen, M.; Wang, Y.; Sun, C.; Fu, H.; et al. Integrated development technology path for deep coal measure gas based on low-negative carbon emission reduction. Acta Pet. Sin. 2023, 44, 1931–1948. [Google Scholar]
  28. Ni, X.; Ao, X.; Liang, X.; Ai, L.; Xu, G.; Liu, D. Quantitative ldentification of Coal Structure Based on Schlumberger Ratio and Crack Index. Saf. Coal Mines 2017, 48, 144–146. [Google Scholar]
  29. Song, M.; Liu, Z.; Zhang, X.; Wang, Y.; Li, J.; Yang, F. Fractability evaluation of tight sandstone reservoirs based on improved entropy analytic hierarchy process: Taking the Jurassic reservoirs of Well Z109 in the Junggar Basin as an example. J. Geomech. 2019, 25, 509–517. [Google Scholar]
  30. Zhang, C.; Li, M.; Hu, Q.; Jia, H.; Li, K.; Wang, Q.; Yang, R. Moderately deep coalbed methane reservoirs in the southern Qinshui Basin: Characteristics and technical strategies for exploitation. Coal Geol. Explor. 2024, 52, 122–133. [Google Scholar]
  31. Wang, K.; Tang, S.; Zhang, S.; Yang, N.; Xi, Z.; Zhang, Q.; Wang, J. Discussion on the causes of abnormally high-water production of CBM wells under the control of structural conditions and hydraulic fracturing. J. China Coal Soc. 2021, 46 (Suppl. S2), 849–861. [Google Scholar]
Figure 1. The comprehensive histogram of structural geology and strata in the Zhengbei block. (a) tectonic geological map of Qinshui Basin; (b) structural geological map of northern Zhengzhuang; (c) northern Zhengzhuang stratigraphic histogram.
Processes 12 02018 g001
Figure 2. Box diagram of gas and water production characteristics of No. 3 coal seam CBM wells in the Zhengbei block. The black rombs representative data points and lines indicate that the data obey the normal distribution law.
Processes 12 02018 g002
Figure 3. Average gas production and cumulative gas production distribution of No. 3 coal seam in CBM wells.
Processes 12 02018 g003
Figure 4. Gas content contour map of the No. 3 coal seam and its relationship with gas production. (a) gas content contour map; (b) the relationship between gas content and average gas production.
Processes 12 02018 g004
Figure 5. No. 3 coal seam thickness contour map and its relationship with gas production. (a) isoline of coal seam thickness; (b) the relationship between coal seam thickness and average gas production.
Processes 12 02018 g005
Figure 6. Relationship between critical desorption pressure and average gas production.
Processes 12 02018 g006
Figure 7. Fractal dimension distribution of faults in the Zhengbei block and its relationship with gas production. (a) fractal dimension distribution of faults; (b) the relationship between fractal dimension distribution of faults and average gas production.
Processes 12 02018 g007
Figure 8. The permeability distribution map of the Zhengbei block and its relationship with gas production. (a) the permeability distribution map; (b) the relationship between permeability and average gas production.
Processes 12 02018 g008
Figure 9. Distribution of fracture index in the Zhengbei block and its relationship with gas production. (a) distribution of fracture index; (b) the relationship between fracture index and average gas production.
Processes 12 02018 g009
Figure 10. The distribution of minimum horizontal principal stress and its relationship with gas production in the Zhengbei block. (a) distribution of horizontal principal stress; (b) the relationship between horizontal principal stress and average gas production.
Processes 12 02018 g010
Figure 11. Relationship between Young’s modulus, Poisson’s ratio, and average gas production.
Processes 12 02018 g011
Figure 12. Relationship between Schlumberger ratio and average gas production.
Processes 12 02018 g012
Figure 13. Relationship between horizontal stress difference coefficient and average gas production.
Processes 12 02018 g013
Figure 14. Drainage curve of low-yield wells and high-yield wells (Z-103 is high-yield well, Z-96 is a medium-yield well, and Z-86 and Z-81 are low-yield wells).
Processes 12 02018 g014
Figure 15. Ratio of compressive strength of the coal seam roof and floor to coal seam.
Processes 12 02018 g015
Figure 16. Relationship between rock mechanics parameter test and microseismic fracture monitoring. The red and blue lines correspond to the trend line of the red and blue data points.
Processes 12 02018 g016
Figure 17. No. 3 coal seam development unit division diagram.
Processes 12 02018 g017
Figure 18. Relationship between development unit evaluation index and yield.
Processes 12 02018 g018
Table 1. Weight calculation results.
ItemInformation Entropy ValueInformation Utility ValueWeight (%)ItemInformation Entropy ValueInformation Utility ValueWeight (%)
Permeability0.9320.06815Critical desorption pressure0.9220.07817.247
Young’s modulus0.9560.0449.754Fracture index0.9920.0081.854
Schlumberger ratio0.9360.06414.25Poisson ratio0.9780.0224.866
Coal seam thickness0.9930.0071.542Diversity factor0.9620.0388.486
Minimum principal stress0.9660.0347.535Fault fractal dimension0.940.0613.215
Gas content0.9720.0286.251
Disclaimer/Publisher’s Note: The statements, opinions and data contained in all publications are solely those of the individual author(s) and contributor(s) and not of MDPI and/or the editor(s). MDPI and/or the editor(s) disclaim responsibility for any injury to people or property resulting from any ideas, methods, instructions or products referred to in the content.

