Article

Corrosion Behavior of Pre-Rusted Rebars in Cement Mortar Exposed to Harsh Environments

1
School of Civil, Environmental and Architectural Engineering, Korea University, Seoul 02841, Korea
2
School of Civil and Environmental Engineering, Kookmin University, Seoul 02707, Korea
*
Authors to whom correspondence should be addressed.
Appl. Sci. 2020, 10(23), 8705; https://doi.org/10.3390/app10238705
Submission received: 30 October 2020 / Revised: 21 November 2020 / Accepted: 30 November 2020 / Published: 4 December 2020
(This article belongs to the Section Civil Engineering)

Abstract

:
Rebar embedded inside reinforced concrete structures becomes corroded due to various factors. However, few studies have focused on the corrosion of pre-rusted rebar embedded in cement composites, and the findings reported thus far are inconsistent. Therefore, in this study, an experimental program was undertaken to examine the effect of pre-rusting on the further corrosion of reinforcements in cement composites. Pre-rust was induced using two different solutions (CaCl2 and HCl). The corrosion rate in the cement composite was analyzed using the half-cell potential and polarization resistance methods. In addition, scanning electron microscopy with energy-dispersive X-ray analysis and X-ray diffraction analysis were used to examine the morphology of the rust. The results show that the corrosion rate of the rebar embedded in the cement composite can be increased by more than 3.8 times depending on the pre-rust conditions (RE: 0.0009 mm/year, HCl: 0.0035 mm/year). In addition, we found that the corrosion products in the pre-rusted layer were comparable to those of the rebar corroded in the marine atmosphere.

1. Introduction

The corrosion of rebar embedded inside reinforced concrete structures is affected by various factors, such as the water–cement (W/C) ratio during the concrete mixing process, use of admixtures, design deficiencies, environmental conditions, and chloride penetration through external concrete cracks [1,2]. The corrosion of rebar embedded in concrete involves an initiation phase and a propagation phase, and the aforementioned conditions can affect the rate of the corrosion [3]. Rebar embedded in reinforced concrete composites, in general, does not undergo corrosion due to the formation of a passive layer in a high-alkali environment. However, there are still issues such as the increased cost of repairing structures damaged by chloride or carbonation [4]. Researchers have predicted the amount of corrosion of stainless steel (SS) [5,6] and carbon steel [7,8], and have measured the level of corrosion in various environments [9,10].
In the field of civil engineering and construction, many studies have been conducted to analyze the effect of corroded rebar on the mechanical performance of reinforced concrete. Studies have investigated the effects of corrosion in seawater or a chloride solution environment [11,12] on the bond strength [13,14,15,16] and structural behavior [17,18,19] of reinforced concrete, as well as the effects of concrete mixed with rust inhibitors on corrosion [20,21,22,23]. However, studies have rarely focused on the corrosion of pre-rusted rebar embedded in cement composites [24], and the findings reported thus far are inconsistent [20,21]. Therefore, in this study, the effect of pre-rusting by two different chloride-ion-containing solutions on the corrosion of rebar in cement mortar was examined by electrochemical measurement and microscope image analysis. In this study, the effect of a pre-rusted rebar on corrosion in a cement composite was investigated using two pre-rusting agents: CaCl2, a common deicing agent [25], and an HCl solution based on a previous study [16].

2. Experimental Materials and Methods

2.1. Materials

In this study, SD400 D10 rebar manufactured by a local manufacturer (Hyundai Steel Co., Incheon, Republic of Korea) was used. The chemical composition of the reinforcing bar is shown in Table 1. Type 1 (ASTM C150) cement produced in Korea was used, and its chemical properties are shown in Table 2. As for the sand, ISO 679-compliant sand was used.

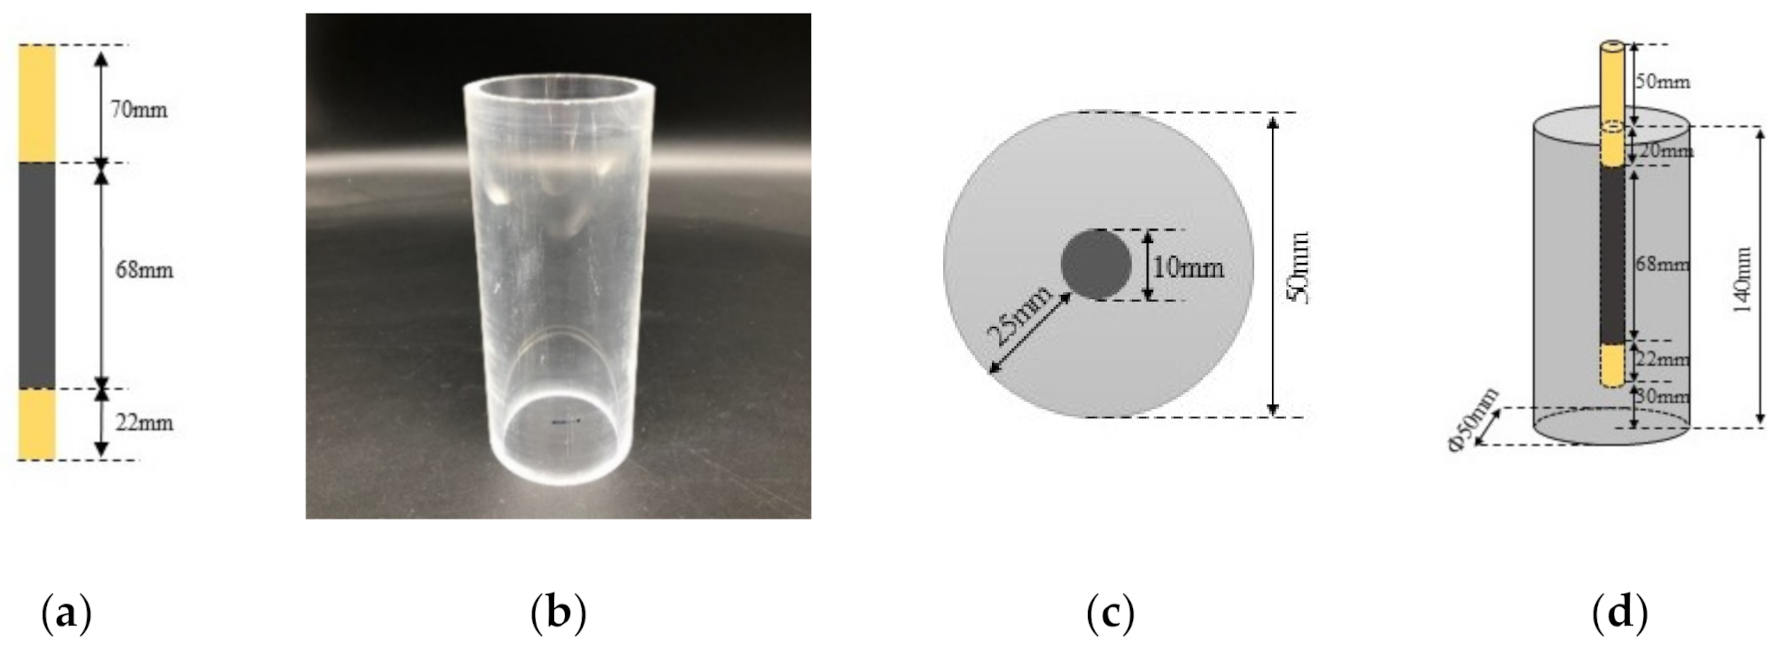
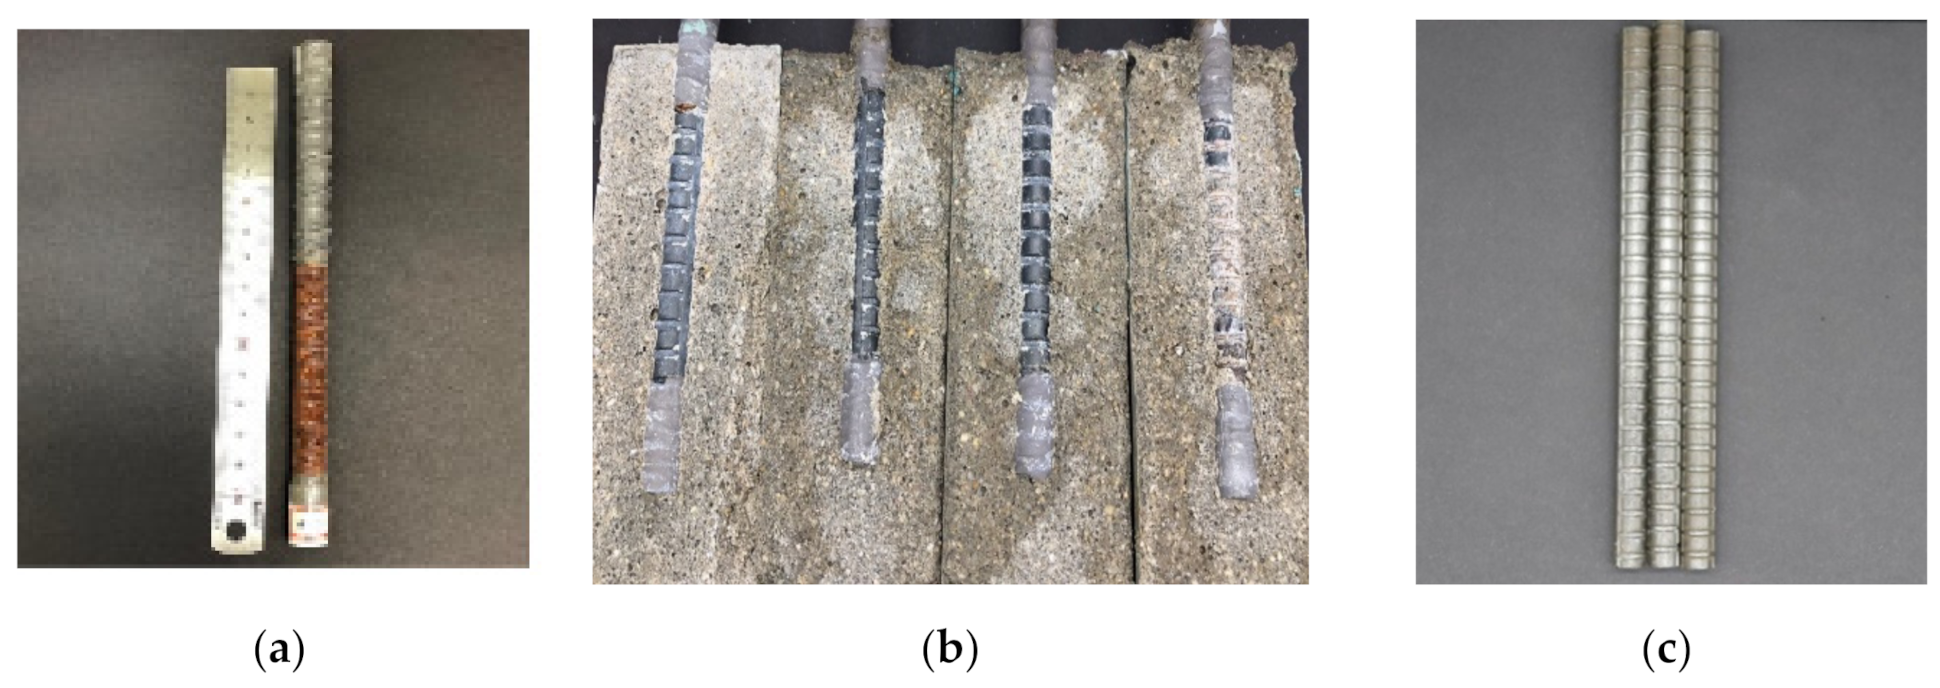
2.2. Specimen Preparation

The rebar was cut into 160-mm-long pieces and coated with Devcon ceramic epoxy (titanium putty 10760) in the upper (70 mm) and lower (22 mm) areas, as shown in Figure 1a. Two solutions, CaCl2 (10%) and HCl (3%), were applied using a brush at intervals of 24 h for 3 days, and the rebar was dried naturally to induce pre-rusting. The specimens were classified into three groups: A, pre-rust conditions (RE) for the standard reinforcement, B for CaCl2 (10%), and C for HCl (3%). Each group included eight specimens. The average weights of the rebar before being embedded in the cement-mortar composite were 95.220 g (A), 95.888 g (B), and 96.034 g (C). An acrylic mold (D 50 × H 150 mm, as shown in Figure 1b, was used to prepare the cement-mortar specimen. A mortar having a W/C value of 0.485, in accordance with ASTM C109, was placed carefully into the acrylic mold with the rebar at the center, as shown in Figure 1c, and the formulation is shown in Table 3. The specimen was de-molded after 48 h and water-cured for 28 days before it was immersed in a CaCl2 (3%) solution and stored at 23 ± 3 °C.

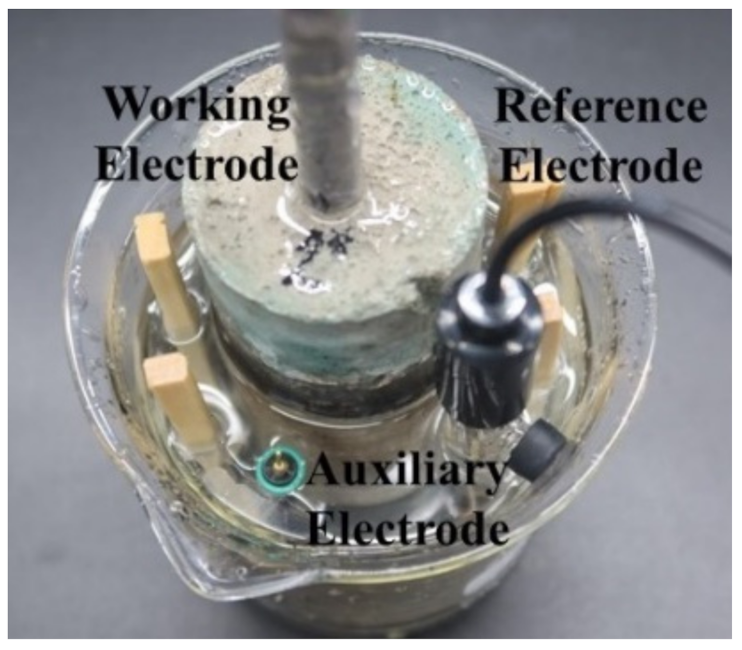
2.3. Measurement Method

To measure the half-cell potential and polarization resistance of the specimen, an electrical wire was connected to the end of the rebar (50 mm) exposed on the top of the specimen. The surface potential value of the specimen, which was calculated as the average of the three sides (0°, 120°, and 320°) at the midpoint of the specimen in accordance with ASTM C876, was considered as the half-cell potential.
A potentiostat (VSP-300, Biologic, Seyssinet-Pariset, France) was used for the measurement of the polarization resistance. Ag/AgCl was used as the reference electrode, and a graphite rod (GR; 6/70 mm) was used as the auxiliary electrode. A three-electrode setup was constructed, as shown in Figure 2, using the rebar of the specimen as the working electrode. With a scan range of +100 to −100 mV with respect to open circuit potential, the polarization resistance was measured at a scan speed of 0.5 mV/s for 10 min.

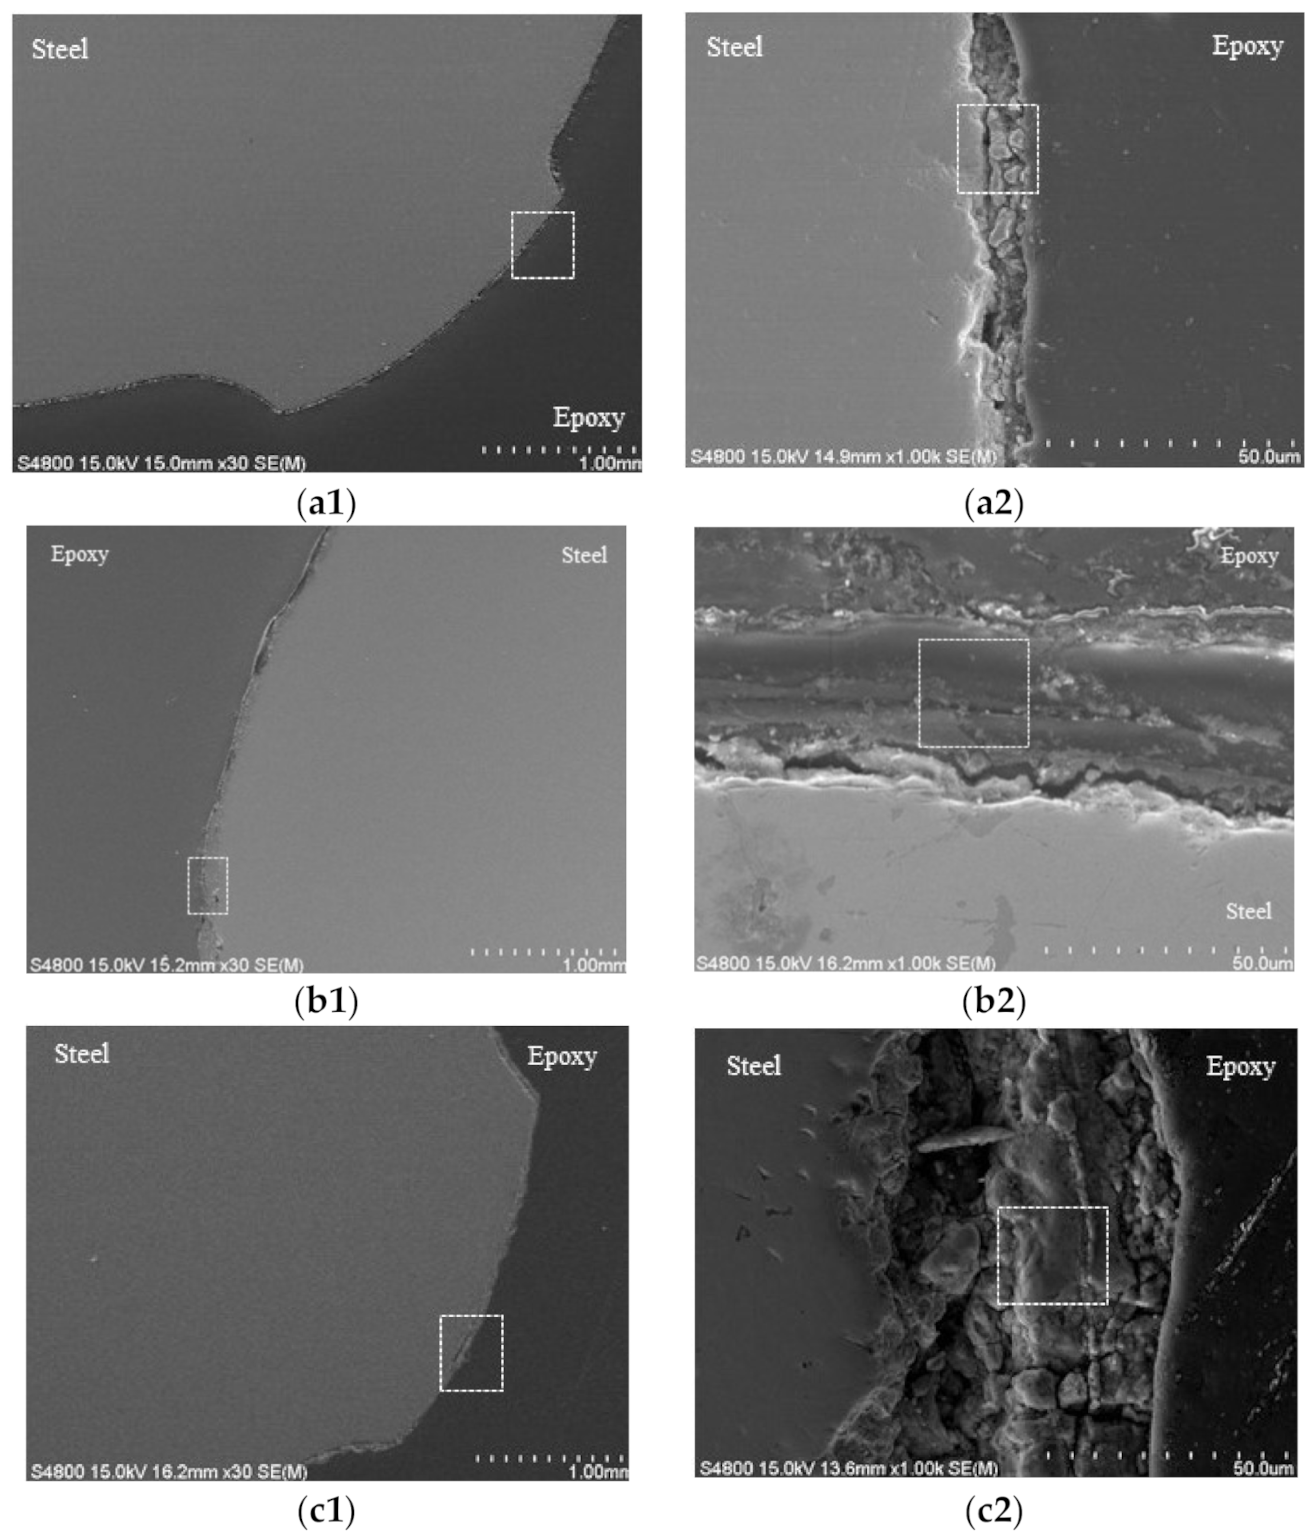
2.4. Scanning Electron Microscopy (SEM) and Energy Dispersive Spectrometer (EDX) Analysis

To observe the surface of the pre-rusted rebar, as mentioned in Section 2.2, the rebar cut to 50 mm in length was epoxy-mounted in a vacuum chamber, stored for 20 min, and then cured in an oven at 32 ± 3 °C for 9 h. The cured specimen was cut to a thickness of 5 mm using a precision sectioning saw (IsoMet Low speed saw, Buehler, Lake Bluff, IL, USA). The surface of the specimen was polished first with carbide silicon papers (240, 400, and 600 grit) and then with polycrystalline diamond suspension (6, 3, and 1 μm) using a Beta twin variable-speed grinder-polisher machine equipped with a power head (Vector LC 250).

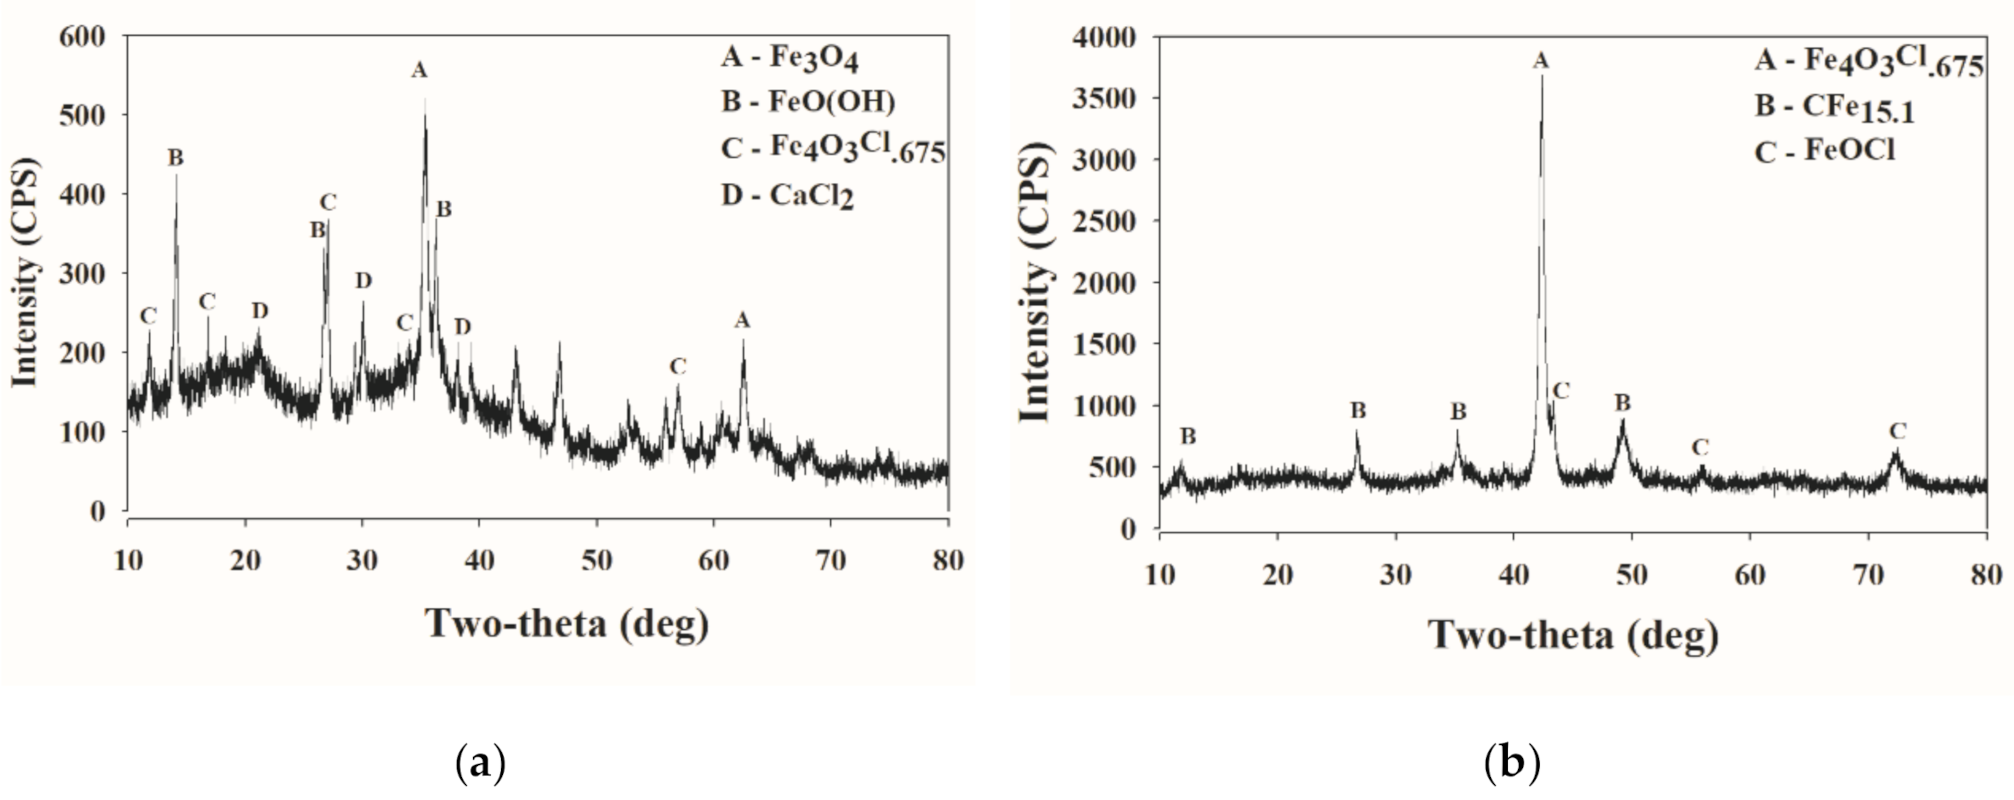
2.5. X-ray Diffraction Spectrometer (XRD) Measurement

To analyze corrosion products, the corroded rebar surface was scraped off using a steel brush. The powder was pulverized to a size of 30 μm using a mill (PULVERISETTE 9 Vibrating Cup Mill by FRITSCH, Idar-Oberstein, Germany). The sample was mounted on a powder specimen holder, and XRD analysis was performed by D/Max-2500V (Rigaku, Japan) with the experimental conditions as follows: voltage at 40 kV, current at 200 mA, and scan range from 5° to 80° at the scan speed of 2°/min.

3. Results

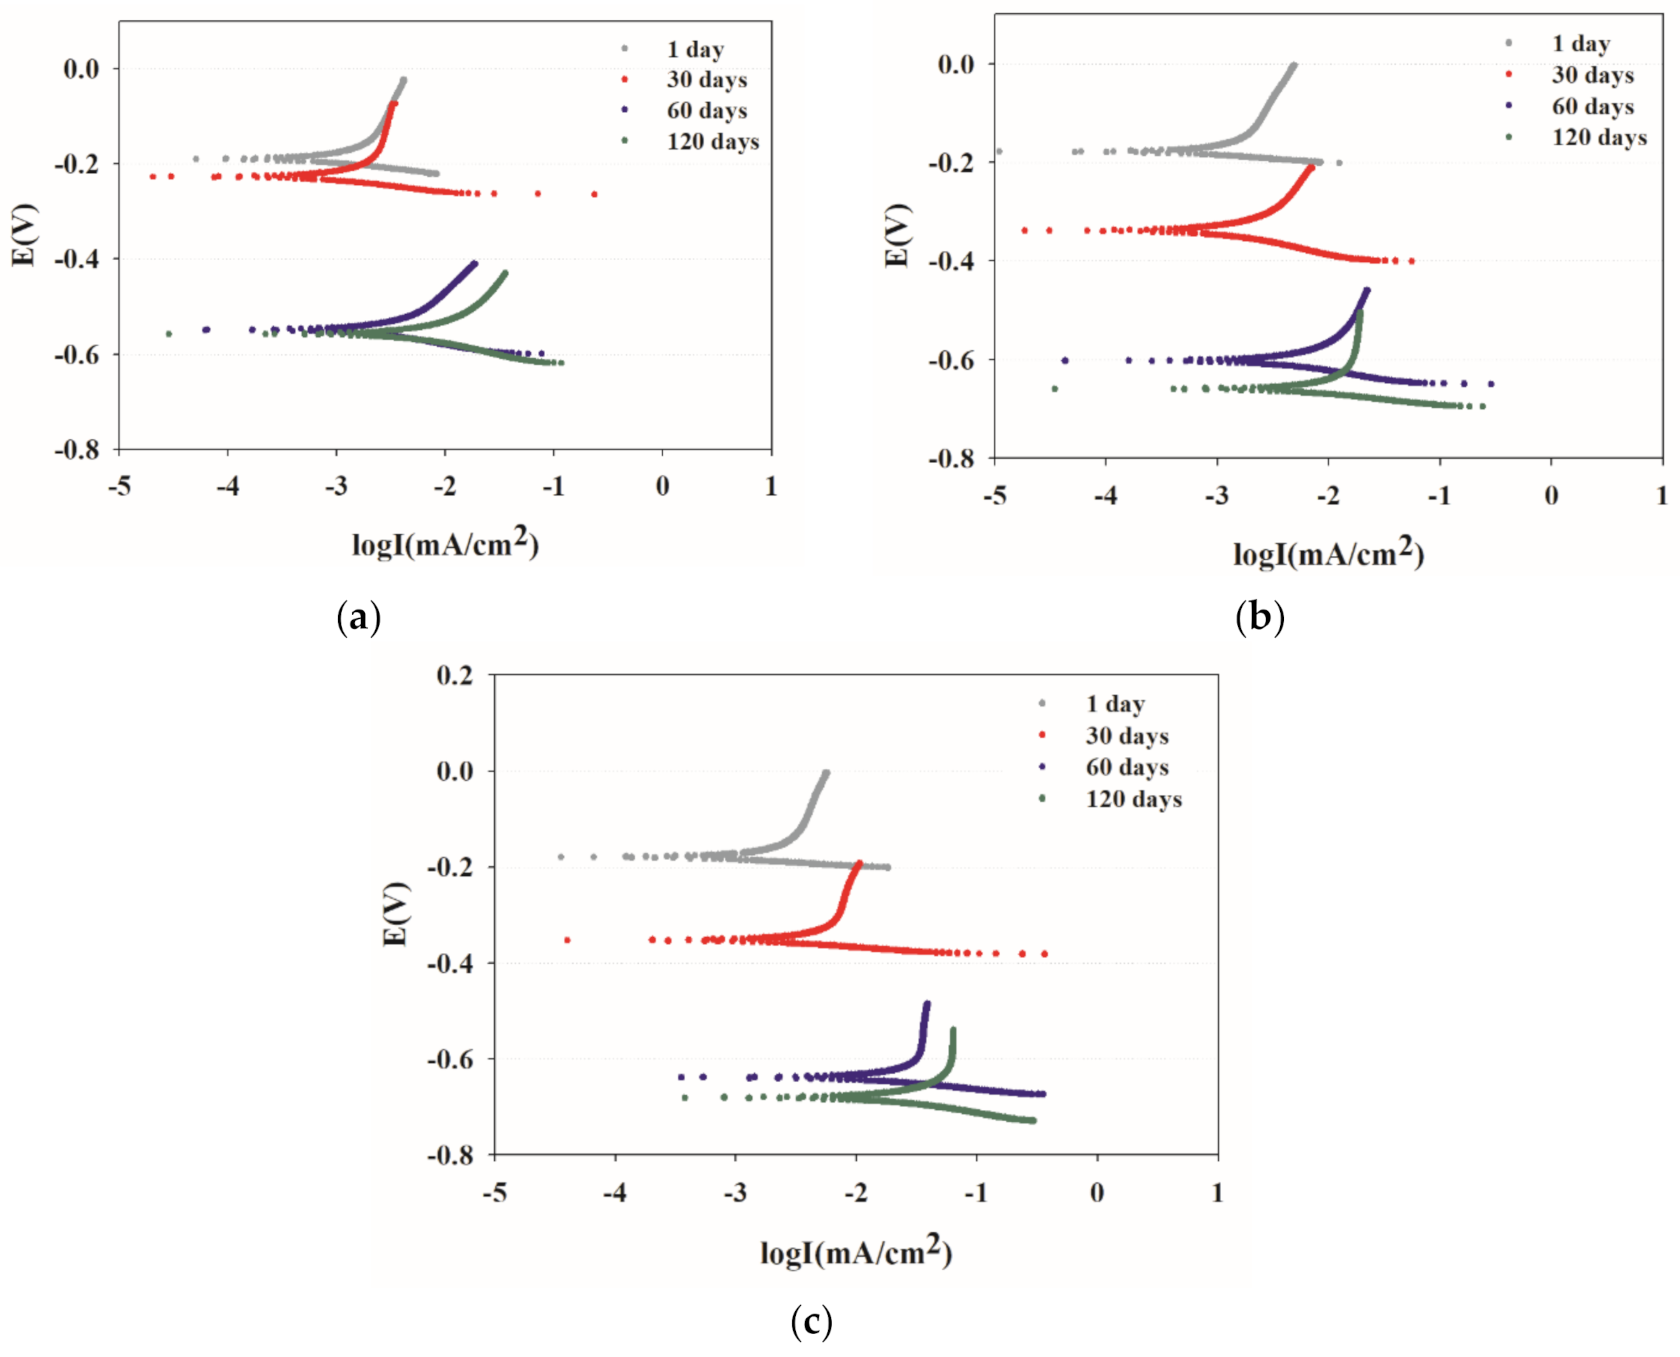
3.1. Electrochemical Measurements

The typical polarization curves for the specimen groups A, B, and C (RE, CaCl2, and HCl, respectively) stored in CaCl2 (3%) are shown in Figure 3. Measurements were recorded for a total of 120 days at 3-day intervals. The corrosion potential of the group A (RE) specimens was as low as −189 to −220 mV from day 1 to day 30, but increased rapidly from day 60 onwards and reached −557 mV on day 120. However, the group B and C specimens exhibited rapid increases from day 30 onwards, showing a 73% increase from day 1 to 120. These results are consistent with those of previous studies [15,26].

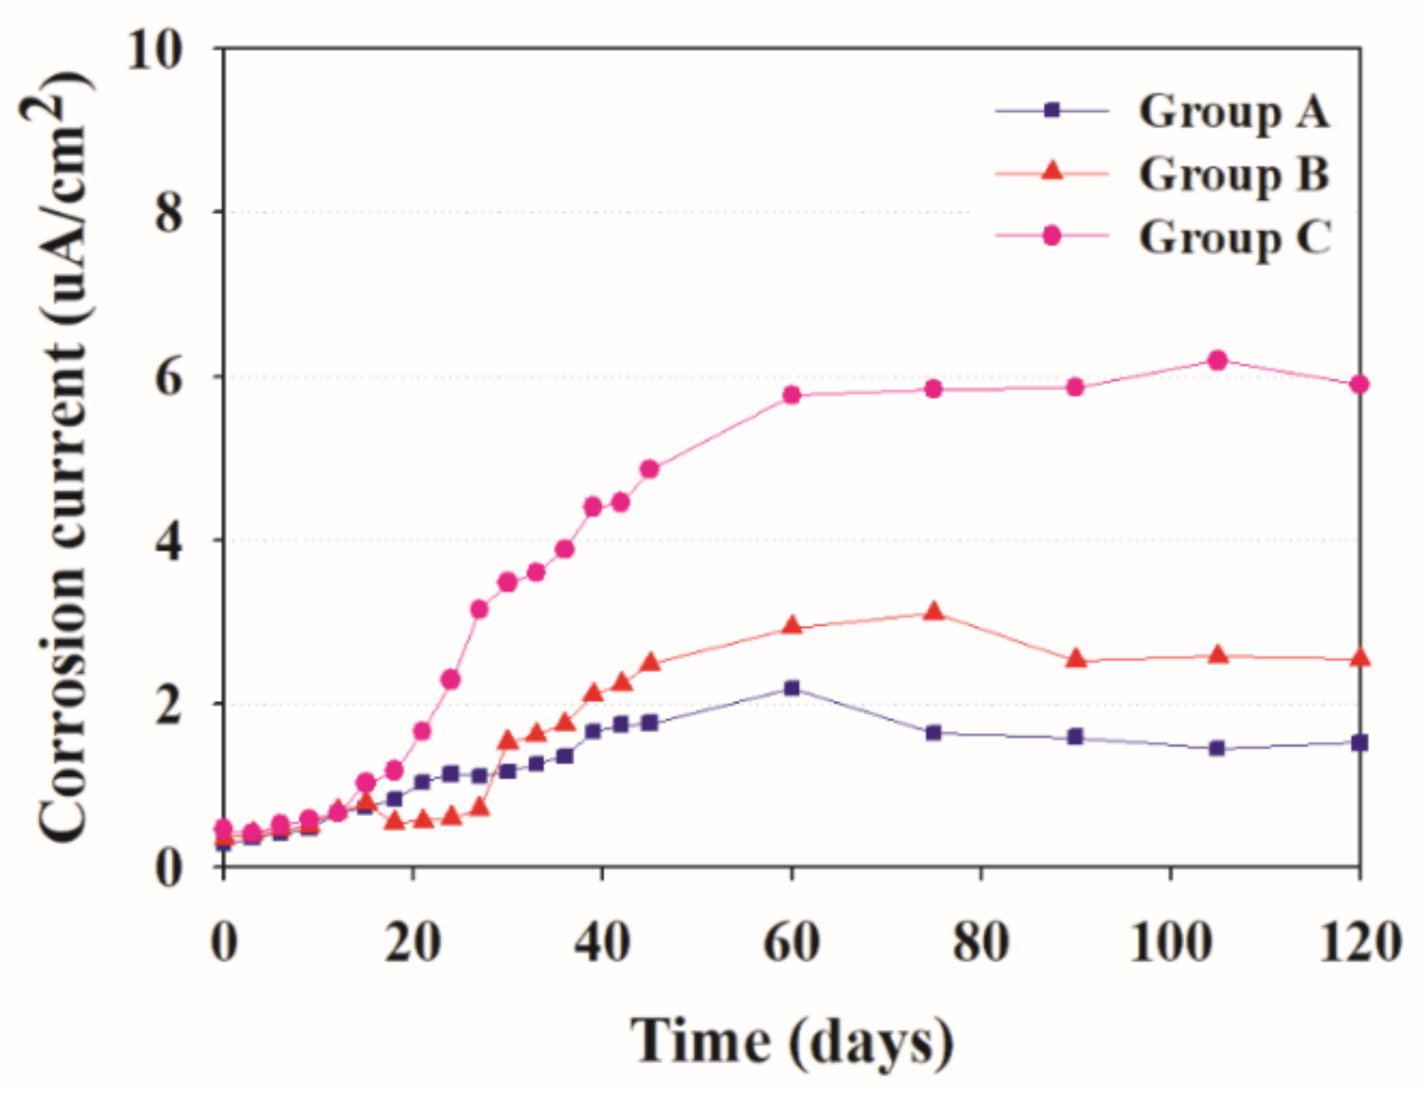
3.2. Corrosion Current

The corrosion current values measured over 120 days are shown in Figure 4. The difference in the corrosion current was not significant, regardless of the presence of pre-rust, from day 1 to 13 after the start of the experiment. However, the corrosion current of the group C specimens showed a tendency to increase from day 15. The corrosion current value increased gradually from day 30 for the group B specimens and from day 45 for the group A specimens. The average corrosion current over 120 days was 19% higher in group B and 137% higher in group C than in group A.
The corrosion rate was calculated using the corrosion current value measured on day 120. We found that the corrosion rate of the group C specimens (0.003 mm/year) was 1.6 times that of the group B specimens and 3.8 times that of the group A specimens.

3.3. Half-Cell Potential

Group A showed a linear decrease in the half-cell potential up to 40 days, and the average potential remained at about −0.60 V with slight variations in the measurements up to 120 days. Group B also showed a similar trend as group A with a slightly lower average potential of −0.63 V after 60 days. On the other hand, group C showed values, which continuously decrease with time, down to −0.7 V at 120 days.
The relationship between the corrosion current and half-cell potential values is shown in Figure 5b. Overall, the corrosion current increases as the half-cell potential decreases. The increase in the corrosion current for a specified decrease in the half-cell potential was higher in the group C specimens than in the group B specimens.

3.4. Scanning Electron Microscopy Analysis and X-ray Diffraction

The surface morphology and chemical composition of the rebar specimens were analyzed using a HITACHI S-4800 scanning electron microscope (SEM), from the joint equipment center of the Korea University College of Engineering. The SEM images of the group A, B, and C specimens prepared in Section 2.4 are shown in Figure 6. The outer layer of the pre-rusted specimens in groups B and C was separated from the rebar by a narrow crack along the interface, but the separation was not apparent in the group A specimens. The layer thickness of the non-corroded reinforcement group A was measured to be about 7.1 µm; other researchers reported that the thickness of the non-corroded reinforcement layer was about 10 µm [27,28]. The outer layer measured 15.33 µm for group B and 35.58 µm for group C, indicating that the amount of pre-corrosion in the group C rebar was approximately twice that in the group B rebar.
To determine the chemical composition of the outer layer, an energy dispersive spectrometer (EDX) analysis was conducted over the boxed area in Figure 6. The results showed the layer of group B and C specimens was mainly composed of O and Fe, as shown in Table 4; based on the atomic weight of the elements, we determined that the outer layer was mainly composed of Fe and FeO and FeOOH in groups B and C, respectively [27,29]. The absence of O in group A indicated no detectable corrosion on the rebar surface, as expected based on the previous study by Fouda et al. [30].
The chemical analysis of the outer layer collected from the pre-rust rebar surface was also analyzed using an X-ray diffraction spectrometer (XRD). Figure 7 shows the XRD analysis results. The results confirmed the presence of FeO and FeOO, in the form of FeOOH, FeOCl, along with lepidocrocite, akaganeite, magnetite, and goethite, which were consistent with the corrosion products formed on steel after one year of atmospheric exposure [31].

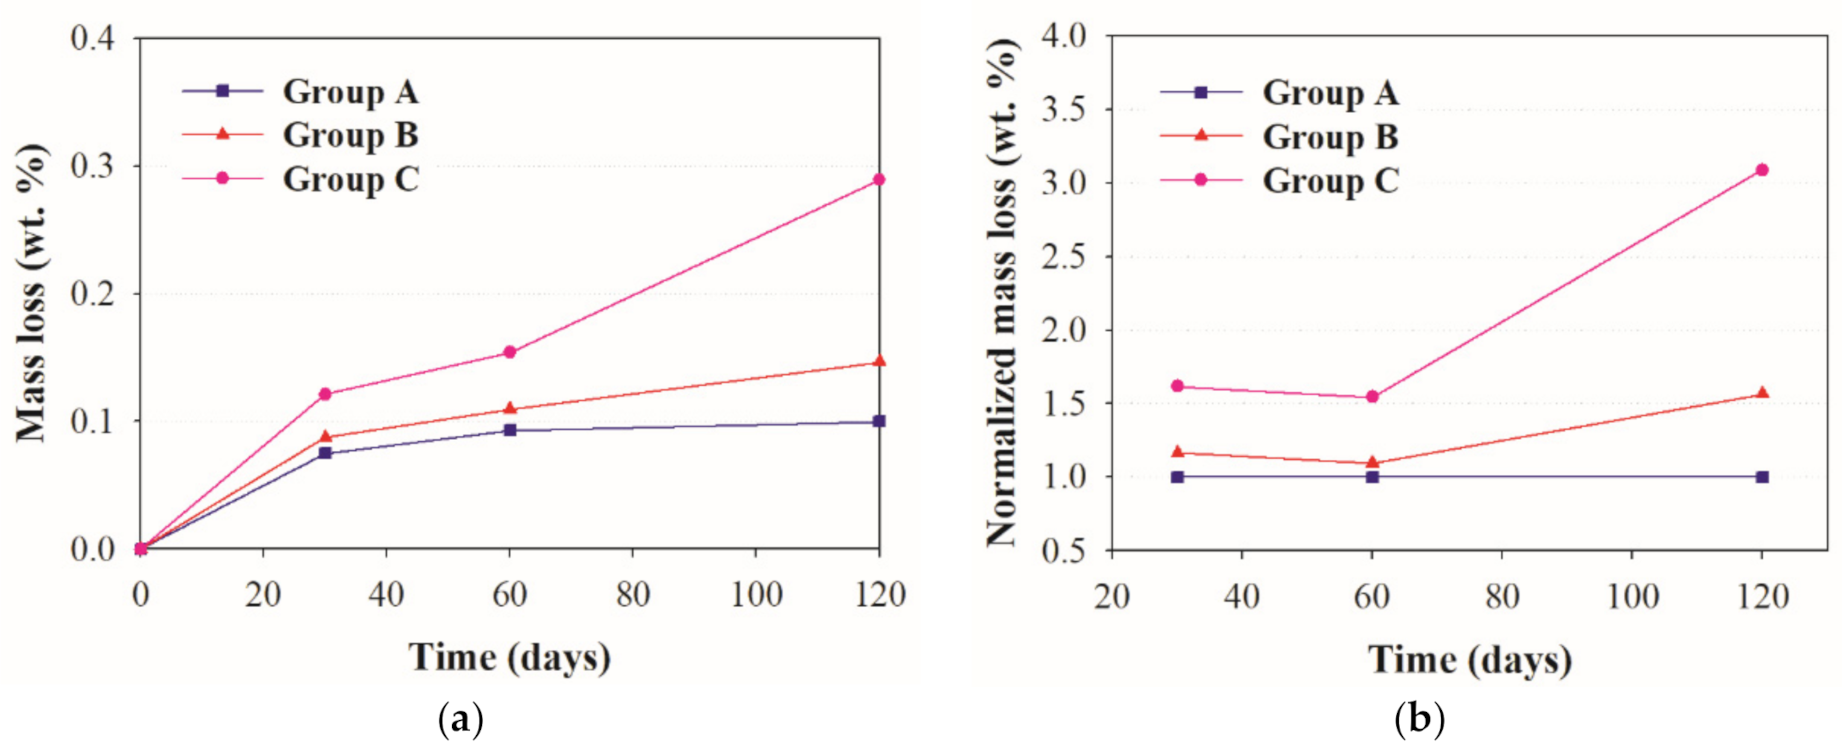
3.5. Visual Observation and Mass Loss

Visual observation showed that corrosion did not occur in the epoxy-mounted part of the rebar but was found on the exposed surface of the rebar from specimens B and C, as shown in Figure 8 below. The color of the exposed corrosion appears yellowish brown. Subsequently, the rebar was extracted from the cement composite specimen, and the corroded rebar was weighed to quantify the mass loss. The cleaning process was performed in accordance with ASTM G1-03 until no change in the weight could be detected, as shown in Figure 9a.
The mass losses at values from day 30 to 60 were not significantly different. However, from the 60th day onward, corrosion progressed rapidly. The mass loss at day 120 indicated that the amount of corrosion increases over time, with the CaCl2 sample being 1.5 times higher than the RE and the HCl sample being 3.08 times higher than the RE (Figure 9b). This finding is consistent with the result of the corrosion trend described in Section 3.2, with the corrosion level being: Group A << Group B < Group C.

4. Conclusions

In this study, the effect of pre-rusting of rebar on the durability of rebar in cement composites was analyzed. Based on the obtained results, the following conclusions on the corrosion behavior of pre-rusted rebar in a cement composite were drawn:
The pre-rusted rebar underwent 2–3 times faster internal corrosion than the non-pre-rusted rebar when embedded in the reinforced cement composite exposed to a chloride-containing solution.
Although the HCl solutions had 50% less chloride content than CaCl2, HCl caused initial corrosion through the mill scale more effectively than CaCl2, and resulted in the faster corrosion of the rebar in the cement composite. At 120 days, the corrosion rate of HCl was 2.3 times faster than that of CaCl2 in cement composite.For the specimens considered in this study, the half-cell potential and the corrosion current were proportional when the corrosion current was 1.5 µA or higher. The result of XRD analysis showed that the corrosion products in the pre-rusted layer were similar to those of the rebar corroded in the marine atmosphere.The pre-rusting treatment considered in this study may provide an efficient method for researchers to reduce the time needed to prepare corroded concrete specimens by 50%.

Author Contributions

Conceptualization, C.Y. and H.L.; Data curation, G.B.; Funding acquisition, C.Y. and H.L.; Investigation, G.B.; Project administration, I.J.; Resources, I.J.; Supervision, C.Y.; Validation, I.J.; Visualization, D.S.; Writing—original draft, G.B. and D.S.; Writing—review and editing, C.Y. and H.L. All authors have read and agreed to the published version of the manuscript.

Funding

This research was supported by a grant (20SCIP-B146946-03) from the Smart Civil Infrastructure Research Program funded by the Ministry of Land, Infrastructure, and Transport of the Korean government.

Acknowledgments

This work was supported by a Korea University grant.

Conflicts of Interest

The authors declare no conflict of interest. The funders had no role in the design of the study, in the collection, analyses, or interpretation of data, in the writing of the manuscript, or in the decision to publish the results.

References

  1. Uthaman, S.; George, R.P.; Vishwakarma, V.; Harilal, M.; Philip, J. Enhanced seawater corrosion resistance of reinforcement in nanophase modified fly ash concrete. Constr. Build. Mater. 2019, 221, 232–243. [Google Scholar] [CrossRef]
  2. Revie, R.W. Corrosion and Corrosion Control: An Introduction to Corrosion Science and Engineering; John Wiley & Sons: Hoboken, NJ, USA, 2008. [Google Scholar]
  3. Angst, U.M.; Geiker, M.R.; Alonso, M.C.; Polder, R.; Isgor, O.B.; Elsener, B.; Wong, H.; Michel, A.; Hornbostel, K.; Gehlen, C.; et al. The effect of the steel–concrete interface on chloride-induced corrosion initiation in concrete: A critical review by RILEM TC 262-SCI. Mater. Struct. 2019, 52, 88. [Google Scholar] [CrossRef]
  4. Angst, U.M. Challenges and opportunities in corrosion of steel in concrete. Mater. Struct. 2018, 51, 4. [Google Scholar] [CrossRef] [Green Version]
  5. Kumar Sharma, D.; Filipponi, M.; Di Schino, A.; Rossi, F.; Castaldi, J. Corrosion behaviour of high temperature fuel cells: Issues for materials selection. Metalurgija 2019, 58, 347–351. [Google Scholar]
  6. Di Schino, A. Manufacturing and Applications of Stainless Steels. Metals 2020, 10, 327. [Google Scholar] [CrossRef] [Green Version]
  7. Mohammed, T.U.; Hamada, H. Corrosion of steel bars in concrete with various steel surface conditions. ACI Mater. J. 2006, 103, 233–242. [Google Scholar]
  8. Bensabra, H.; Azzouz, N. Study of rust effect on the corrosion behavior of reinforcement steel using impedance spectroscopy. Metall. Mater. Trans. A 2013, 44, 5703–5710. [Google Scholar] [CrossRef]
  9. Ismail, A.I.M.; El-Shamy, A.M. Engineering behaviour of soil materials on the corrosion of mild steel. Appl. Clay Sci. 2009, 42, 356–362. [Google Scholar] [CrossRef]
  10. Zhang, J.; Hosemann, P.; Maloy, S. Models of liquid metal corrosion. J. Nucl. Mater. 2010, 404, 82–96. [Google Scholar] [CrossRef]
  11. Shalon, R.; Rapheal, M. Influence of sea water on corrosion of reinforcement. J. Proc. 1959, 55, 1251–1268. [Google Scholar]
  12. Martinez-Echevarria, M.J.; Lopez-Alonso, M.; Romero, D.C.; Montero, J.R. Influence of the previous state of corrosion of rebars in predicting the service life of reinforced concrete structures. Constr. Build. Mater. 2018, 188, 915–923. [Google Scholar] [CrossRef]
  13. Fang, C.; Lundgren, K.; Chen, L.; Zhu, C. Corrosion influence on bond in reinforced concrete. Cem. Concr. Res. 2004, 34, 2159–2167. [Google Scholar] [CrossRef]
  14. Chung, L.; Kim, J.-H.J.; Yi, S.-T. Bond strength prediction for reinforced concrete members with highly corroded reinforcing bars. Cem. Concr. Compos. 2008, 30, 603–611. [Google Scholar] [CrossRef]
  15. Abosrra, L.; Ashour, A.F.; Youseffi, M. Corrosion of steel reinforcement in concrete of different compressive strengths. Constr. Build. Mater. 2011, 25, 3915–3925. [Google Scholar] [CrossRef]
  16. Kielė, A.; Vaitkevičius, V.; Sasnauskas, V.; Vaičiukyniene, D.; Bistrickaitė, R. Reinforcement Corrosion Degree Effect on Adhesion with Concrete. J. Sustain. Arch. Civ. Eng. 2014, 7. [Google Scholar] [CrossRef]
  17. Pradhan, B. Corrosion behavior of steel reinforcement in concrete exposed to composite chloride–sulfate environment. Constr. Build. Mater. 2014, 72, 398–410. [Google Scholar] [CrossRef]
  18. Oh, K.-S.; Moon, J.-M.; Park, K.-T.; Kwon, S.-J. Evaluation of Load Capacity Reduction in RC Beam with Corroded FRP Hybrid Bar and Steel. J. Korea Inst. Struct. Maint. Insp. 2016, 20, 10–17. [Google Scholar] [CrossRef] [Green Version]
  19. Li, J.; Gong, J.; Wang, L. Seismic behavior of corrosion-damaged reinforced concrete columns strengthened using combined carbon fiber-reinforced polymer and steel jacket. Constr. Build. Mater. 2009, 23, 2653–2663. [Google Scholar] [CrossRef]
  20. Novak, P.; Mala, R.; Joska, L. Influence of pre-rusting on steel corrosion in concrete. ACI J. Proc. 2001, 31, 589–593. [Google Scholar] [CrossRef]
  21. Al-Tayyib, A.; Khan, M.; Allam, I.; Al-Mana, A. Corrosion behavior of pre-rusted rebars after placement in concrete. Cem. Concr. Res. 1990, 20, 955–960. [Google Scholar] [CrossRef]
  22. Gonzalez, J.; Ramírez, E.; Bautista, A.; Feliu, S. The behaviour of pre-rusted steel in concrete. Cem. Concr. Res. 1996, 26, 501–511. [Google Scholar] [CrossRef]
  23. Kim, J.-S.; Shin, Y.-S.; Lee, S.; Kim, K.-S. The effect of chloride on corrosion of reinforced concrete. J. Korea Inst. Struct. Maint. Insp. 2005, 9, 2. [Google Scholar]
  24. Poursaee, A.; Hansson, C.M. Reinforcing steel passivation in mortar and pore solution. Cem. Concr. Res. 2007, 37, 1127–1133. [Google Scholar] [CrossRef]
  25. Beom, W.-J.; Yun, K.-S.; Park, C.-J.; Ryu, H.-J.; Kim, Y.-H. Comparison of influences of NaCl and CaCl2 on the corrosion of 11% and 17% Cr ferritic stainless steels during cyclic corrosion test. Corros. Sci. 2010, 52, 734–739. [Google Scholar] [CrossRef]
  26. Maslehuddin, M.; Al-Zahrani, M.; Al-Dulaijan, S.; Abdulquddus; Rehman, S.; Ahsan, S. Effect of steel manufacturing process and atmospheric corrosion on the corrosion-resistance of steel bars in concrete. Cem. Concr. Compos. 2002, 24, 151–158. [Google Scholar] [CrossRef]
  27. Ghods, P.; Isgor, O.B.; McRae, G.; Gu, G.P.; Li, J. Effect of surface condition on the chloride-induced depassivation of rebar in concrete. In Proceedings of the 12th International Conference on Fracture (ICF), Ottawa, Canada CD Proceeding, Ottawa, ON, Canada, 12 July 2009. [Google Scholar]
  28. Doi, K.; Hiromoto, S.; Shinohara, T.; Tsuchiya, K.; Katayama, H.; Akiyama, E. Role of mill scale on corrosion behavior of steel rebars in mortar. Corros. Sci. 2020, 177, 108995. [Google Scholar] [CrossRef]
  29. Geng, J.; Liu, J.; Yan, J.; Ba, M.; He, Z.; Li, Y. Chemical composition of corrosion products of rebar caused by carbonation and chloride. Int. J. Corros. 2018, 2018, 7479383. [Google Scholar] [CrossRef] [Green Version]
  30. Fouda, A.S.; Megahed, H.E.; Fouad, N.; Elbahrawi, N.M. Corrosion inhibition of carbon steel in 1 M hydrochloric acid solution by aqueous extract of Thevetia peruviana. J. Bio-Tribo-Corros. 2016, 2, 16. [Google Scholar] [CrossRef] [Green Version]
  31. de la Fuente, D.; Díaz, I.; Alcántara, J.; Chico, B.; Simancas, J.; Llorente, I.; García-Delgado, A.; Jiménez, J.A.; Adeva, P.; Morcillo, M. Corrosion mechanisms of mild steel in chloride-rich atmospheres. Mater. Corros. 2016, 67, 227–238. [Google Scholar] [CrossRef]
Figure 1. Mortar specimen: (a) coating of steel bar, (b) an acrylic mold, (c) top view, and (d) side view.
Applsci 10 08705 g001
Figure 2. Test specimen setup.
Applsci 10 08705 g002
Figure 3. Polarization curve: (a) specimen A, (b) specimen B, and (c) specimen C.
Applsci 10 08705 g003
Figure 4. Corrosion current vs. time.
Applsci 10 08705 g004
Figure 5. (a) Half-cell potential vs. time; (b) Corrosion current vs. half-cell potential
Applsci 10 08705 g005
Figure 6. SEM image of steel rebar section: (a1) Group A (×30), (b1) Group B (×30), and (c1) Group C (×30), (a2) Group A (×1000), (b2) Group B (×1000), and (c2) Group C (×1000); -2 image shows the boxed area shown on the image -1 at higher magnification; boxed area shown in -2 image is scanned by EDX.
Applsci 10 08705 g006
Figure 7. (a) XRD analysis of specimen B, (b) XRD analysis of specimen C.
Applsci 10 08705 g007
Figure 8. (a) Surface of pre-rusted rebar, (b) typical image of split mortar specimen, and (c) cleaned rebar.
Applsci 10 08705 g008
Figure 9. (a) Mass loss (wt %) vs. time; (b) normalization mass loss (wt %) vs. time.
Applsci 10 08705 g009
Table 1. Chemical composition of steel bar (% mass).
CSiMnPSCuNC Eq 1
SD4000.270.130.490.0140.0130.330.010.40
1 Carbon equivalent.
Table 2. Chemical composition of cement (%).
SiO2Al2O3CaOMgOFe2O3SO3K2ONa2OTiO3Loss on Ignition
18.24.8770.51.323.320.270.530.020.320.65
Table 3. Details of mix; cement-mortar proportions.
Cement (g)Fine Aggregate (g)Water (mL)
15004125726
Table 4. Chemical composition measured by Energy Dispersive Spectrometer EDX (%).
SpecimenSPMnOFeCClCa
A----97.522.48--
B2.310.30.732.7462.01-1.550.4
C-1.140.7420.4977.45-0.18-
Publisher’s Note: MDPI stays neutral with regard to jurisdictional claims in published maps and institutional affiliations.

