Abstract
A new research scheme for a full-scale/model test comparison is proposed for effectively validating the wind tunnel pressure measurement technique in this article. With the new research scheme and using quantifiable data, future full-scale/model test comparisons are expected to reasonably disclose the main problem with the traditional atmospheric boundary layer wind tunnel pressure measurement technique with regard to the Reynolds number (Re) effects, the aero-elastic effects and the flow characteristic effects. Based on the engineering background of the Peng-cheng cooling tower, it was quantified by using the new research scheme that the average relative errors of the mean wind pressure coefficients are 52.39%, 1.87% and 35.91% for the Re effects, the aero-elastic effects and the flow characteristic effects, respectively. In view of the fluctuating wind pressure coefficients, the average relative errors are 97.58%, 21.14% and 20.20% for the Re effects, the aero-elastic effects and the flow characteristic effects, respectively. These suggest that Re effects are extremely significant for pressure measurement model tests of circular cylindrical structures, and flow characteristic effects are noticeable too. They should be mitigated using effective approaches, i.e., increasing the model surface roughness and placing the actively controlled devices at the beginning of the wind tunnel’s working section, respectively. Additionally, the key field measurement technique adopted (i.e., the calculation of the reference static pressure) and details of manufacturing the aero-elastic pressure measurement model for the present study are also expounded in the article for reference.
1. Introduction
Atmospheric boundary layer (ABL) wind tunnel model tests are the most widely-employed approaches for wind-engineering research and design today. As physical modeling practices, the accuracies of the ABL wind tunnel model tests draw the attention of the wind engineering community. Until today, hundreds of research projects compared the wind effects or wind-induced structural responses measured on the engineering sites with the corresponding wind tunnel model test data. The majority of these comparisons suggested that the full-scale/model test discrepancies were noticeable.
Many researchers subjectively inferred that two reasons should be responsible for the inaccuracies of ABL wind tunnel model tests. First, relying on passive simulation devices, complete turbulent flow characteristics of the realistic ABL flow field cannot be truthfully simulated in a traditional passive wind tunnel (the corresponding influences are referred to as flow characteristic effects hereinafter) [1,2,3]. Wind tunnel model tests treat empirical ABL flow characteristics presented in the Codes of Practice and monographs as simulation targets. However, it was found that the turbulent flow characteristics simulated in the wind tunnel deviated from their simulation targets in many cases, causing significant negative effects. According to Pang [4], the realistic mean wind speed profiles could be correctly simulated using spires and roughness elements in the wind tunnel, and the simulated turbulence intensities and power spectral densities were accurate below a certain height. However, when the height was increased, the simulated turbulence intensities were sometimes lower than their simulation targets, and the simulated power spectral densities became unrealistic. The simulated turbulence integral scale decreased with the increase in height, which was against the physical truth. In the history of the wind engineering community, Marshall [1] compared the wind pressures measured on a single-family dwelling with results obtained from a 1:50 scale model placed in a turbulent boundary layer in 1975. It was shown that the fluctuating wind pressure coefficients obtained from the model test were consistently low, which was attributed to the improper simulation of the lower portion of the ABL in the wind tunnel. Apperley et al. [2] modeled a two-story house at Aylesbury at 1:500 scale in a ABL wind tunnel to compare with the full-scale measurement results. The roughness length simulated in the wind tunnel was found to be too limited to characterize the local roughness near the measuring site, and it was suggested that the traditionally used similarity parameter in the wind tunnel was probably not sufficient to ensure similarity. Dalley [3] compared the surface pressures measured on a low-rise building model to the full-scale data taken on a Silsoe Structures Building. Comparisons between the model and full-scale surface pressure spectra at two taps suggested that differences were notable. It was indicated that the poor comparison was due to the differences in the full-scale and wind-tunnel approach flows. To deal with this issue, actively controlled devices are placed in the beginning of the wind tunnel’s working section to increase the turbulence intensity and the turbulence integral scale of the simulated flow by some researchers. The employed actively controlled devices included vibrating grids and active vanes.
Second, Reynolds number (Re) effects exist for wind tunnel model tests (the corresponding influences are referred to as Re effects hereinafter) [5,6,7,8]. Basically, the flow separation location for flow around a bluff body without corners is sensitive to Re. Since the Re for model tests is usually two orders of magnitude smaller than the Re for the prototype flow event, significant distortions might be caused for the model test data. Hoxey et al. [5] compared the detailed wind pressures measured on a Silsoe Structures Building at full scale and on a scaled model. Differences were found at the separated flow region on the windward roof slope, which suggested that the region was associated with significant Re effects. Richardson et al. [6] compared wind pressures obtained on a full-scale Silsoe Structures Building with those from two 1:100 scaled models. It was found that the high negative pressures tended to be underestimated in the wind tunnel, which is considered to be associated with a Re effect. Hoxey et al. [7] compared surface pressures measured on a Silsoe Structures Building at both full scale and model scale. Differences were observed in the separated flow at the windward eaves of the building based on the smoke technique for the full-scale flow visualization, which were suggested to be Re dependent. To deal with this issue, sticking paper belts on the model and adjusting the flow velocity in the wind tunnel have been extensively used in the wind-engineering community to reduce Re effects; thus, it is called high Re effects simulation. Through high Re effects simulation, model test data obtained with a low Re can approach the full-scale measurement results with a high Re.
In recent years, some researchers suggested that a third reason might exist for the inaccuracies of the rigid pressure measurement model tests, which is that the aero-elastic effects and the aerodynamic damping are wrongfully ignored for those model tests (the corresponding influences are referred to as aero-elastic effects hereinafter) [9,10,11,12,13,14]. For example, Song et al. [9] developed a bi-axial forced vibration device to evaluate the aero-elastic effects of tall buildings via wind tunnel tests. It was found that the aero-elastic effects cannot be ignored for wind-induced responses of the targeted building under strong winds. Zou et al. [10], Huang et al. [11], Quan et al. [12], Gu et al. [13] and Wang et al. [14] conducted wind tunnel tests to investigate the along-wind and the across-wind aerodynamic damping ratios of tall buildings, and they found that the aerodynamic damping in certain conditions appears to have a negative value, which increases the dynamic response of a tall building. Therefore, it should not be ignored in physical model tests for conservativeness.
It should be realized that the above-mentioned explanations for the causes of the observed full-scale/model test differences are given by the researchers without scientific validations. In this regard, endeavors should be made to validate those explanations using reliable data. In practice, flow characteristic effects, Re effects and aero-elastic effects should be respectively quantified. Since these adverse effects are mingled for the traditional full-scale/model test comparisons, a new research scheme relying on the aero-elastic pressure measurement modeling technique is proposed and validated for future full-scale/model test comparisons in order to verify the wind tunnel pressure measurement technique by the wind engineering community in this article, which can reasonably separate the flow characteristic effects, the Re effects and the aero-elastic effects. We hope the wind engineering community can finally find the most significant adverse influence on the reliability of the traditional ABL wind tunnel pressure measurement technique after extensive comparisons using the proposed research scheme. If Re effects and flow characteristic effects are found to be as unfavorably significant as they are traditionally thought to be, they should be mitigated using corresponding approaches, i.e., sticking paper belts on the model and placing actively controlled devices in the beginning of the wind tunnel’s working section [15,16,17,18], respectively. If aero-elastic effects are also found to be significant, we should further explore some new ways to deal with this new practical issue.
2. A New Research Scheme for Full-Scale/Model Test Comparisons
The proposed new research scheme for future full-scale/model test comparisons consists of the following steps:
- (1)
- Conduct full-scale measurements for wind effects on the full-scale structure.
- (2)
- Manufacture an aero-elastic pressure measurement model and a rigid pressure measurement model of the prototype in the wind tunnel, and simulate the high Re effects on these models by roughening the surfaces of the models.
- (3)
- Conduct wind tunnel model tests for wind effects on scaled models.
- (4)
- Compare wind effects according to the in situ measurements to those according to the wind tunnel model test using the rigid model without Re effects simulation to quantify the total discrepancies, which contain Re effects, flow characteristic effects and aero-elastic effects. Then, use the wind effects measured on the aero-elastic and the rigid models with the high Re effects simulation to separate the mingled adverse effects. Specifically, flow characteristic effects can be obtained by subtracting wind effects from full-scale measurements from those using the aero-elastic model with high Re effects simulation; aero-elastic effects can be obtained by subtracting wind effects using the aero-elastic model with high Re effects simulation from those using the rigid model with high Re effects simulation; and Re effects can be obtained by subtracting wind effects using the rigid model with high Re effects simulation from those using the rigid model without high Re effects simulation.
- (5)
- Reveal the most significant adverse influence on the reliability of the traditional ABL wind tunnel pressure measurement technique by comparing the three adverse effects.
The flowchart of the new research scheme is presented in Figure 1. As can be seen, the feasibility of the new research scheme largely depends on the successful manufacture of an aero-elastic pressure measurement model. Under the engineering background of the Peng-cheng cooling tower, the following case study employs an innovative beam-net aero-elastic model manufactured using the method proposed by Ref. [19].
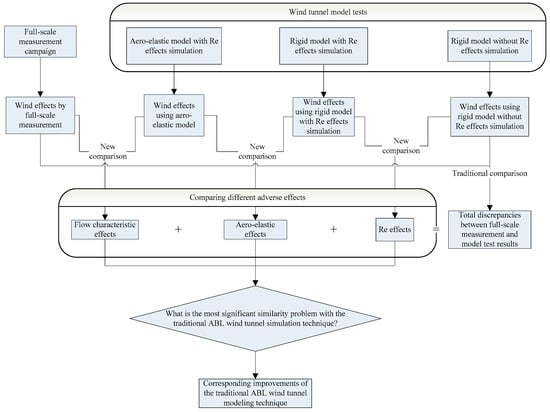
Figure 1.
Flowchart of the new research scheme.
3. Case Study: Peng-Cheng Cooling Tower
To check the applicability of the new research scheme, a case study of the Peng-cheng cooling tower is undertaken in this portion of study.
3.1. Engineering Background
A 167 m smooth-walled cooling tower located in the Peng-cheng power station, Xu-zhou, China, is chosen as the engineering background. To its south, there is an adjacent cooling tower of the same size as the one for measurements, and there is an industrial complex to its west (see Figure 2). However, to its north and east, there is no large interfering building.
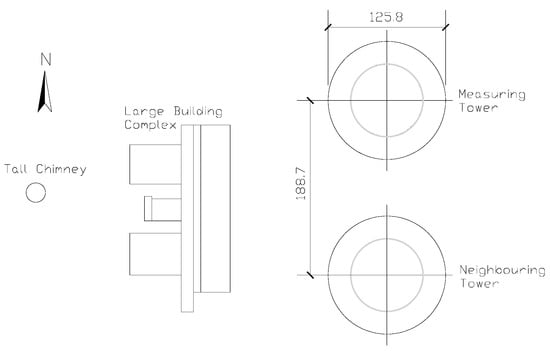
Figure 2.
Site plan of Peng-cheng electric power station (unit: m).
3.2. Full-Scale Measurements
During its construction, 36 pressure transducers were evenly installed around the targeted tower’s throat section at 130 m high (see Figure 3 and Figure 4). The whole full-scale measurement campaign lasted from 2010 to 2015 on a basis of 2–3 times of intensive tests per year. Among the large amount of data measured, those obtained from 28 November 2011, to 12 December 2011, are found to be most representative. During that period of time, only wind speeds for 29 November and 8 December exceeded 12 m/s, which represents valid strong wind scenarios. However, on 8 December, the incoming flow is from due north, and it is from due east on 29 November. As some transducers installed on the tower’s north surface are found ineffective, complete wind effects around a half-circle can only be obtained on 29 November. In addition, the upstream terrain is smooth, and there are no obvious interference effects caused by neighboring cooling towers or buildings with respect to the specific wind direction of 29 November. As a result, the wind-induced pressures recorded on 29 November in 2011 are used. After processing the data measured on 29 November in 2011, the mean and the fluctuating wind pressure distributions around the throat section of the prototype Peng-cheng cooling tower are obtained for the case study.
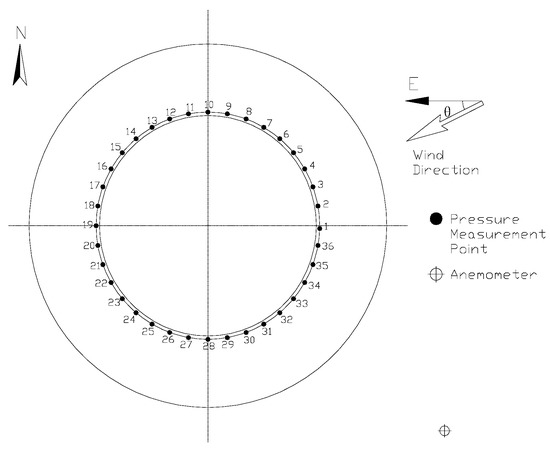
Figure 3.
Plan of pressure measurement points.

Figure 4.
Projection of measuring tower (unit: m).
More details of the full-scale measurement campaign can be found in Refs. [20,21,22]. As suggested in Refs. [20,21,22], most technical issues concerning field pressure measurements on full-scale buildings perplexing the wind engineering community were well solved by the Peng-cheng tower measurement campaign, which included a key technical difficulty, i.e., the establishment of the reference static pressure for the pressure measurements on location. Different from the traditional unreliable method of directly measure the reference static pressure on location, the present measurement campaign proposes and utilizes a simple but effective method to calculate the reference static pressure from the field measurement data. It is detailed below.
According to Refs. [20,23], the reference static pressure traditionally established for the pressure measurements on full-scale structures by using a pressure transducer arranged inside a cabin near the location cannot play the same role as the static pressure in the wind tunnel. Consequently, this article suggests using the reference static pressure calculated from the total wind pressures measured on a point with an invariant mean wind pressure coefficient. For this new method to take place, a 1:200-scaled pressure measurement model test for a 177 m high free-standing cooling tower located in Type B ABL flow field was undertaken in the TJ-3 wind tunnel at Tongji University. The details of the test have been reported in Ref. [22], and the results of the mean wind pressure distributions measured around the tower model at different turbulence intensities are shown in Figure 5. As shown in Figure 5, the mean wind pressure coefficients do not change noticeably at different turbulence intensities at the windward region (0–60 degrees) and the leeward region (120–180 degrees); however, they significantly change at the side region (60–120 degrees). The region between 60 and 120 degrees is also called the vortex separation zone, because vortexes are formed and separated near that position. The physical phenomenon of vortex shedding has been defined as alternating vortex shedding from the cylinder and a clear “vortex trail” formed downstream. According to Niemann and Holscher [24], the free-stream turbulence strongly influences the vortex shedding phenomenon, with the flow past a circular cylinder with regard to the Strouhal number, the span-wise correlation of vortices and the mean wind pressure coefficients in the vortex separation zone. As the free-stream turbulences are different between the case Iu = 9.83% and the other cases shown in Figure 5, the mean wind pressure coefficients of the case Iu = 9.83% are noticeably different from those of the other cases in between 60 and 90 degrees in Figure 5. Moreover, the mean values and the variation ranges for the mean wind pressure coefficients measured at different turbulence intensities (Figure 5) are shown in Figure 6. According to Figure 6, the variation range is extremely small for the mean wind pressure coefficients measured at 30 degrees, suggesting that the mean wind pressure coefficients measured at 30 degrees in different wind environments are concentrated at the mean value (≈0), and 30 degrees can basically be regarded as the point with an invariant mean wind pressure coefficient, where the reference static pressure can be calculated from the total wind pressures measured.
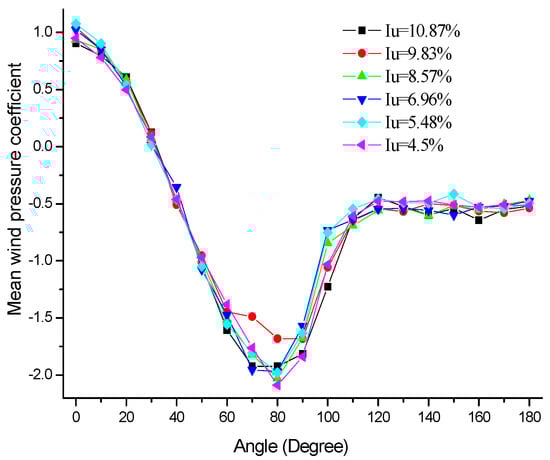
Figure 5.
Mean wind pressure distributions around the cooling tower model at different turbulence intensities.
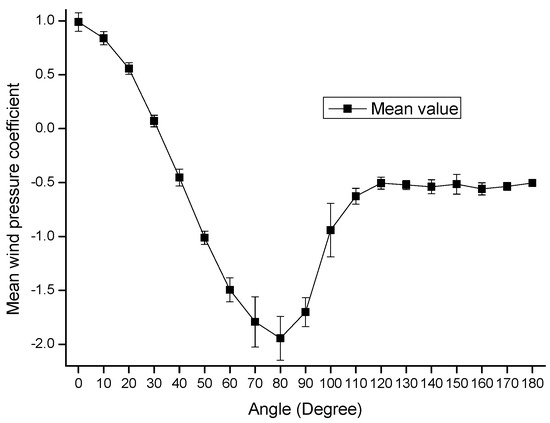
Figure 6.
Mean values and variation ranges of mean wind pressure coefficients measured around the cooling tower model at different turbulence intensities.
For the wind pressure coefficient measured at 30 degrees, Equation (1) holds:
in which Cp30° is the wind pressure coefficient measured at 30 degrees; P30° indicates the total surface wind pressure measured at 30 degrees that is positive inwards and negative outwards; P∞ indicates the reference static pressure; ρ and V refer to air density and oncoming flow velocity, respectively. Therefore, Equation (2) holds for calculating the reference static pressure:
To validate the accuracy of Equation (2), 3 cases of pressure measurements on a 183 m high free-standing cooling tower’s 1:200 rigid pressure measurement model are simulated in the TJ-3 wind tunnel with different flow fields. The turbulence intensities simulated at the measurement height are 6.96%, 5.48% and 4.5% for the 1st~3rd cases, respectively. For each case, P30° is measured at the point of 30 degrees using an electronic pressure scanning valve with a sample frequency of 312.5 Hz, P∞ is measured by means of a Pitot tube with the orientation perpendicular to the flow direction, and V is measured by the Pitot tube with the orientation along the wind direction. The differences between P30° and P∞ measured are compared with the corresponding dynamic pressures measured in Figure 7 for the three cases. As can be seen in Figure 7, for all the cases, the pressure differences are negligible compared with the corresponding dynamic pressure, indicating that , and Equation (2) holds true. Using Equation (2), the reference static pressure is calculated for use in the Peng-cheng tower measurement campaign, and the mean and the fluctuating wind pressure distributions around the throat section of the prototype Peng-cheng cooling tower are thus obtained for the present case study.
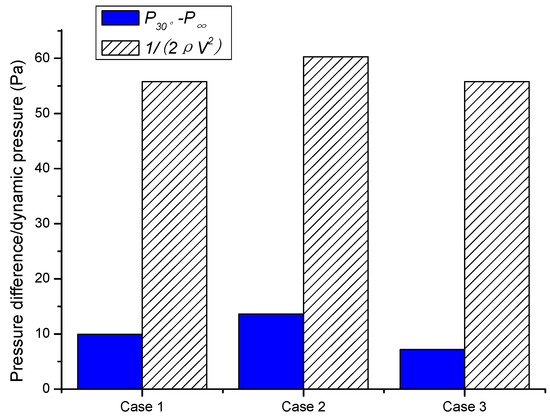
Figure 7.
Comparison between the pressure differences and the dynamic pressures for different cases.
Moreover, it should be admitted that the full-scale measurement results should be sensitive to the oncoming turbulence at the site. Therefore, the in situ anemometric data available from 29 November 2011, are analyzed using the method reported by Ref. [25], and the results are shown in Section 3.3 to make the field measurement data presented in Section 3.5 traceable.
3.3. Wind Tunnel Model Tests Using an Aero-Elastic Model of Peng-Cheng Tower
In the TJ-3 ABL wind tunnel with the dimensions of 15 m wide, 2 m high and 14 m long at Tongji University, aero-elastic model tests were carried out. Based on the Chinese standard GB/T 50102-2003 [26], the Type B ABL flow field was simulated using spires and roughness elements. Flow characteristics simulated in the TJ-3 wind tunnel are presented in Figure 8 and compared with the simulation targets (the empirical formulae obtained by generalizing large quantities of field measurement data) [27,28,29] and the flow characteristics measured on site in the Peng-cheng electric power station on 29 November 2011. As shown in Figure 8, the wind tunnel test data are close to the empirical formulae, but they are different from the full-scale measurement results for all wind characteristics. In Figure 8a, the non-dimensional power-spectral density simulated in the wind tunnel at around 1 m height, where the simulated turbulence integral scale is around 0.3 m, agrees very well with the von Karman spectrum; however, the field measurement result obtained at around 130 m height is much greater than the empirical formula and the wind tunnel test data in the low frequency range. In Figure 8b, the turbulence intensity measured in the wind tunnel is close to the empirical profile below a certain height, and it is a bit greater than the empirical result above that height; however, the empirical formula and the wind tunnel test result are both noticeably greater than the field measurement data over the full height. A similar situation holds true for the mean wind velocity profiles presented in Figure 8c. As can be seen, the wind tunnel mean wind velocity profile and the empirical curve agree very well with each other; however, they are smaller than the data measured at the engineering site of the Peng-cheng electric power station over the full height. The above observations suggest that the empirical ABL flow field can be accurately simulated in the wind tunnel using the conventional spire-roughness passive simulation method; however, the flow field simulated in the wind tunnel could still be noticeably different from the flow field at the realistic engineering site. This could probably lead to distorted wind loads measured on scaled physical models in the wind tunnel (flow characteristic effects).
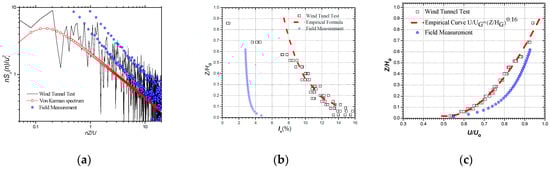
Figure 8.
Turbulent flow characteristics for a Type B ABL flow field simulated in a TJ-3 wind tunnel and measured in the field (HG and UG refer to the gradient height (275 m) and the geostrophic velocity (18.95 m/s), respectively). (a) Power spectral density of along-wind velocity; (b) Turbulence intensity profile, Empirical Formula [29]; (c) Mean wind velocity profile.
According to the method described in Ref. [19], a 1:200-scaled beam-net aero-elastic model is manufactured for the Peng-cheng cooling tower (Figure 9). The main steps of manufacturing the beam-net aero-elastic model are presented in Appendix A of this article, which were also reported earlier in Ref. [19]. According to our experiences, the most difficult step in the process of manufacturing the model is determining the initial values of the uncertain parameters X1 to X6 (see Appendix A for their definitions) for use. The method adopted by the present study for determining the initial values of these uncertain parameters for the aero-elastic model of the Peng-cheng cooling tower are presented below for reference.
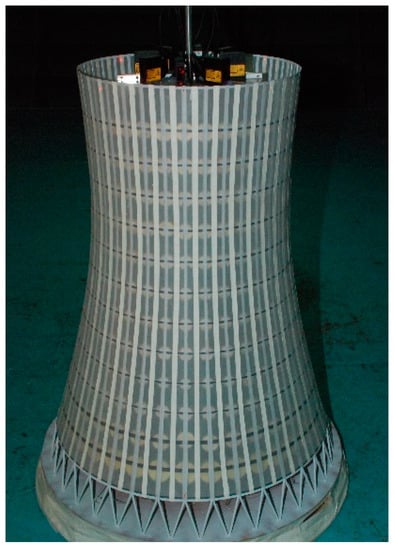
Figure 9.
Aero-elastic model of Peng-cheng cooling tower for pressure measurements.
To obtain the initial values of the uncertain parameters X1 to X6, a representative local drum section of the Peng-cheng tower at the height of around 130 m is simulated using detailed shell elements first, and its 1st~5th order dynamic characteristics are calculated accordingly (see Figure 10a,c,e,g,i). Second, a corresponding preliminary beam-net model is established using a beam element with uncertain parameters , and (see Appendix A for their definitions). Third, regarding the 1st~5th order dynamic characteristics calculated using the shell element model as the optimization targets, dynamic model updating is attempted on the beam element model by identifying the correct values of , and , and they are identified as 0.448 × 10⁻² m, 0.493 × 10⁻³ m and 0.579 × 10⁻² m, respectively. The 1st~5th order dynamic characteristics calculated using the updated beam element model are presented in Figure 10b,d,f,h,j. Fourth, (see Appendix A for their definitions) are calculated as being 5.06 MPa.m4 and 0.273 GPa.m2, respectively, for the representative local drum section. Fifth, using Equation (A1), the initial values of the uncertain parameters X1 to X6 are estimated for use as being 0.697 × 10⁻³, 0.349 × 10⁻², 0.768 × 10⁻⁴, 0.384 × 10⁻³, 0.901 × 10⁻³ and 0.450 × 10⁻², respectively.
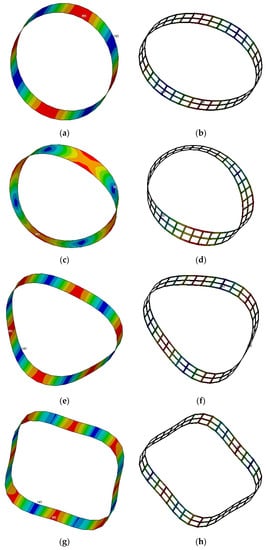
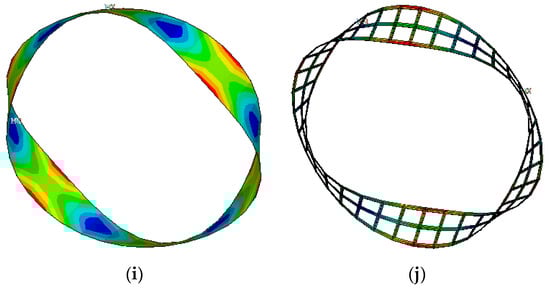
Figure 10.
1st~5th order modes calculated using the shell model and the updated beam model. (a) 1st mode for shell model (7.35 Hz); (b) 1st mode for updated beam model (7.3104 Hz); (c) 2nd mode for shell model (18.555 Hz); (d) 2nd mode for updated beam model (19.810 Hz); (e) 3rd mode for shell model (20.85 Hz); (f) 3rd mode for updated beam model (20.969 Hz); (g) 4th mode for shell model (40.17 Hz); (h) 4th mode for updated beam model (41.020 Hz); (i) 5th mode for shell model (60.255 Hz); (j) 5th mode for updated beam model (60.621 Hz).
After the aero-elastic model is manufactured following the steps presented in Appendix A, with the above-mentioned method for determining the initial values of the uncertain parameters, the low order dynamic characteristics of the aero-elastic model are measured by free vibration tests. The results measured on the model are compared with the corresponding simulation targets calculated from the FE analyses in Table 1. The relative errors between our FE model and the prototype are all within ±5%. However, most relative errors between the aero-elastic model manufactured and the prototype are in between ±5% and ±10% in Table 1. These discrepancies should be attributed to the model manufacturing error, the modal experiment error and the environmental factors in physical tests, which cannot be eliminated. We have tried to optimize the natural frequencies of the aero-elastic model by tuning the copper lead blocks arranged on it, but it is hard to reduce the relative errors to within ±5%.

Table 1.
Natural frequencies measured on the aero-elastic model.
Furthermore, it is widely acknowledged that at a high Re, the mean wind pressure distribution around a circular cylinder can be reproduced at lower values of Re with a suitable roughening of the surface of the round body. To simulate the high Re effects, several types of model surface roughness are compared, which suggests that attaching 36 uniformly distributed, three-layered, vertical paper tapes with a test wind speed of 8 m/s is the optimal approach to simulate the effects of a high Re. The mean wind pressure distribution measured on the throat section of the aero-elastic model with the high Re effects simulation coincides with the full-scale measurement data reported by the Chinese Code GB/T 50102-2003 [26]. After the physical experiment and the data processing, the mean and the fluctuating wind pressure distributions on the throat section of the aero-elastic model of the Peng-cheng cooling tower are obtained.
3.4. Wind Tunnel Model Tests Using the Rigid Model of Peng-Cheng Tower
Pressure measurement model tests using the rigid model of the Peng-cheng cooling tower were also conducted in the TJ-3 wind tunnel with the Type B ABL turbulent flow simulation. With and without a suitable roughening of the surface of the rigid model, the rigid model with and without high Re effects simulation are obtained, respectively. Through physical experiments, the mean and the fluctuating wind pressure distributions on the throat section of the rigid model of the Peng-cheng cooling tower are also measured.
3.5. Results and Comparisons
The results of the full-scale measurements and the wind tunnel model tests described above are compared in Figure 11 and Figure 12. According to Figure 11, the mean wind pressure distribution from the model test on the rigid model without high Re effects simulation is notably different from the three other distribution patterns, while the three other mean wind pressure distributions are close together. A similar situation holds true for the fluctuating wind pressure distributions presented in Figure 12 for different cases. These intuitively suggest that the Re effects are extremely significant. The Re for the full-scale scenario is generally greater than 1 × 10⁷; however, that for the wind tunnel scenario is around 5 × 10⁵. Basically, the flow separation location for the flow around a bluff body without corners is sensitive to Re. As the Re for model tests is usually two orders of magnitude smaller than the Re for the prototype flow event, significant distortions might be caused for the model test data.

Figure 11.
Mean wind pressure distributions from full-scale measurement and model tests.
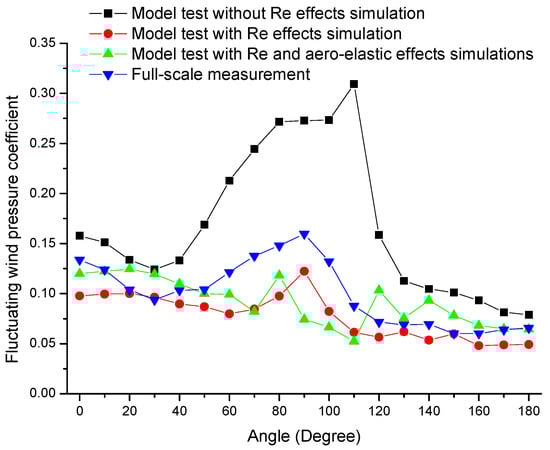
Figure 12.
Fluctuating wind pressure distributions from full-scale measurement and model tests.
Using the data presented in Figure 11 and Figure 12, the three adverse effects of the traditional ABL wind tunnel pressure measurement technique are respectively calculated and shown in Figure 13 and Figure 14. According to Figure 13 and Figure 14, the Re effects are significantly greater than the other two adverse effects, especially in the side region of the flow separation; the flow characteristic effects are not as significant as the Re effects, but it is still noticeable around the half circle of the throat section, which should be taken into account by similar pressure measurement model tests; the aero-elastic effects are negligible for the pressure measurement model tests of cooling towers. Taking a step further, the quantitative data of the three adverse effects in relative errors are compared in Table 2. Table 2 suggests that the Re effects are usually greater than 50%, the aero-elastic effects are generally no greater than 30%, and the flow characteristic effects are sometimes greater than 40%. With regard to the mean wind pressure coefficients, the average relative errors are 52.39%, 1.87% and 35.91% for the Re effects, the aero-elastic effects and the flow characteristic effects, respectively. With regard to the fluctuating wind pressure coefficients, the average relative errors are 97.58%, 21.14% and 20.20% for the Re effects, the aero-elastic effects and the flow characteristic effects, respectively. These data support the observations presented above for Figure 13 and Figure 14.
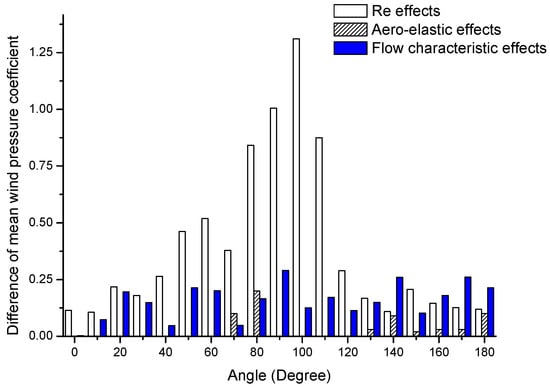
Figure 13.
Comparison of the three adverse effects for mean wind pressure coefficients.
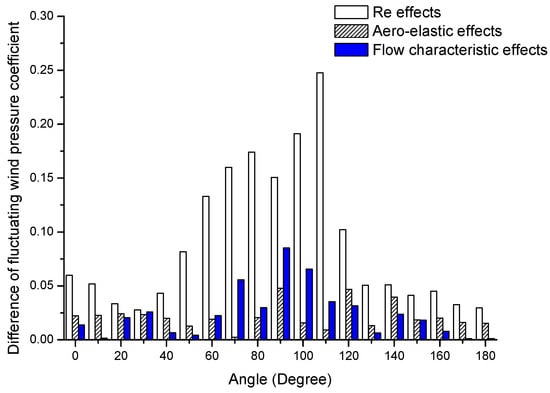
Figure 14.
Comparison of the three adverse effects for fluctuating wind pressure coefficients.
Table 2.
The three adverse effects in relative errors.
It should be noted that the above conclusions are drawn from our specific case study of a large cooling tower (a comparatively inflexible circular cylindrical shell) and, therefore, cannot be easily generalized to other structures. These conclusions are also expected due to the facts that: (1) Re effects are more pronounced for curved structures than sharp-edge structures and (2) aero-elastic effects are only relevant for flexible structures where the wind load is altered by the structural deformation. The example cooling tower in this paper will respond dynamically to the fluctuating aerodynamics, but the motions will not be sufficient to influence the aerodynamics.
4. Conclusions
The full-scale/model test comparisons performed to validate the traditional ABL wind tunnel pressure measurement technique cannot reveal the true reason for the observed inaccuracy of the technique using quantifiable data. A new research scheme for future full-scale/model test comparisons is proposed in this regard, which can reasonably separate the mingled adverse effects on the traditional ABL wind tunnel pressure measurement results. Based on a specific case study of the Peng-cheng cooling tower, the new full-scale/model test comparison suggests that: (1) as expected, Re effects are extremely significant for pressure measurement model tests of circular cylindrical structures, which can be effectively remedied by sticking paper belts on the model and adjusting the flow velocity in the wind tunnel; (2) flow characteristic effects cannot be ignored, and they can be mitigated by placing actively controlled devices in the beginning of the wind tunnel’s working section to increase the turbulence intensity and the turbulence integral scale of the simulated flow or by developing naturally grown boundary layers in large scale wind tunnels, which gives the best reproduction of the ABL characteristics; and (3) aero-elastic effects are negligible for the pressure measurement model tests of cooling towers.
According to much research, the major discrepancies between full-scale and model test data, or between wind tunnel laboratories, were inconsistencies of the reference static pressure. This technical issue is partly addressed by the present research using an innovative method of calculating the reference static pressure from the total wind pressures measured at a point with an invariant mean wind pressure coefficient for the full-scale measurement. Moreover, geometrical model precision is known to be a non-negligible source of uncertainty. Our attention should be paid to this potential cause of the observed full-scale/model test differences in the future, and the proposed research scheme will be revised accordingly.
Author Contributions
Conceptualization, X.-X.C. and L.Z.; Methodology, X.-X.C. and S.-T.K.; Formal analysis, X.-X.C.; Writing—original draft, X.-X.C.; Supervision, Y.-J.G.; Funding acquisition, L.Z. and Y.-J.G. All authors have read and agreed to the published version of the manuscript.
Funding
This research was funded by the National Natural Science Foundation of China grant number [51908124] and the China Postdoctoral Science Foundation grant number [2016M601793].
Data Availability Statement
The data presented in this study are available on request from the corresponding author.
Acknowledgments
The authors gratefully acknowledge the financial support from the National Natural Science Foundation of China (Grant No. 51908124) and the China Postdoctoral Science Foundation (Grant No. 2016M601793).
Conflicts of Interest
The author(s) declared no potential conflict of interest with respect to the research, authorship and/or publication of this article.
Appendix A
Appendix: main steps of manufacturing a beam-net aero-elastic model [19].
Main steps of manufacturing a beam-net aero-elastic model are as follows:
Step 1: The cooling tower’s dynamic characteristics should be calculated from a detailed numerical FE model established using shell elements as the simulation targets of the aero-elastic model.
Step 2: A numerical model for the beam-net aero-elastic model should be established using beam elements, in which the number of meridian sections is m and the number of circular sections is n. Due to the circular symmetry of the cooling tower, the meridian thickness and width variables are obtained as and , , respectively, and the circular thickness and width variables are obtained as and , , respectively. Thus, the number of the variables is 4 m + 2.
Step 3: Continuous components with equal thickness are used to manufacture the meridian beams for simplification. Thus, is reduced to a single variable . Then, the matrix should be calculated for the bending and the axial stiffness of the drum at different heights, respectively. Then, the mathematical formulations between the size of the beams and the stiffness of the cooling tower sections are assumed to be linear:
In Equation (A1), the number of the variable is 6 (X1 to X6). With 6 to 8 low-order modes calculated using the detailed FE model as the simulation targets and the initial values of X1 to X6 determined using the method introduced in Section 3.3, iterative optimization is implemented on the beam-net numerical model to obtain the identified values of X1 to X6 when the beam-net numerical model’s low-order modes agree with those of the detailed numerical model.
With the dimensions identified for the beam-net aero-elastic model, the physical model can then be produced using the thin galvanized sheet steels. Based on the requirements of geometric similitude, the configuration of the actual cooling tower is simulated by pasting a whole elastic and lightweight membrane tensioned on the outer surface of the steel frame. For measuring pressures on the aero-elastic model, each node of the model is equipped with a pressure tap.
References
- Marshall, R.D. A study of wind pressures on a single-family dwelling in model and full scale. J. Wind Eng. Ind. Aerodyn. 1975, 1, 177–199. [Google Scholar] [CrossRef]
- Apperley, L.; Surry, D.; Stathopoulos, T.; Davenport, A. Comparative measurements of wind pressure on a model of the full-scale experimental house at Aylesbury, England. J. Wind Eng. Ind. Aerodyn. 1979, 4, 207–228. [Google Scholar] [CrossRef]
- Dalley, S. Surface pressure spectra on a model of the Silsoe structures building and comparison with full-scale. J. Wind Eng. Ind. Aerodyn. 1996, 60, 177–187. [Google Scholar] [CrossRef]
- Pang, J.B. Observation and Wind Tunnel Simulation of Strong Wind Characteristics in Coastal and Mountainous Areas. Ph.D. Thesis, Tongji University, Shanghai, China, 2006. (In Chinese). [Google Scholar]
- Hoxey, R.; Robertson, A.; Richardson, G.; Short, J. Correction of wind-tunnel pressure coefficients for Reynolds number effect. J. Wind Eng. Ind. Aerodyn. 1997, 69, 547–555. [Google Scholar] [CrossRef]
- Richardson, G.; Hoxey, R.; Robertson, A.; Short, J. The Silsoe Structures Building: Comparisons of pressures measured at full scale and in two wind tunnels. J. Wind Eng. Ind. Aerodyn. 1997, 72, 187–197. [Google Scholar] [CrossRef]
- Hoxey, R.; Reynolds, A.; Richardson, G.; Robertson, A.; Short, J. Observations of Reynolds number sensitivity in the separated flow region on a bluff body. J. Wind Eng. Ind. Aerodyn. 1998, 73, 231–249. [Google Scholar] [CrossRef]
- Richards, P.J.; Hoxey, R.P. Flow reattachment on the roof of a 6m cube. J. Wind Eng. Ind. Aerodyn. 2006, 94, 77–99. [Google Scholar] [CrossRef]
- Song, W.; Liang, S.; Song, J.; Zou, L.; Hu, G. Investigation on wind-induced aero-elastic effects of tall buildings by wind tunnel test using a bi-axial forced vibration device. Eng. Struct. 2019, 195, 414–424. [Google Scholar] [CrossRef]
- Zou, L.; Li, F.; Song, J.; Shi, T.; Liang, S.; Mercan, O. Investigation of torsional aeroelastic effects on high-rise buildings using forced vibration wind tunnel tests. J. Wind Eng. Ind. Aerodyn. 2020, 200, 104158. [Google Scholar] [CrossRef]
- Huang, P.; Quan, Y.; Gu, M. Experimental study of aerodynamic damping of typical tall buildings. Math. Probl. Eng. 2013, 2013, 731572. [Google Scholar] [CrossRef]
- Quan, Y.; Gu, M.; Tamura, Y. Experimental evaluation of aerodynamic damping of square super high-rise buildings. Wind Struct. Int. J. 2005, 8, 309–324. [Google Scholar] [CrossRef]
- Gu, M.; Cao, H.L.; Quan, Y. Experimental study of across-wind aerodynamic damping of super high-rise buildings with aerodynamically modified square cross-sections. Struct. Des. Tall Spéc. Build. 2013, 23, 1225–1245. [Google Scholar] [CrossRef]
- Wang, L.; Fan, X.-Y.; Liang, S.-G.; Song, J.; Wang, Z.-K. Improved expression for across-wind aerodynamic damping ratios of super high-rise buildings. J. Wind Eng. Ind. Aerodyn. 2018, 176, 263–272. [Google Scholar] [CrossRef]
- Nishi, A.; Kikugawa, H.; Matsuda, Y.; Tashiro, D. Active control of turbulence for an atmospheric boundary layer model in a wind tunnel. J. Wind Eng. Ind. Aerodyn. 1999, 83, 409–419. [Google Scholar] [CrossRef]
- Cao, S.; Nishi, A.; Kikugawa, H.; Matsuda, Y. Reproduction of wind velocity history in a multiple fan wind tunnel. J. Wind Eng. Ind. Aerodyn. 2002, 90, 1719–1729. [Google Scholar] [CrossRef]
- Cui, W.; Zhao, L.; Cao, S.; Ge, Y. Generating unconventional wind flow in an actively controlled multi-fan wind tunnel. Wind Struct. 2021, 33, 115–122. [Google Scholar]
- Catarelli, R.A.; Fernández-Cabán, P.L.; Phillips, B.M.; Bridge, J.A.; Masters, F.J.; Gurley, K.R.; Prevatt, D.O. Automation and new capabilities in the university of Florida NHERI Boundary Layer Wind Tunnel. Front. Built Environ. 2020, 6, 558151. [Google Scholar] [CrossRef]
- Cao, S.S.; Ke, S.T.; Zhang, W.M.; Zhao, L.; Ge, Y.G.; Cheng, X.X. Load-response correlation-based equivalent static wind loads for large cooling towers. Adv. Struct. Eng. 2019, 22, 2464–2475. [Google Scholar] [CrossRef]
- Cheng, X.X.; Zhao, L.; Ge, Y.J.; Dong, R.; Demartino, C. Wind effects on rough-walled and smooth-walled large cooling towers. Adv. Struct. Eng. 2017, 20, 843–864. [Google Scholar] [CrossRef]
- Cheng, X.X.; Dong, J.; Peng, Y.; Zhao, L.; Ge, Y.G. Effects of free-stream turbulence on wind loads on a full-scale large cooling tower. Adv. Struct. Eng. 2017, 21, 1437–1453. [Google Scholar] [CrossRef]
- Cheng, X.X.; Ke, S.T.; Li, P.F.; Ge, Y.J.; Zhao, L. External extreme wind pressure distribution for the structural design of cooling towers. Eng. Struct. 2019, 181, 336–353. [Google Scholar] [CrossRef]
- Dalgliesh, W.A. Experience with wind pressure measurements on a full-scale building. In Proceedings of the Technical Meeting Concerning Wind Loads on Buildings and Structures, Gaithersburg, MD, USA, 27 January 1969. [Google Scholar]
- Niemann, H.J.; Holscher, N. A review of recent experiments on the flow past circular cylinders. J. Wind Eng. Ind. Aerodyn. 1990, 33, 197–209. [Google Scholar] [CrossRef]
- Cheng, X.; Zhao, L.; Ge, Y.; Wu, G. Wind effects on large cooling tower in velocity fields of different non-stationary levels. In Proceedings of the Institution of Civil Engineers–Structures and Buildings; ICE: London, UK, 2021; pp. 1–16. [Google Scholar] [CrossRef]
- GB/T 50102-2003; Code for Design of Cooling for Industrial Recirculation Water. Ministry of Construction: Beijing, China, 2003.
- Simiu, E.; Scanlan, R.H. Wind Effects on Structures; John Wiley & Sons: New York, NY, USA, 1996. [Google Scholar]
- Holmes, J.D. Wind Loading of Structures; Spon Press: London, UK, 2001. [Google Scholar]
- GB 50009-2012; Load Code for the Design of Building Structures. China Architecture & Building Press: Beijing, China, 2012. (In Chinese)


Publisher’s Note: MDPI stays neutral with regard to jurisdictional claims in published maps and institutional affiliations. |
© 2022 by the authors. Licensee MDPI, Basel, Switzerland. This article is an open access article distributed under the terms and conditions of the Creative Commons Attribution (CC BY) license (https://creativecommons.org/licenses/by/4.0/).