Next Issue
Volume 12, March
Previous Issue
Volume 12, January


Climate, Volume 12, Issue 2 (February 2024) – 15 articles

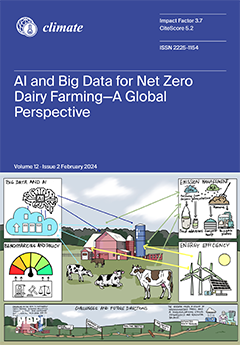
Cover Story (view full-size image): This paper explores the transformative potential of Big Data and Artificial Intelligence (AI) in advancing the dairy industry toward net zero emissions, a key goal in combating climate change. Focusing on the Canadian dairy sector, it demonstrates the global applicability of these technologies for environmental sustainability in agriculture. This study highlights the environmental challenges facing the dairy industry, particularly greenhouse gas emissions from enteric fermentation and manure management. It argues for innovative solutions due to the urgent climate crisis and delves into how Big Data and AI can revolutionize emission management in dairy farming. View this paper
  • Issues are regarded as officially published after their release is announced to the table of contents alert mailing list.
  • You may sign up for e-mail alerts to receive table of contents of newly released issues.
  • PDF is the official format for papers published in both, html and pdf forms. To view the papers in pdf format, click on the "PDF Full-text" link, and use the free Adobe Reader to open them.
Order results
Result details
Section
Select all
Export citation of selected articles as:
23 pages, 2305 KiB  
Article
Downscaling Climatic Variables at a River Basin Scale: Statistical Validation and Ensemble Projection under Climate Change Scenarios
by Renalda El-Samra, Abeer Haddad, Ibrahim Alameddine, Elie Bou-Zeid and Mutasem El-Fadel
Climate 2024, 12(2), 27; https://doi.org/10.3390/cli12020027 - 14 Feb 2024
Cited by 2 | Viewed by 2649
Abstract
Climatic statistical downscaling in arid and topographically complex river basins remains relatively lacking. To address this gap, climatic variables derived from a global climate model (GCM) ensemble were downscaled from a grid resolution of 2.5° × 2.5° down to the station level. For [...] Read more.
Climatic statistical downscaling in arid and topographically complex river basins remains relatively lacking. To address this gap, climatic variables derived from a global climate model (GCM) ensemble were downscaled from a grid resolution of 2.5° × 2.5° down to the station level. For this purpose, a combination of multiple linear and logistic regressions was developed, calibrated and validated with regard to their predictions of monthly precipitation and daily temperature in the Jordan River Basin. Seasonal standardized predictors were selected using a backward stepwise regression. The validated models were used to examine future scenarios based on GCM simulations under two Representative Concentration Pathways (RCP4.5 and RCP8.5) for the period 2006–2050. The results showed a cumulative near-surface air temperature increase of 1.54 °C and 2.11 °C and a cumulative precipitation decrease of 100 mm and 135 mm under the RCP4.5 and RCP8.5, respectively, by 2050. This pattern will inevitably add stress to water resources, increasing management challenges in the semi-arid to arid regions of the basin. Moreover, the current application highlights the potential of adopting regression-based models to downscale GCM predictions and inform future water resources management in poorly monitored arid regions at the river basin scale. Full article
(This article belongs to the Topic Numerical Models and Weather Extreme Events)
Show Figures

Figure 1

29 pages, 894 KiB  
Article
Annual Solar Geoengineering: Mitigating Yearly Global Warming Increases
by Alec Feinberg
Climate 2024, 12(2), 26; https://doi.org/10.3390/cli12020026 - 12 Feb 2024
Viewed by 3227
Abstract
Solar geoengineering (SG) solutions have many advantages compared to the difficulty of carbon dioxide removal (CDR): SG produces fast results, is shown here to have much higher efficiency than CDR, is not related to fossil fuel legislation, reduces the GHG effect including water [...] Read more.
Solar geoengineering (SG) solutions have many advantages compared to the difficulty of carbon dioxide removal (CDR): SG produces fast results, is shown here to have much higher efficiency than CDR, is not related to fossil fuel legislation, reduces the GHG effect including water vapor, and is something we all can participate in by brightening the Earth with cool roofs and roads. SG requirements detailed previously to mitigate global warming (GW) have been concerning primarily because of overwhelming goals and climate circulation issues. In this paper, annual solar geoengineering (ASG) equations and estimated requirements for yearly solar radiation modification (SRM) of areas are provided along with the advantages of annual solar geoengineering (ASG) to mitigate yearly global warming temperature increases. The ASG albedo area modification requirements found here are generally 50 to potentially more than 150 times less compared to the challenge of full SG GW albedo mitigation, reducing circulation concerns and increasing feasibility. These reductions are applied to L1 space sunshading, Earth brightening, and stratosphere aerosol injection (SAI) SRM annual area requirements. However, SAI coverage compared to other methods will have higher yearly increasing maintenance costs in the annual approach. Results also show that because ASG Earth albedo brightening area requirements are much smaller than those needed for full mitigation, there are concerns that worldwide negative SG would interfere with making positive advances for several reasons. That is, negative SG currently dominates yearly practices with the application of dark asphalt roads, roofs, and building sides. This issue is discussed. Full article
Show Figures

Figure 1

9 pages, 629 KiB  
Article
Influence of Climatic Factors on the Occurrence of Vibrio parahaemolyticus Food Poisoning in the Republic of Korea
by Jong-Gyu Kim
Climate 2024, 12(2), 25; https://doi.org/10.3390/cli12020025 - 9 Feb 2024
Viewed by 2184
Abstract
This study aimed to investigate the outbreaks and characteristics of Vibrio parahaemolyticus food poisoning in the Republic of Korea and the impact of climatic factors on the food poisoning occurrence. All data were obtained from the official statistics of the Republic of Korea [...] Read more.
This study aimed to investigate the outbreaks and characteristics of Vibrio parahaemolyticus food poisoning in the Republic of Korea and the impact of climatic factors on the food poisoning occurrence. All data were obtained from the official statistics of the Republic of Korea (2002 to 2017). A trend analysis, Pearson’s correlation analysis, and regression analysis were used to determine the relationship between the outbreaks of V. parahaemolyticus food poisoning and climatic factors. During the study period, the number of outbreaks of V. parahaemolyticus food poisoning ranked third among bacterial food poisoning. The food poisoning incidences of V. parahaemolyticus occurred mostly from July to September. The average temperature, maximum and minimum temperatures, precipitation, number of days with rainfall, and humidity showed a significant positive correlation with the number of outbreaks of V. parahaemolyticus food poisoning (p < 0.001), but daytime hours showed a negative correlation (p < 0.01). The data further indicated that minimum temperature was the most influential variable on the outbreaks of food poisoning (p < 0.01). These results indicate that the outbreaks of V. parahaemolyticus food poisoning in the Republic of Korea are associated with climatic factors, suggesting that these incidences may have been impacted by climate change, especially due to warming around the Korean peninsula. Full article
(This article belongs to the Section Climate and Environment)
Show Figures

Figure 1

12 pages, 265 KiB  
Article
Addressing the Climate Change Adaptation Gap: Key Themes and Future Directions
by Ishfaq Hussain Malik and James D. Ford
Climate 2024, 12(2), 24; https://doi.org/10.3390/cli12020024 - 8 Feb 2024
Cited by 10 | Viewed by 8076
Abstract
Climate change adaptation is a critical response to the challenges posed by climate change and is important for building resilience. Progress in adaptation efforts has been made globally, nationally, and locally through international agreements, national plans, and community-based initiatives. However, significant gaps exist [...] Read more.
Climate change adaptation is a critical response to the challenges posed by climate change and is important for building resilience. Progress in adaptation efforts has been made globally, nationally, and locally through international agreements, national plans, and community-based initiatives. However, significant gaps exist in knowledge, capacity, and finance. The Adaptation Gap Report 2023, published by the United Nations Environment Programme (UNEP), examines the status of climate change adaptation efforts globally. The report highlights the widening adaptation finance gap and the deepening climate crisis. We analyse the key themes of the report and incorporate an analysis of the wider literature and insights from COP28 to substantiate key points and identify gaps where more work is needed to develop an understanding of climate change adaptation. This paper focuses on the underfinanced and underprepared state of global climate change adaptation efforts, the widening adaptation finance gap, slow progress in adaptation, gender equality and social inclusion issues, and challenges in addressing loss and damage. We provide a way forward for climate change adaptation and offer recommendations for future actions. Full article
21 pages, 5694 KiB  
Article
Quantifying the Climate Co-Benefits of Hybrid Renewable Power Generation in Indonesia: A Multi-Regional and Technological Assessment
by Mohamed Saad Suliman, Hooman Farzaneh, Eric Zusman, Alphonce Ngila Mulumba, Puji Lestari, Didin Agustian Permadi and Nandakumar Janardhanan
Climate 2024, 12(2), 23; https://doi.org/10.3390/cli12020023 - 8 Feb 2024
Viewed by 3101
Abstract
Quantifying the co-benefits of renewable energy investments can aid policymakers in identifying technologies capable of generating significant social, economic, and environmental benefits to effectively offset mitigation costs. Although there has been a growing body of work evaluating co-benefits, few studies have compared the [...] Read more.
Quantifying the co-benefits of renewable energy investments can aid policymakers in identifying technologies capable of generating significant social, economic, and environmental benefits to effectively offset mitigation costs. Although there has been a growing body of work evaluating co-benefits, few studies have compared the potential co-benefits of several technologies across different regions in key countries. This study fills this gap by formulating a new modeling structure to assess the environmental–health–economic co-benefits of hybrid renewable energy systems (HRESs) in different parts of Indonesia. The proposed model is unique in that it incorporates various techno-economic activities to assess air quality, health, and economic benefits and then presents results as part of a cost–benefit analysis. From the intervention scenario, the modeling results show that installing 0.5 GW grid-connected solar PV, 100 MW of wind turbines, and a 100 MW biomass generator to cover a total of 1.64 million residential load units in the Bali province can avoid GHGs, PM2.5, disability-adjusted life years (DALYs), and provide health savings of 1.73 Mt/y, 289.02 t/y, 1648, and 6.16 million USD/y, respectively. In addition, it shows that the payback period is enhanced by one year, while the net present value is increased by 28%. In Jakarta, a 3 GW solar PV plant and a 100 MW biomass generator that supply 5.8 million residential load units can deliver 32,490 averted DALYs and 652.81 million USD/y of health care savings. Nationally, the contribution of renewable energy to the electricity supply mix could grow from the 2020 baseline of 18.85% to 26.93%, reducing dependence on oil and coal contribution by 5.32%. Full article
Show Figures

Figure 1

24 pages, 8376 KiB  
Article
Precipitation Anomalies and Trends Estimated via Satellite Rainfall Products in the Cananeia–Iguape Coastal System, Southeast Region of Brazil
by Jakeline Baratto, Paulo Miguel de Bodas Terassi, Nádia Gilma de Beserra de Lima and Emerson Galvani
Climate 2024, 12(2), 22; https://doi.org/10.3390/cli12020022 - 5 Feb 2024
Cited by 1 | Viewed by 2383
Abstract
The objective of this research is to select the best orbital sensor for rainfall estimates (monthly and annual scales) and to analyze the frequency and magnitude of extreme rainfall events and their trends and disruptions based on the use of satellite rainfall product [...] Read more.
The objective of this research is to select the best orbital sensor for rainfall estimates (monthly and annual scales) and to analyze the frequency and magnitude of extreme rainfall events and their trends and disruptions based on the use of satellite rainfall product data for the Cananeia–Iguape Coastal System (CICS). Data from four satellite rainfall products were used to identify the correspondence with seven points on the surface of the study area. Statistical metrics were used to identify the best satellite rainfall product. After identifying the sensor with the best performance in estimating orbital precipitation, extreme events were identified by the Standardized Precipitation Index (SPI) on a one-month (SPI-1), three-month (SPI-3), and twelve-month (SPI-12) scale. Trend and rupture detection in the time series were performed using different statistical techniques (Mann–Kendall, Pettitt, Standard Normal Homogeneity Test, or Buishand test). Among the satellite rainfall products, CHIRPS had the best measurements for the analyzed points on the surface. The year 1983 was characterized as very rainy, also marked by the occurrence of El Niño, and was marked by the rupture of the rains at all points (IDs 1, 2, 3, 4, 5, 6, and 7) analyzed in the month of June. The decrease in monthly rainfall was more significant in the months of February (at points IDs 1, 2, 3, 5, and 7) and April (IDs 1, 3, 5, and 7). Decreased rainfall may cause CICS mangrove shrinkage. These results showed the importance of studying rainfall in an area with mangroves in order to understand the dynamics of vegetation in the face of climate change. Full article
(This article belongs to the Section Weather, Events and Impacts)
Show Figures

Figure 1

20 pages, 3315 KiB  
Article
Reassessing and Extending the Composite Rainfall Record of Manchester, Northwest England: 1786–Present
by Neil Macdonald and Robert Dietz
Climate 2024, 12(2), 21; https://doi.org/10.3390/cli12020021 - 2 Feb 2024
Viewed by 2183
Abstract
A monthly composite rainfall record for the period 1786–present representative of Manchester, northwest England is presented. The 235-year record ranks as the second-longest instrumental rainfall record available for northern England, and the fifth-longest for the UK, and contributes to a growing network of [...] Read more.
A monthly composite rainfall record for the period 1786–present representative of Manchester, northwest England is presented. The 235-year record ranks as the second-longest instrumental rainfall record available for northern England, and the fifth-longest for the UK, and contributes to a growing network of long homogenous rainfall series. A composite record is constructed, extended, and homogenised, and the record is analysed in terms of annual and seasonal variability, with a focus on extreme wet/dry events. Three primary meteorological stations in Manchester, located within 2 km of one another, form the basis of the reconstruction, with other records identified for infilling and extension based on their longevity, continuity, and proximity to the primary stations. A linear regression analysis is applied to produce a continuous record, and adjustment factors are applied to ensure homogeneity. Record homogeneity is assessed via cross-comparison with long-term records from the region (Carlisle, Chatsworth House and HadNWEP), and the methods are applied to assess relative homogeneity include the double-mass curve and Standard Normal Homogeneity tests. The Manchester record is deemed to be homogenous overall but includes two periods of increased uncertainty: 1786–1819, comprising the earliest observations and greatest number of different stations, and 1883–1911, which encompasses multi-year and multi-decadal drought events of (1883–1885 and 1890–1910) as identified by other long-term meteorological studies. The analysis of the entire record reflects long-term rainfall variability with an increasing, although not significant, trend in annual rainfall observed. Seasonally, a significant increase in winter rainfall is exhibited, in keeping with patterns observed in other regional studies. Seasonal rainfall totals are found to be highly variable at the decadal timescale. Several well-documented extreme wet (e.g., autumn 2000) and dry (e.g., summer 1976) seasons are identified, including historic events (e.g., the floods of summer 1872 and drought of summer 1887) from the less-well documented eighteenth and nineteenth centuries. Full article
(This article belongs to the Special Issue The Importance of Long Climate Records)
Show Figures

Figure 1

18 pages, 3886 KiB  
Article
Extremely Cold Climate and Social Vulnerability in Alaska: Problems and Prospects
by Elena A. Grigorieva, John E. Walsh and Vladimir A. Alexeev
Climate 2024, 12(2), 20; https://doi.org/10.3390/cli12020020 - 2 Feb 2024
Cited by 1 | Viewed by 3290
Abstract
Cold exposure remains a significant public health concern, particularly in the Arctic regions prone to extremely cold weather. While the physical health impacts of cold exposure are well documented, understanding the social vulnerability aspects is crucial for effective mitigation and policy development. This [...] Read more.
Cold exposure remains a significant public health concern, particularly in the Arctic regions prone to extremely cold weather. While the physical health impacts of cold exposure are well documented, understanding the social vulnerability aspects is crucial for effective mitigation and policy development. This study investigates the multifaceted dimensions of social vulnerability in the face of cold temperatures across various communities in Alaska. Alaska, renowned for its extreme cold temperatures and harsh environmental conditions, poses unique challenges to its residents, particularly in the context of social vulnerability. Drawing on a combination of quantitative data analysis and qualitative insights, we examine the factors contributing to social vulnerability, including demographic, economic, geographic, and infrastructural elements, in terms of the Extremely Cold Social Vulnerability Index, for seven Public Health Regions in Alaska. The Universal Thermal Climate Index in two very cold categories (<−27 °C) was used to identify cold exposure. Factors such as income, housing quality, health status, and resilience of the population play crucial roles in determining an individual or community’s sensitivity to, and ability to cope with, cold temperatures. Our analysis reveals that social vulnerability in Alaska is not uniform but varies significantly among regions. The research findings highlight the importance of considering factors of both sensitivity and adaptivity in understanding and addressing social vulnerability, thereby informing the development of targeted strategies and policies to enhance the resilience of Alaskan communities. As cold temperatures are projected to continue to challenge the region, addressing social vulnerability is essential for ensuring the well-being and safety of Alaska’s diverse populations. Full article
Show Figures

Graphical abstract

26 pages, 13413 KiB  
Article
Evaluation of Bias-Corrected GCM CMIP6 Simulation of Sea Surface Temperature over the Gulf of Guinea
by Oye Ideki and Anthony R. Lupo
Climate 2024, 12(2), 19; https://doi.org/10.3390/cli12020019 - 31 Jan 2024
Cited by 1 | Viewed by 2529
Abstract
This study used an ERA5 reanalysis SST dataset re-gridded to a common grid with a 0.25° × 0.25° spatial resolution (latitude × longitude) for the historical (1940–2014) and projected (2015–2100) periods. The SST simulation under the SSP5-8.5 scenario was carried out with outputs [...] Read more.
This study used an ERA5 reanalysis SST dataset re-gridded to a common grid with a 0.25° × 0.25° spatial resolution (latitude × longitude) for the historical (1940–2014) and projected (2015–2100) periods. The SST simulation under the SSP5-8.5 scenario was carried out with outputs from eight General Circulation Models (GCMs). The bias-corrected dataset was developed using Empirical Quantile Mapping (EQM) for the historical (1940–2015) and future (2030–2100) periods while the CMIP6 model simulation was evaluated against the ERA5 monthly observed reanalysis data for temperatures over the Gulf of Guinea. Overall, the CMIP6 models’ future simulations in 2030–20100 based on the SSP5-8.5 scenario indicate that SSTs are projected, for the Gulf of Guinea, to increase by 4.61 °C, from 31 °C in the coast in 2030 to 35 °C in 2100, and 2.6 °C in the Western GOG (Sahel). The Linux-based Ncview, Ferret, and the CDO (Climate Data Operator) software packages were used to perform further data re-gridding and assess statistical functions concerning the data. In addition, ArcGIS was used to develop output maps for visualizing the spatial trends of the historical and future outputs of the GCM. The correlation coefficient (r) was used to evaluate the performance of the CMIP6 models, and the analysis showed ACCESS 0.1, CAMS CSM 0.2, CAN ESM 0.3, CMCC 0.3, and MCM 0.4, indicating that all models performed well in capturing the climatological patterns of the SSTs. The CMIP6 bias-corrected model simulations showed that increased SST warming over the GOG will be higher in the far period than the near-term climate scenario. This study affirms that the CMIP6 projections can be used for multiple assessments related to climate and hydrological impact studies and for the development of mitigation measures under a warming climate. Full article
(This article belongs to the Topic Numerical Models and Weather Extreme Events)
Show Figures

Figure 1

24 pages, 677 KiB  
Perspective
A Pathway towards Climate Services for the Agricultural Sector
by Ioannis Charalampopoulos and Fotoula Droulia
Climate 2024, 12(2), 18; https://doi.org/10.3390/cli12020018 - 31 Jan 2024
Cited by 1 | Viewed by 2567
Abstract
Climate change is already having a negative impact on many areas of human activity, affecting life globally. It is more urgent than ever to increase our adaptive capacity to respond to current and future climate change risks. Climate services refer to a specialized [...] Read more.
Climate change is already having a negative impact on many areas of human activity, affecting life globally. It is more urgent than ever to increase our adaptive capacity to respond to current and future climate change risks. Climate services refer to a specialized sector that encompasses both research and operational activities. This sector is primarily focused on interpreting and communicating knowledge and information about climate risks in a manner that is tailored to meet the specific needs of diverse user communities. Climate services offer a range of specialized outputs, including forecasts, assessments, and advisories, which enable users to make decisions that are based on an understanding of the potential impacts of climate change. The outputs of climate services are designed to help diverse user communities effectively manage risks and capitalize on opportunities arising from climate variability and change. An attempt is made to outline the fundamental elements of climate services and point out their contribution to various aspects of human activity, focusing on their essential role in the adaptability of the priority for action agricultural sector, which appears as considerably vulnerable to the change of considerably susceptible to climate conditions. This article is structured to answer basic questions about climate services in general and to show the specificities of climate services in the agricultural sector. Full article
(This article belongs to the Special Issue Climate Adaptation Ways for Smallholder Farmers)
Show Figures

Figure 1

18 pages, 284 KiB  
Article
Secondary School Students’ Perceptions and Concerns on Sustainability and Climate Change
by Raquel de Rivas, Amparo Vilches and Olga Mayoral
Climate 2024, 12(2), 17; https://doi.org/10.3390/cli12020017 - 28 Jan 2024
Cited by 3 | Viewed by 3049
Abstract
This research is framed in Education for Sustainability, aimed at promoting the inclusion of the principles and values of Sustainability in education from a holistic perspective. The study focuses on finding out the concerns and knowledge of secondary school students from Valencia (Spain), [...] Read more.
This research is framed in Education for Sustainability, aimed at promoting the inclusion of the principles and values of Sustainability in education from a holistic perspective. The study focuses on finding out the concerns and knowledge of secondary school students from Valencia (Spain), who were surveyed during the academic years 2019–2020, 2020–2021 and 2021–2022 about Sustainability and Climate Change. Examining their conceptions, initial ideas, possible shortcomings, and conceptual errors is necessary to build a teaching itinerary with the purpose of adapting and reorienting educational practice to changing situations and different social contexts. The analysis, which is part of a broader research project, focuses on studying what secondary school students know (or rather, what they do not know or are unaware of) about Sustainability and Climate Change, examining their interests and concerns. Our experimental design is based on a wide-ranging questionnaire addressed to students that also promotes initial reflections. The results show that the participating students are concerned about socio-environmental problems, particularly about Climate Change. Nevertheless, they show a limited knowledge of Sustainability. This situation must encourage the involvement of the whole educational community to achieve a greater understanding of the planetary crisis through Education for Sustainability with the final goal of ensuring an effective involvement of the younger generations who are beginning to make their own decisions. Full article
(This article belongs to the Special Issue Interactions between Climate Science and Education)
21 pages, 6269 KiB  
Article
Land-Use Optimization and Allocation for Saltwater Intrusion Regions: A Case Study in Soc Trang Province, Vietnam
by Quang Chi Truong, Thao Hong Nguyen, Vu Thanh Pham and Trung Hieu Nguyen
Climate 2024, 12(2), 16; https://doi.org/10.3390/cli12020016 - 28 Jan 2024
Viewed by 1991
Abstract
Land-use planning plays an important role in agricultural development. However, the tools used to support planners in proposing land-use planning solutions are lacking, especially when considering saltwater intrusion conditions in coastal regions. In this study, optimization is applied by analyzing land use in [...] Read more.
Land-use planning plays an important role in agricultural development. However, the tools used to support planners in proposing land-use planning solutions are lacking, especially when considering saltwater intrusion conditions in coastal regions. In this study, optimization is applied by analyzing land use in developing solutions for agricultural land-use planning, wherein a multi-objective optimization model is developed to optimize land-use area, including land-use allocation, and taking into account socioeconomic and environmental factors. The model was applied to three districts of Soc Trang province, Vietnam (Long Phu, My Xuyen, and Tran De), representing three ecological regions of salt water, brackish water, and fresh water in the Mekong Delta of Vietnam. The results are shown for the implementation of two multi-objective optimization scenarios (in terms of profit, labor, environment benefits, and risk reduction) as follows: (i) multi-objective optimization of agricultural land use until 2030 under normal conditions; (ii) optimizing agricultural land use until 2030 under climate change conditions similar to the 2016 drought and saltwater intrusion phenomenon in the Mekong Delta. The results demonstrate that the second scenario is the preferred option for implementing land-use planning thanks to the balance between good profits and minimizing economic and environmental risk. Land allocation was carried out by taking into account the factors of household economics, the influence of adjacent production types, local traffic, and canal systems to allocate areas toward ensuring optimal land use. This process, involving a combination of land-use optimization and spatial allocation, can help planners to improve the quality of agricultural land-use planning. Full article
Show Figures

Figure 1

22 pages, 3277 KiB  
Review
Net Zero Dairy Farming—Advancing Climate Goals with Big Data and Artificial Intelligence
by Suresh Neethirajan
Climate 2024, 12(2), 15; https://doi.org/10.3390/cli12020015 - 25 Jan 2024
Cited by 4 | Viewed by 5612
Abstract
This paper explores the transformative potential of Big Data and Artificial Intelligence (AI) in propelling the dairy industry toward net zero emissions, a critical objective in the global fight against climate change. Employing the Canadian dairy sector as a case study, the study [...] Read more.
This paper explores the transformative potential of Big Data and Artificial Intelligence (AI) in propelling the dairy industry toward net zero emissions, a critical objective in the global fight against climate change. Employing the Canadian dairy sector as a case study, the study extrapolates its findings to demonstrate the global applicability of these technologies in enhancing environmental sustainability across the agricultural spectrum. We begin by delineating the environmental challenges confronting the dairy industry worldwide, with an emphasis on greenhouse gas (GHG) emissions, including methane from enteric fermentation and nitrous oxide from manure management. The pressing need for innovative approaches in light of the accelerating climate crisis forms the crux of our argument. Our analysis delves into the role of Big Data and AI in revolutionizing emission management in dairy farming. This includes applications in optimizing feed efficiency, refining manure management, and improving energy utilization. Technological solutions such as predictive analytics for feed optimization, AI in herd health management, and sensor networks for real-time monitoring are thoroughly examined. Crucially, the paper addresses the wider implications of integrating these technologies in dairy farming. We discuss the development of benchmarking standards for emissions, the importance of data privacy, and the essential role of policy in promoting sustainable practices. These aspects are vital in supporting the adoption of technology, ensuring ethical use, and aligning with international climate commitments. Concluding, our comprehensive study not only suggests a pathway for the dairy industry towards environmental sustainability but also provides insights into the role of digital technologies in broader agricultural practices, aligning with global environmental sustainability efforts. Full article
Show Figures

Figure 1

16 pages, 2966 KiB  
Article
Impacts of Climate Change in Baja California Winegrape Yield
by Marilina Hernandez Garcia, María Cristina Garza-Lagler, Tereza Cavazos and Ileana Espejel
Climate 2024, 12(2), 14; https://doi.org/10.3390/cli12020014 - 25 Jan 2024
Cited by 2 | Viewed by 2646
Abstract
We analyzed climate change scenarios and their possible impacts on winegrape yield in Baja California, the leading wine producer in Mexico. Linear regression models were used to predict the current yield based on climate and economic variables. Using future projections of the climate [...] Read more.
We analyzed climate change scenarios and their possible impacts on winegrape yield in Baja California, the leading wine producer in Mexico. Linear regression models were used to predict the current yield based on climate and economic variables. Using future projections of the climate variables from two regional climate models (RegCM and RCA4), we evaluated the possible changes in yield for the Near Future (NF: 2021−2040) and Intermediate Future (IF: 2041−2060) periods under low (RCP2.6) and high (RCP8.5) greenhouse gas emissions scenarios. One regression model includes maximum and minimum temperatures (Tx and Tn) of the winegrape growing season and accumulated winter precipitation (Pre), and the other model also includes the real minimum wage and winegrape price to evaluate the operating cost paid by producers. The results show that the linear regression model with the climatic and economic variables explains 28% of the winegrape yield, and Tx and Tn had the greatest influence. The climate change scenarios show that during the winegrape growing season, these variables could increase more than 1 °C in the NF and more than 2 °C in the IF under the RCP8.5 scenario. These latter temperature changes could reduce the yield between 18% and 35% relative to the reference observed climate dataset (Livneh). However, winegrape yield is sensitive to economic factors, as the yield reduction increases at least 3% in all cases. Thus, adaptation strategies need to be implemented in the viticulture sector to reduce future impacts. Full article
(This article belongs to the Special Issue Vitivinicultural Challenges through the Climatic Change)
Show Figures

Figure 1

21 pages, 15680 KiB  
Article
Relationship between El Niño-Southern Oscillation and Atmospheric Aerosols in the Legal Amazon
by Augusto G. C. Pereira, Rafael Palácios, Paula C. R. Santos, Raimundo Vitor S. Pereira, Glauber Cirino and Breno Imbiriba
Climate 2024, 12(2), 13; https://doi.org/10.3390/cli12020013 - 23 Jan 2024
Cited by 1 | Viewed by 2699
Abstract
The El Niño-Southern Oscillation (ENSO) stands out as the most significant tropical phenomenon in terms of climatic magnitude resulting from ocean–atmosphere interaction. Due to its atmospheric teleconnection mechanism, ENSO influences various environmental variables across distinct atmospheric scales, potentially impacting the spatiotemporal distribution of [...] Read more.
The El Niño-Southern Oscillation (ENSO) stands out as the most significant tropical phenomenon in terms of climatic magnitude resulting from ocean–atmosphere interaction. Due to its atmospheric teleconnection mechanism, ENSO influences various environmental variables across distinct atmospheric scales, potentially impacting the spatiotemporal distribution of atmospheric aerosols. Within this context, this study aims to evaluate the relationship between ENSO and atmospheric aerosols across the entire Legal Amazon during the period from 2006 to 2011. Over this five-year span, four ENSO events were identified. Concurrently, an analysis of the spatiotemporal variability of aerosol optical depth (AOD) and Black Carbon radiation extinction (EAOD-BC) was conducted alongside these ENSO events, utilizing data derived from the Aerosol Robotic Network (AERONET), MERRA-2 model, and ERSSTV5. Employing the Windowed Cross-Correlation (WCC) approach, statistically significant phase lags of up to 4 to 6 months between ENSO indicators and atmospheric aerosols were observed. There was an approximate 100% increase in AOD immediately after El Niño periods, particularly during intervals encompassing the La Niña phase. The analysis of specific humidity anomaly (QA) revealed that, contrary to expectations, positive values were observed throughout most of the El Niño period. This result suggests that while there is a suppression of precipitation events during El Niño due to the subsidence of drier air masses in the Amazon, the region still exhibits positive specific humidity (Q) conditions. The interaction between aerosols and humidity is intricate. However, Q can exert influence over the microphysical and optical properties of aerosols, in addition to affecting their chemical composition and aerosol load. This influence primarily occurs through water absorption, leading to substantial alterations in radiation scattering characteristics, and thus affecting the extinction of solar radiation. Full article
(This article belongs to the Section Climate and Environment)
Show Figures

Figure 1

Previous Issue
Next Issue
Back to TopTop