Next Issue
Volume 8, September
Previous Issue
Volume 8, July


ISPRS Int. J. Geo-Inf., Volume 8, Issue 8 (August 2019) – 48 articles

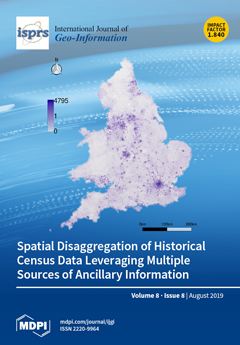
Cover Story (view full-size image): High-resolution grids, created from historical census data, can help in the study of population changes and the combined analysis of population with other variables. We propose a hybrid disaggregation technique that combines dasymetric mapping and pycnophylactic interpolation, leveraging different types of ancillary variables in order to disaggregate historical census data into a 200 m grid. We report on experiments with data from three national censuses from around 1900, in Great Britain, Belgium, and the Netherlands. Our method outperforms simpler schemes based on mass-preserving areal weighting or pycnophylactic interpolation. The best results were obtained using modern regression methods (i.e., gradient tree boosting or convolutional neural networks, depending on the case study), which were previously only seldom used for spatial data disaggregation. View this paper.
  • Issues are regarded as officially published after their release is announced to the table of contents alert mailing list.
  • You may sign up for e-mail alerts to receive table of contents of newly released issues.
  • PDF is the official format for papers published in both, html and pdf forms. To view the papers in pdf format, click on the "PDF Full-text" link, and use the free Adobe Reader to open them.
Order results
Result details
Select all
Export citation of selected articles as:
22 pages, 20829 KiB  
Article
User Evaluation of Map-Based Visual Analytic Tools
by Stanislav Popelka, Lukáš Herman, Tomas Řezník, Michaela Pařilová, Karel Jedlička, Jiří Bouchal, Michal Kepka and Karel Charvát
ISPRS Int. J. Geo-Inf. 2019, 8(8), 363; https://doi.org/10.3390/ijgi8080363 - 20 Aug 2019
Cited by 13 | Viewed by 6376
Abstract
Big data have also become a big challenge for cartographers, as the majority of big data may be localized. The use of visual analytics tools, as well as comprising interactive maps, stimulates inter-disciplinary actors to explore new ideas and decision-making methods. This paper [...] Read more.
Big data have also become a big challenge for cartographers, as the majority of big data may be localized. The use of visual analytics tools, as well as comprising interactive maps, stimulates inter-disciplinary actors to explore new ideas and decision-making methods. This paper deals with the evaluation of three map-based visual analytics tools by means of the eye-tracking method. The conceptual part of the paper begins with an analysis of the state-of-the-art and ends with the design of proof-of-concept experiments. The verification part consists of the design, composition, and realization of the conducted eye-tracking experiment, in which three map-based visual analytics tools were tested in terms of user-friendliness. A set of recommendations on GUI (graphical user interface) design and interactive functionality for map makers is formulated on the basis of the discovered errors and shortcomings in the assessed stimuli. The results of the verification were used as inputs for improving the three tested map-based visual analytics tools and might serve as a best practice for map-based visual analytics tools in general, as well as for improving the policy making cycle as elaborated by the European project PoliVisu (Policy Development based on Advanced Geospatial Data Analytics and Visualization). Full article
(This article belongs to the Special Issue Smart Cartography for Big Data Solutions)
Show Figures

Figure 1

17 pages, 2292 KiB  
Article
Expressing History through a Geo-Spatial Ontology
by Humphrey Southall and Paula Aucott
ISPRS Int. J. Geo-Inf. 2019, 8(8), 362; https://doi.org/10.3390/ijgi8080362 - 20 Aug 2019
Cited by 3 | Viewed by 5200
Abstract
Conventional Geographical Information Systems (GIS) software struggles to represent uncertain and contested historical knowledge. An ontology, meaning a semantic structure defining named entities, and explicit and typed relationships, can be constructed in the absence of locational data, and spatial objects can be attached [...] Read more.
Conventional Geographical Information Systems (GIS) software struggles to represent uncertain and contested historical knowledge. An ontology, meaning a semantic structure defining named entities, and explicit and typed relationships, can be constructed in the absence of locational data, and spatial objects can be attached to this structure if and when they become available. We describe the overall architecture of the Great Britain Historical GIS, and the PastPlace Administrative Unit Ontology that forms its core. Then, we show how particular historical geographies can be represented within this architecture through two case studies, both emphasizing entity definition and especially the application of a multi-level typology, in which each “unit” has an unchanging “type” but also a time-variant “status”. The first includes the linked systems of Poor Law unions and registration districts in 19th century England and Wales, in which most but not all unions and districts were coterminous. The second case study includes the international system of nation-states, in which most units do not appear from nothing, but rather gain or lose independence. We show that a relatively simple data model is able to represent much historical complexity. Full article
(This article belongs to the Special Issue Historical GIS and Digital Humanities)
Show Figures

Figure 1

18 pages, 9091 KiB  
Article
Utilizing A Game Engine for Interactive 3D Topographic Data Visualization
by Dany Laksono and Trias Aditya
ISPRS Int. J. Geo-Inf. 2019, 8(8), 361; https://doi.org/10.3390/ijgi8080361 - 15 Aug 2019
Cited by 49 | Viewed by 12126
Abstract
Developers have long used game engines for visualizing virtual worlds for players to explore. However, using real-world data in a game engine is always a challenging task, since most game engines have very little support for geospatial data. This paper presents our findings [...] Read more.
Developers have long used game engines for visualizing virtual worlds for players to explore. However, using real-world data in a game engine is always a challenging task, since most game engines have very little support for geospatial data. This paper presents our findings from exploring the Unity3D game engine for visualizing large-scale topographic data from mixed sources of terrestrial laser scanner models and topographic map data. Level of detail (LOD) 3 3D models of two buildings of the Universitas Gadjah Mada campus were obtained using a terrestrial laser scanner converted into the FBX format. Mapbox for Unity was used to provide georeferencing support for the 3D model. Unity3D also used road and place name layers via Mapbox for Unity based on OpenStreetMap (OSM) data. LOD1 buildings were modeled from topographic map data using Mapbox, and 3D models from the terrestrial laser scanner replaced two of these buildings. Building information and attributes, as well as visual appearances, were added to 3D features. The Unity3D game engine provides a rich set of libraries and assets for user interactions, and custom C# scripts were used to provide a bird’s-eye-view mode of 3D zoom, pan, and orbital display. In addition to basic 3D navigation tools, a first-person view of the scene was utilized to enable users to gain a walk-through experience while virtually inspecting the objects on the ground. For a fly-through experience, a drone view was offered to help users inspect objects from the air. The result was a multiplatform 3D visualization capable of displaying 3D models in LOD3, as well as providing user interfaces for exploring the scene using “on the ground” and “from the air” types of first person view interactions. Using the Unity3D game engine to visualize mixed sources of topographic data creates many opportunities to optimize large-scale topographic data use. Full article
(This article belongs to the Special Issue Gaming and Geospatial Information)
Show Figures

Graphical abstract

26 pages, 11055 KiB  
Article
Multifaceted Geometric Assessment towards Simplified Urban Surfaces Built by 3D Reconstruction
by Sheng’en Liu, Hui Yi, Xiangning Chen, Decheng Wang and Wei Jin
ISPRS Int. J. Geo-Inf. 2019, 8(8), 360; https://doi.org/10.3390/ijgi8080360 - 14 Aug 2019
Viewed by 2891
Abstract
Large-scale three-dimensional (3D) reconstruction from multi-view images is used to generate 3D mesh surfaces, which are usually built for urban areas and are widely applied in many research hotspots, such as smart cities. Their simplification is a significant step for 3D roaming, pattern [...] Read more.
Large-scale three-dimensional (3D) reconstruction from multi-view images is used to generate 3D mesh surfaces, which are usually built for urban areas and are widely applied in many research hotspots, such as smart cities. Their simplification is a significant step for 3D roaming, pattern recognition, and other research fields. The simplification quality has been assessed in several studies. On the one hand, almost all studies on surface simplification have measured simplification errors using the surface comparison tool Metro, which does not preserve sufficient detail. On the other hand, the reconstruction precision of urban surfaces varies as a result of homogeneity or heterogeneity. Therefore, it is difficult to assess simplification quality without surface classification. These difficulties are addressed in this study by first classifying urban surfaces into planar surfaces, detailed surfaces, and urban frameworks according to the simplification errors of different types of surfaces and then measuring these errors after sampling. A series of assessment indexes are also provided to contribute to the advancement of simplification algorithms. Full article
Show Figures

Figure 1

16 pages, 10260 KiB  
Article
Spatiotemporal Change Analysis of Earthquake Emergency Information Based on Microblog Data: A Case Study of the “8.8” Jiuzhaigou Earthquake
by Ziyao Xing, Xiaohui Su, Junming Liu, Wei Su and Xiaodong Zhang
ISPRS Int. J. Geo-Inf. 2019, 8(8), 359; https://doi.org/10.3390/ijgi8080359 - 13 Aug 2019
Cited by 14 | Viewed by 3964
Abstract
Information from social media microblogging has been applied to management of emergency situations following disasters. In particular, such blogs contain much information about the public perception of disasters. However, the effective collection and use of disaster information from microblogs still presents a significant [...] Read more.
Information from social media microblogging has been applied to management of emergency situations following disasters. In particular, such blogs contain much information about the public perception of disasters. However, the effective collection and use of disaster information from microblogs still presents a significant challenge. In this paper, a spatial distribution detection method is established using emergency information based on the urgency degree grading of microblogs and spatial autocorrelation analysis. Moreover, a character-level convolutional neural network classifier is applied for microblog classification in order to mine the spatio-temporal change process of emergency rescue information. The results from the Jiuzhaigou (Sichuan, China) earthquake case study demonstrate that different emergency information types exhibit different time variation characteristics. Moreover, spatial autocorrelation analysis based on the degree of text urgency can exclude uneven spatial distribution influences of the number of microblog users, and accurately determine the level of urgency of the situation. In addition, the classification and spatio-temporal analysis methods combined in this study can effectively mine the required emergency information, allowing us to understand emergency information spatio-temporal changes. Our study can be used as a reference for microblog information applications within the field of emergency rescue activity. Full article
(This article belongs to the Special Issue Geomatics and Geo-Information in Earthquake Studies)
Show Figures

Figure 1

13 pages, 23869 KiB  
Article
Assessing the Intensity of the Population Affected by a Complex Natural Disaster Using Social Media Data
by Changxiu Cheng, Ting Zhang, Kai Su, Peichao Gao and Shi Shen
ISPRS Int. J. Geo-Inf. 2019, 8(8), 358; https://doi.org/10.3390/ijgi8080358 - 13 Aug 2019
Cited by 20 | Viewed by 5020
Abstract
Complex natural disasters often cause people to suffer hardships, and they can cause a large number of casualties. A population that has been affected by a natural disaster is at high risk and desperately in need of help. Even with the timely assessment [...] Read more.
Complex natural disasters often cause people to suffer hardships, and they can cause a large number of casualties. A population that has been affected by a natural disaster is at high risk and desperately in need of help. Even with the timely assessment and knowledge of the degree that natural disasters affect populations, challenges arise during emergency response in the aftermath of a natural disaster. This paper proposes an approach to assessing the near-real-time intensity of the affected population using social media data. Because of its fatal impact on the Philippines, Typhoon Haiyan was selected as a case study. The results show that the normalized affected population index (NAPI) has a significant ability to indicate the affected population intensity. With the geographic information of disasters, more accurate and relevant disaster relief information can be extracted from social media data. The method proposed in this paper will benefit disaster relief operations and decision-making, which can be executed in a timely manner. Full article
(This article belongs to the Special Issue Geographic Complexity: Concepts, Theories, and Practices)
Show Figures

Graphical abstract

9 pages, 1053 KiB  
Article
Planning Sustainable Economic Development in the Russian Arctic
by Alexander Evseev, Tatiana Krasovskaya, Vladimir Tikunov and Irina Tikunova
ISPRS Int. J. Geo-Inf. 2019, 8(8), 357; https://doi.org/10.3390/ijgi8080357 - 13 Aug 2019
Cited by 7 | Viewed by 4372
Abstract
Recent federal documents devoted to the Arctic zone economic development highlighted eight basic areas—future innovative centers of regional development. Totally 150 investment projects are planned by 2030, where 48% are designated for mineral resources extraction, 16%—for transport development, 7%—for geological survey, 2%—for environment [...] Read more.
Recent federal documents devoted to the Arctic zone economic development highlighted eight basic areas—future innovative centers of regional development. Totally 150 investment projects are planned by 2030, where 48% are designated for mineral resources extraction, 16%—for transport development, 7%—for geological survey, 2%—for environment safety protection etc. At the same time, these ambitious plans should meet green economy goals. This means that territorial planning will have to consider at least three spatially differentiated issues: Socio-economic, ecological and environmental (nature hazards, climatic changes etc.). Thus, the initial stage of territorial planning for economic development needs evaluation of different spatial combinations of these issues. This research presents an algorithm for evaluation of joint impact of basic regional components, characterizing “nature-population-economy” interrelations in order to reveal their spatial differences and demonstrate options and risks for future sustainable development of the Russian Arctic. Basic research methods included system analysis with GIS tools. Accumulated data were arranged in three blocks which included principle regional factors which control sustainable development. In order to find different patterns of sustainability provided by these factors pair assessments of ecological/economic, environmental/economic and ecological/environmental data was done. Independent variable-environmental factors offered different spatial natural patterns either promoting or hampering economic development. It was impossible to assess jointly all three blocks data because the discussed framework of regional sustainability factors attributed to spatial regional system, which demonstrated its panarchy character. Ranking results were visualized in a map where the selected pair groups were shown for each basic territory of advanced development. Visualization of proportional correlation of social, economic and ecological factors was achieved using color triangle method (RGB). Full article
Show Figures

Graphical abstract

17 pages, 5460 KiB  
Article
Geospatial Disaggregation of Population Data in Supporting SDG Assessments: A Case Study from Deqing County, China
by Yue Qiu, Xuesheng Zhao, Deqin Fan and Songnian Li
ISPRS Int. J. Geo-Inf. 2019, 8(8), 356; https://doi.org/10.3390/ijgi8080356 - 13 Aug 2019
Cited by 17 | Viewed by 4814
Abstract
Quantitative assessments and dynamic monitoring of indicators based on fine-scale population data are necessary to support the implementation of the United Nations (UN) 2030 Agenda and to comprehensively achieve its 17 Sustainable Development Goals (SDGs). However, most population data are collected by administrative [...] Read more.
Quantitative assessments and dynamic monitoring of indicators based on fine-scale population data are necessary to support the implementation of the United Nations (UN) 2030 Agenda and to comprehensively achieve its 17 Sustainable Development Goals (SDGs). However, most population data are collected by administrative units, and it is difficult to reflect true distribution and uniformity in space. To solve this problem, based on fine building information, a geospatial disaggregation method of population data for supporting SDG assessments is presented in this paper. First, Deqing County in China, which was divided into residential areas and nonresidential areas according to the idea of dasymetric mapping, was selected as the study area. Then, the town administrative areas were taken as control units, building area and number of floors were used as weighting factors to establish the disaggregation model, and population data with a resolution of 30 m in Deqing County in 2016 were obtained. After analyzing the statistical population of 160 villages and the disaggregation results, we found that the global average accuracy was 87.08%. Finally, by using the disaggregation population data, indicators 3.8.1, 4.a.1, and 9.1.1 were selected to conduct an accessibility analysis and a buffer analysis in a quantitative assessment of the SDGs. The results showed that the SDG measurement and assessment results based on the disaggregated population data were more accurate and effective than the results obtained using the traditional method. Full article
Show Figures

Figure 1

18 pages, 3320 KiB  
Article
An Attention-Based Spatiotemporal Gated Recurrent Unit Network for Point-of-Interest Recommendation
by Chunyang Liu, Jiping Liu, Jian Wang, Shenghua Xu, Houzeng Han and Yang Chen
ISPRS Int. J. Geo-Inf. 2019, 8(8), 355; https://doi.org/10.3390/ijgi8080355 - 13 Aug 2019
Cited by 24 | Viewed by 4861
Abstract
Point-of-interest (POI) recommendation is one of the fundamental tasks for location-based social networks (LBSNs). Some existing methods are mostly based on collaborative filtering (CF), Markov chain (MC) and recurrent neural network (RNN). However, it is difficult to capture dynamic user’s preferences using CF [...] Read more.
Point-of-interest (POI) recommendation is one of the fundamental tasks for location-based social networks (LBSNs). Some existing methods are mostly based on collaborative filtering (CF), Markov chain (MC) and recurrent neural network (RNN). However, it is difficult to capture dynamic user’s preferences using CF based methods. MC based methods suffer from strong independence assumptions. RNN based methods are still in the early stage of incorporating spatiotemporal context information, and the user’s main behavioral intention in the current sequence is not emphasized. To solve these problems, we proposed an attention-based spatiotemporal gated recurrent unit (ATST-GRU) network model for POI recommendation in this paper. We first designed a novel variant of GRU, which acquired the user’s sequential preference and spatiotemporal preference by feeding the continuous geographical distance and time interval information into the GRU network in each time step. Then, we integrated an attention model into our network, which is a personalized process and can capture the user’s main behavioral intention in the user’s check-in history. Moreover, we conducted an extensive performance evaluation on two real-world datasets: Foursquare and Gowalla. The experimental results demonstrated that the proposed ATST-GRU network outperforms the existing state-of-the-art POI recommendation methods significantly regarding two commonly-used evaluation metrics. Full article
Show Figures

Figure 1

14 pages, 1939 KiB  
Case Report
Lessons Learned from the NOAA CoastWatch Ocean Satellite Course Developed for Integrating Oceanographic Satellite Data into Operational Use
by Cara Wilson and Dale H. Robinson
ISPRS Int. J. Geo-Inf. 2019, 8(8), 354; https://doi.org/10.3390/ijgi8080354 - 10 Aug 2019
Cited by 5 | Viewed by 3401
Abstract
Satellite data are underutilized in many branches of operational oceanography. Users outside of the satellite community often encounter difficulty in discovering the types of satellite measurements that are available, and determining which satellite products are best for operational activities. In addition, the large [...] Read more.
Satellite data are underutilized in many branches of operational oceanography. Users outside of the satellite community often encounter difficulty in discovering the types of satellite measurements that are available, and determining which satellite products are best for operational activities. In addition, the large choice of satellite data providers, each with their own data access protocols and formats, can make data access challenging. The mission of the NOAA CoastWatch Program is to make ocean satellite data easier to access and to apply to operational uses. As part of this mission, the West Coast Node of CoastWatch developed the NOAA Ocean Satellite Course, which introduces scientists and resource managers to ocean satellite products, and provides them tools to facilitate data access when using common analysis software. These tools leverage the data services provided by ERDDAP, a data distribution system designed to make data access easier via a graphical user interface and via machine-to-machine connections. The course has been offered annually since 2006 and has been attended by over 350 participants. Results of post-course surveys are analyzed to measure course effectiveness. The lessons learned from conducting these courses include using the preferred software of the course participants, providing easy access to datasets that are appropriate (fit for purpose) for operation applications, developing tools that address common tasks of the target audience, and minimizing the financial barriers to attend the course. Full article
(This article belongs to the Special Issue Education and Training in Applied Remote Sensing)
Show Figures

Figure 1

31 pages, 3123 KiB  
Article
Mapping Spatiotemporal Data to RDF: A SPARQL Endpoint for Brussels
by Alejandro Vaisman and Kevin Chentout
ISPRS Int. J. Geo-Inf. 2019, 8(8), 353; https://doi.org/10.3390/ijgi8080353 - 10 Aug 2019
Cited by 7 | Viewed by 4217
Abstract
This paper describes how a platform for publishing and querying linked open data for the Brussels Capital region in Belgium is built. Data are provided as relational tables or XML documents and are mapped into the RDF data model using R2RML, a standard [...] Read more.
This paper describes how a platform for publishing and querying linked open data for the Brussels Capital region in Belgium is built. Data are provided as relational tables or XML documents and are mapped into the RDF data model using R2RML, a standard language that allows defining customized mappings from relational databases to RDF datasets. In this work, data are spatiotemporal in nature; therefore, R2RML must be adapted to allow producing spatiotemporal Linked Open Data.Data generated in this way are used to populate a SPARQL endpoint, where queries are submitted and the result can be displayed on a map. This endpoint is implemented using Strabon, a spatiotemporal RDF triple store built by extending the RDF store Sesame. The first part of the paper describes how R2RML is adapted to allow producing spatial RDF data and to support XML data sources. These techniques are then used to map data about cultural events and public transport in Brussels into RDF. Spatial data are stored in the form of stRDF triples, the format required by Strabon. In addition, the endpoint is enriched with external data obtained from the Linked Open Data Cloud, from sites like DBpedia, Geonames, and LinkedGeoData, to provide context for analysis. The second part of the paper shows, through a comprehensive set of the spatial extension to SPARQL (stSPARQL) queries, how the endpoint can be exploited. Full article
(This article belongs to the Special Issue Geospatial Data Warehousing and Decision Support)
Show Figures

Figure 1

23 pages, 5479 KiB  
Article
A Study on a Matching Algorithm for Urban Underground Pipelines
by Shuai Wang, Qingsheng Guo, Xinglin Xu and Yuwu Xie
ISPRS Int. J. Geo-Inf. 2019, 8(8), 352; https://doi.org/10.3390/ijgi8080352 - 10 Aug 2019
Cited by 5 | Viewed by 3070
Abstract
Urban underground pipelines are known as “urban blood vessels”. To detect changes in integrated pipelines and professional pipelines, the matching of same-name spatial objects is critical. Existing algorithms used for vector network matching were analyzed to develop an improved matching algorithm that can [...] Read more.
Urban underground pipelines are known as “urban blood vessels”. To detect changes in integrated pipelines and professional pipelines, the matching of same-name spatial objects is critical. Existing algorithms used for vector network matching were analyzed to develop an improved matching algorithm that can adapt to underground pipeline networks. Our algorithm improves the holistic matching of pipeline strokes, and also a partial matching algorithm is provided. In this study, appropriate geometric measures were selected to calculate the geometric similarity between pipeline strokes in their holistic matching. Existing methods for evaluating similarities in spatial scene structures in partial underground pipeline networks were improved. A method of partial matching of strokes was additionally investigated, and it compensates for the deficiencies of holistic stroke matching. Experiments showed that the matching performance was good, and the operation efficiency was high. Full article
Show Figures

Figure 1

13 pages, 41711 KiB  
Article
Comparison of FOSS4G Supported Equal-Area Projections Using Discrete Distortion Indicatrices
by Luís Moreira de Sousa, Laura Poggio and Bas Kempen
ISPRS Int. J. Geo-Inf. 2019, 8(8), 351; https://doi.org/10.3390/ijgi8080351 - 9 Aug 2019
Cited by 10 | Viewed by 5710
Abstract
This study compares the performance of five popular equal-area projections supported by Free and Open Source Software for Geo-spatial (FOSS4G)—Sinusoidal, Mollweide, Hammer, Eckert IV and Homolosine. A set of 21,872 discrete distortion vindicatrices were positioned on the ellipsoid surface, centred on the cells [...] Read more.
This study compares the performance of five popular equal-area projections supported by Free and Open Source Software for Geo-spatial (FOSS4G)—Sinusoidal, Mollweide, Hammer, Eckert IV and Homolosine. A set of 21,872 discrete distortion vindicatrices were positioned on the ellipsoid surface, centred on the cells of a Snyder icosahedral equal-area grid. These indicatrices were projected on the plane and the resulting angular and distance distortions computed, all using FOSS4G. The Homolosine is the only projection that manages to minimise angular and distance distortions simultaneously. It yields the lowest distortions among this set of projections and clearly outclasses when only land masses are considered. These results also indicate the Sinusoidal and Hammer projections to be largely outdated, imposing too large distortions to be useful. In contrast, the Mollweide and Eckert IV projections present trade-offs between visual expression and accuracy that are worth considering. However, for the purposes of storing and analysing big spatial data with FOSS4G the superior performance of the Homolosine projection makes its choice difficult to avoid. Full article
(This article belongs to the Special Issue Open Science in the Geospatial Domain)
Show Figures

Figure 1

14 pages, 2697 KiB  
Article
Education and Training in Applied Remote Sensing in Africa: The ARCSSTE-E Experience
by Ganiyu Agbaje, Omowumi Alabi and Etim Offiong
ISPRS Int. J. Geo-Inf. 2019, 8(8), 350; https://doi.org/10.3390/ijgi8080350 - 2 Aug 2019
Cited by 3 | Viewed by 4638
Abstract
In Africa, there is growing knowledge regarding the use of data obtained by remote sensing and analysed while using Geographic Information Systems for solving myriad problems. The awareness has largely arisen through the efforts of the Programme on Space Applications (PSA) of the [...] Read more.
In Africa, there is growing knowledge regarding the use of data obtained by remote sensing and analysed while using Geographic Information Systems for solving myriad problems. The awareness has largely arisen through the efforts of the Programme on Space Applications (PSA) of the United Nations Office for Outer Space Affairs (UNOOSA), and the subsequent UN resolutions for the establishment of Regional Centres for Space Science and Technology Education, to train scientists and researchers in different thematic areas of space, including Remote Sensing/Geographic Information Systems (RS/GIS). The African Regional Centre for Space Science and Technology Education in English (ARCSSTE-E) is one of these regional centres. The Centre has successfully trained 474 professionals from 18 countries since its inception in 1998; about 14% of these trainees have been female. This paper highlights the training programmes of ARCSSTE-E from its inception, and discusses the potential areas of improvement with a focus on the RS/GIS area. In 2019, a survey was conducted on alumni of the Postgraduate Diploma (PGD) programme of ARCSSTE-E. Based on the analysis of their responses and the progression of the PGD programme to a new Masters programme in RS/GIS at the university, there is clear evidence regarding the impact of the UNOOSA-assisted capacity building programme on the work and career of alumni, which has already produced an appreciable number of trained personnel in developing countries in Africa. Full article
(This article belongs to the Special Issue Education and Training in Applied Remote Sensing)
Show Figures

Figure 1

15 pages, 2453 KiB  
Article
Modeling Housing Rent in the Atlanta Metropolitan Area Using Textual Information and Deep Learning
by Xiaolu Zhou, Weitian Tong and Dongying Li
ISPRS Int. J. Geo-Inf. 2019, 8(8), 349; https://doi.org/10.3390/ijgi8080349 - 2 Aug 2019
Cited by 17 | Viewed by 5284
Abstract
The rental housing market plays a critical role in the United States real estate market. In addition, rent changes are also indicators of urban transformation and social phenomena. However, traditional data sources for market rent prediction are often inaccurate or inadequate at covering [...] Read more.
The rental housing market plays a critical role in the United States real estate market. In addition, rent changes are also indicators of urban transformation and social phenomena. However, traditional data sources for market rent prediction are often inaccurate or inadequate at covering large geographies. With the development of housing information exchange platforms such as Craigslist, user-generated rental listings now provide big data that cover wide geographies and are rich in textual information. Given the importance of rent prediction in urban studies, this study aims to develop and evaluate models of rental market dynamics using deep learning approaches on spatial and textual data from Craigslist rental listings. We tested a number of machine learning and deep learning models (e.g., convolutional neural network, recurrent neural network) for the prediction of rental prices based on data collected from Atlanta, GA, USA. With textual information alone, deep learning models achieved an average root mean square error (RMSE) of 288.4 and mean absolute error (MAE) of 196.8. When combining textual information with location and housing attributes, the integrated model achieved an average RMSE of 227.9 and MAE of 145.4. These approaches can be applied to assess the market value of rental properties, and the prediction results can be used as indicators of a variety of urban phenomena and provide practical references for home owners and renters. Full article
Show Figures

Figure 1

16 pages, 3596 KiB  
Review
Performance Testing on Marker Clustering and Heatmap Visualization Techniques: A Comparative Study on JavaScript Mapping Libraries
by Rostislav Netek, Jan Brus and Ondrej Tomecka
ISPRS Int. J. Geo-Inf. 2019, 8(8), 348; https://doi.org/10.3390/ijgi8080348 - 1 Aug 2019
Cited by 27 | Viewed by 7281
Abstract
We are now generating exponentially more data from more sources than a few years ago. Big data, an already familiar term, has been generally defined as a massive volume of structured, semi-structured, and/or unstructured data, which may not be effectively managed and processed [...] Read more.
We are now generating exponentially more data from more sources than a few years ago. Big data, an already familiar term, has been generally defined as a massive volume of structured, semi-structured, and/or unstructured data, which may not be effectively managed and processed using traditional databases and software techniques. It could be problematic to visualize easily and quickly a large amount of data via an Internet platform. From this perspective, the main aim of the paper is to test point data visualization possibilities of selected JavaScript Mapping Libraries to measure their performance and ability to cope with a big amount of data. Nine datasets containing 10,000 to 3,000,000 points were generated from the Nature Conservation Database. Five libraries for marker clustering and two libraries for heatmap visualization were analyzed. Loading time and the ability to visualize large data sets were compared for each dataset and each library. The best-evaluated library was a Mapbox GL JS (Graphics Library JavaScript) with the highest overall performance. Some of the tested libraries were not able to handle the desired amount of data. In general, an amount of less than 100,000 points was indicated as the threshold for implementation without a noticeable slowdown in performance. Their usage can be a limiting factor for point data visualization in such a dynamic environment as we live nowadays. Full article
(This article belongs to the Special Issue Smart Cartography for Big Data Solutions)
Show Figures

Figure 1

17 pages, 975 KiB  
Article
Incorporating Topological Representation in 3D City Models
by Stelios Vitalis, Ken Arroyo Ohori and Jantien Stoter
ISPRS Int. J. Geo-Inf. 2019, 8(8), 347; https://doi.org/10.3390/ijgi8080347 - 1 Aug 2019
Cited by 14 | Viewed by 4584
Abstract
3D city models are being extensively used in applications such as evacuation scenarios and energy consumption estimation. The main standard for 3D city models is the CityGML data model which can be encoded through the CityJSON data format. CityGML and CityJSON use polygonal [...] Read more.
3D city models are being extensively used in applications such as evacuation scenarios and energy consumption estimation. The main standard for 3D city models is the CityGML data model which can be encoded through the CityJSON data format. CityGML and CityJSON use polygonal modelling in order to represent geometries. True topological data structures have proven to be more computationally efficient for geometric analysis compared to polygonal modelling. In a previous study, we have introduced a method to topologically reconstruct CityGML models while maintaining the semantic information of the dataset, based solely on the combinatorial map (C-Map) data structure. As a result of the limitations of C-Map’s semantic representation mechanism, the resulting datasets could suffer either from semantic information loss or the redundant repetition of them. In this article, we propose a solution for a more efficient representation of geometry, topology and semantics by incorporating the C-Map data structure into the CityGML data model and implementing a CityJSON extension to encode the C-Map data. In addition, we provide an algorithm for the topological reconstruction of CityJSON datasets to append them according to this extension. Finally, we apply our methodology to three open datasets in order to validate our approach when applied to real-world data. Our results show that the proposed CityJSON extension can represent all geometric information of a city model in a lossless way, providing additional topological information for the objects of the model. Full article
(This article belongs to the Special Issue Multidimensional and Multiscale GIS)
Show Figures

Figure 1

21 pages, 3995 KiB  
Article
Investigating the Spatiotemporally Varying Correlation between Urban Spatial Patterns and Ecosystem Services: A Case Study of Nansihu Lake Basin, China
by Cheng Li and Jie Zhao
ISPRS Int. J. Geo-Inf. 2019, 8(8), 346; https://doi.org/10.3390/ijgi8080346 - 31 Jul 2019
Cited by 22 | Viewed by 3682
Abstract
Ecosystem services are the benefits obtained from an ecosystem that have great significance in sustainable development. Urbanization has triggered significant changes on urban spatial patterns, which have had a great impact on the ecosystem services. However, studies on the spatiotemporally varying relationship between [...] Read more.
Ecosystem services are the benefits obtained from an ecosystem that have great significance in sustainable development. Urbanization has triggered significant changes on urban spatial patterns, which have had a great impact on the ecosystem services. However, studies on the spatiotemporally varying relationship between urban spatial patterns and ecosystem services are lacking. Taking as a case study, the Nansihu Lake Basin in China, this study aimed to explore the spatiotemporally varying relationship between urban spatial patterns and ecosystem services. Urban spatial patterns were derived by integrating remote sensing and spatial metrics. Ecosystem service values were calculated using ecosystem service models. The spatiotemporally varying impact of urban spatial patterns on ecosystem services was quantified using the Geographically Weighted Regression (GWR) model. The findings indicate that urban spatial patterns and ecosystem services have dramatically varied with the urbanization process. The estimated parameters indicate that urban spatial patterns have significant impacts on ecosystem services. The GWR revealed a spatiotemporally varying correlation and improved the explanatory ability in comparison with the Ordinary Least Squares (OLS) model. The investigation of the impact of urban spatial patterns on ecosystem services can provide more practical support for effective urban planning and ecosystem management. Full article
Show Figures

Figure 1

17 pages, 1220 KiB  
Article
A Spatio-Temporal Flow Model of Urban Dockless Shared Bikes Based on Points of Interest Clustering
by Jian Dong, Bin Chen, Lingnan He, Chuan Ai, Fang Zhang, Danhuai Guo and Xiaogang Qiu
ISPRS Int. J. Geo-Inf. 2019, 8(8), 345; https://doi.org/10.3390/ijgi8080345 - 31 Jul 2019
Cited by 13 | Viewed by 3489
Abstract
With the advantages of convenient access and free parking, urban dockless shared bikes are favored by the public. However, the irregular flow of dockless shared bikes poses a challenge for the research of flow pattern. In this paper, the flow characteristics of dockless [...] Read more.
With the advantages of convenient access and free parking, urban dockless shared bikes are favored by the public. However, the irregular flow of dockless shared bikes poses a challenge for the research of flow pattern. In this paper, the flow characteristics of dockless shared bikes are expounded through the analysis of the time series location data of ofo and mobike shared bikes in Beijing. Based on the analysis, a model called DestiFlow is proposed to describe the spatio-temporal flow of urban dockless shared bikes based on points of interest (POIs) clustering. The results show that the DestiFlow model can find the aggregation areas of dockless shared bikes and describe the structural characteristics of the flow network. Our model can not only predict the demand for dockless shared bikes, but also help to grasp the mobility characteristics of citizens and improve the urban traffic management system. Full article
Show Figures

Figure 1

18 pages, 13122 KiB  
Article
Identify and Delimitate Urban Hotspot Areas Using a Network-Based Spatiotemporal Field Clustering Method
by Zelong Xia, Hao Li, Yuehong Chen and Weisheng Liao
ISPRS Int. J. Geo-Inf. 2019, 8(8), 344; https://doi.org/10.3390/ijgi8080344 - 31 Jul 2019
Cited by 23 | Viewed by 4771
Abstract
Pick-up and drop-off events of taxi trajectory data contain rich information about residents’ travel activities and road traffic. Such data have been widely applied in urban hotspot detection in recent years. However, few studies have attempted to delimitate the urban hotspot scope using [...] Read more.
Pick-up and drop-off events of taxi trajectory data contain rich information about residents’ travel activities and road traffic. Such data have been widely applied in urban hotspot detection in recent years. However, few studies have attempted to delimitate the urban hotspot scope using taxi trajectory data. On this basis, the current study firstly introduces a network-based spatiotemporal field (NSF) clustering approach to discover and identify hotspots. Our proposed method expands the notion from spatial to space–time dimension and from Euclidean to network space by comparing with traditional spatial clustering analyses. In addition, a concentration index of hotspot areas is presented to refine the surface of centredness to delimitate the hotspot scope further. This index supports the quantitative depiction of hotspot areas by generating two standard deviation isolines. In the case study, we analyze the spatiotemporal dynamic patterns of hotspots at different days and times of day using the NSF method. Meanwhile, we also validate the effectiveness of the proposed method in identifying hotspots to evaluate the delimitating results. Experimental results reveal that the proposed approach can not only help detect detailed microscale characteristics of urban hotspots but also identify high-concentration patterns of pick-up incidents in specific places. Full article
Show Figures

Figure 1

14 pages, 20319 KiB  
Article
Fused Transparent Visualization of Point Cloud Data and Background Photographic Image for Tangible Cultural Heritage Assets
by Liang Li, Kyoko Hasegawa, Itaru Nii and Satoshi Tanaka
ISPRS Int. J. Geo-Inf. 2019, 8(8), 343; https://doi.org/10.3390/ijgi8080343 - 31 Jul 2019
Cited by 9 | Viewed by 4143
Abstract
Digital archiving of three-dimensional cultural heritage assets has increased the demand for visualization of large-scale point clouds of cultural heritage assets acquired by laser scanning. We proposed a fused transparent visualization method that visualizes a point cloud of a cultural heritage asset in [...] Read more.
Digital archiving of three-dimensional cultural heritage assets has increased the demand for visualization of large-scale point clouds of cultural heritage assets acquired by laser scanning. We proposed a fused transparent visualization method that visualizes a point cloud of a cultural heritage asset in an environment using a photographic image as the background. We also proposed lightness adjustment and color enhancement methods to deal with the reduced visibility caused by the fused visualization. We applied the proposed method to a laser-scanned point cloud of a high-valued cultural festival float with complex inner and outer structures. Experimental results demonstrate that the proposed method enables high-quality transparent visualization of the cultural asset in its surrounding environment. Full article
(This article belongs to the Special Issue Historical GIS and Digital Humanities)
Show Figures

Figure 1

16 pages, 2296 KiB  
Article
Research on Urban Ecological Network Under the Threat of Road Networks—A Case Study of Wuhan
by Zuohua Miao, Lei Pan, Qiaozhi Wang, Pei Chen, Cheng Yan and Likun Liu
ISPRS Int. J. Geo-Inf. 2019, 8(8), 342; https://doi.org/10.3390/ijgi8080342 - 31 Jul 2019
Cited by 50 | Viewed by 4485
Abstract
The creation of a road network can lead to the fragmentation and reduction of the connectivity of the ecological habitat. The study of urban ecological networks under threat from rapidly developing road networks is of great significance in understanding the changes in urban [...] Read more.
The creation of a road network can lead to the fragmentation and reduction of the connectivity of the ecological habitat. The study of urban ecological networks under threat from rapidly developing road networks is of great significance in understanding the changes in urban ecological processes and in constructing a reasonable ecological network. Spatial syntax is a linear space analysis method based on graph theory. Taking Wuhan city as an example and adopting spatial syntax to quantify road network threat factors, two resistance surfaces are established based on land use type assignment and overlapping road network threat factor assignment. The ecological environment under two scenarios is constructed by combining the MSPA (Morphological Spatial Pattern Analysis) method and MCR (Minimal Cumulative Resistance) model to comprehensively evaluate the network. Results demonstrate that spatial syntax can effectively describe the spatial characteristics of the road network. The average resistance value of the study area increases by 15.94%, the length of corridor increases by 37.9 km, the energy consumption of biological and material exchanges increases, and the resistance increases. To a certain extent, the model reflects the impact of road network threats on ecological processes. The results are useful in identifying the impact of human activities on ecological processes and provide a reference point for the construction of urban ecological security patterns. Full article
(This article belongs to the Special Issue Algorithms and Techniques in Urban Monitoring)
Show Figures

Figure 1

19 pages, 5043 KiB  
Article
An Improved Global Analysis of Population Distribution in Proximity to Active Volcanoes, 1975–2015
by Sergio Freire, Aneta J. Florczyk, Martino Pesaresi and Richard Sliuzas
ISPRS Int. J. Geo-Inf. 2019, 8(8), 341; https://doi.org/10.3390/ijgi8080341 - 31 Jul 2019
Cited by 54 | Viewed by 11187
Abstract
Better and more detailed analyses of global human exposure to hazards and associated disaster risk require improved geoinformation on population distribution and densities. In particular, issues of temporal and spatial resolution are important for determining the capacity for assessing changes in these distributions. [...] Read more.
Better and more detailed analyses of global human exposure to hazards and associated disaster risk require improved geoinformation on population distribution and densities. In particular, issues of temporal and spatial resolution are important for determining the capacity for assessing changes in these distributions. We combine the best-available global population grids with latest data on volcanoes, to assess and characterize the worldwide distribution of population from 1975–2015 in relation to recent volcanism. Both Holocene volcanoes and those where there is evidence of significant eruptions are considered. A comparative analysis is conducted for the volcanic hot spots of Southeast Asia and Central America. Results indicate that more than 8% of the world’s 2015 population lived within 100 km of a volcano with at least one significant eruption, and more than 1 billion people (14.3%) lived within 100 km of a Holocene volcano, with human concentrations in this zone increasing since 1975 above the global population growth rate. While overall spatial patterns of population density have been relatively stable in time, their variation with distance is not monotonic, with a higher concentration of people between 10 and 20 km from volcanoes. We find that in last 40 years in Southeast Asia the highest population growth rates have occurred in close proximity to volcanoes (within 10 km), whereas in Central America these are observed farther away (beyond 50 km), especially after 1990 and for Holocene volcanoes. Full article
Show Figures

Graphical abstract

25 pages, 1629 KiB  
Article
Semantic Profiles for Easing SensorML Description: Review and Proposal
by Paolo Tagliolato, Cristiano Fugazza, Alessandro Oggioni and Paola Carrara
ISPRS Int. J. Geo-Inf. 2019, 8(8), 340; https://doi.org/10.3390/ijgi8080340 - 31 Jul 2019
Cited by 14 | Viewed by 3804
Abstract
The adoption of Sensor Web Enablement (SWE) practices by sensor maintainers is hampered by the inherent complexity of the Sensor Model Language (SensorML), its high expressiveness, and the scarce availability of editing tools. To overcome these issues, the Earth Observation (EO) community often [...] Read more.
The adoption of Sensor Web Enablement (SWE) practices by sensor maintainers is hampered by the inherent complexity of the Sensor Model Language (SensorML), its high expressiveness, and the scarce availability of editing tools. To overcome these issues, the Earth Observation (EO) community often recurs to SensorML profiles narrowing the range of admitted metadata structures and value ranges. Unfortunately, profiles frequently fall short of providing usable editing tools and comprehensive validation criteria, particularly for the difficulty of checking value ranges in the multi-tenanted domain of the Web of Data. In this paper, we provide an updated review of current practices, techniques, and tools for editing SensorML in the perspective of profile support and introduce our solution for effective profile definition. Beside allowing for formalization of a broad range of constraints that concur in defining a metadata profile, our proposal closes the gap between profile definition and actual editing of the corresponding metadata by allowing for ex-ante validation of the metadata that is produced. On this basis, we suggest the notion of Semantic Web SensorML profiles, characterized by a new family of constraints involving Semantic Web sources. We also discuss implementation of SensorML profiles with our tool and pinpoint the benefits with respect to the existing ex-post validation facilities provided by schema definition languages. Full article
(This article belongs to the Special Issue Geospatial Metadata)
Show Figures

Figure 1

17 pages, 4560 KiB  
Article
Remote Diagnosis of Architectural Heritage Based on 5W1H Model-Based Metadata in Virtual Reality
by Jongwook Lee, Junki Kim, Jaehong Ahn and Woontack Woo
ISPRS Int. J. Geo-Inf. 2019, 8(8), 339; https://doi.org/10.3390/ijgi8080339 - 30 Jul 2019
Cited by 7 | Viewed by 7000
Abstract
We propose a framework based on the 5W1H model-based metadata for remote diagnosis in virtual reality (VR). For this purpose, we suggest unique metadata composed of Point of Interest (POI)-extended anchor (xAnchor)-content for a context-aware service in virtual and augmented reality. We define [...] Read more.
We propose a framework based on the 5W1H model-based metadata for remote diagnosis in virtual reality (VR). For this purpose, we suggest unique metadata composed of Point of Interest (POI)-extended anchor (xAnchor)-content for a context-aware service in virtual and augmented reality. We define the attributes of the metadata based on the 5W1H context for information retrieval according to the context in a remote diagnosis. Second, we propose the ontology-based linker metadata that express the relations between AR scenes and that retrieve external information. Moreover, we suggest heritage building information metadata for information retrieval according to context. For evaluation, we created a geo-tagged content tool and a remote diagnosis VR application. We conducted focus-group interviews and heuristic evaluations for remote diagnosis in VR to verify the methodology of this study. As a result, we found that experts were most satisfied with the functions that provide the contextualized information. This study contributes to the geospatial metadata for a context-aware service in VR/AR as well as the remote diagnosis framework to overcome the time-consuming problem of the existing remote diagnosis. Full article
(This article belongs to the Special Issue Geospatial Metadata)
Show Figures

Figure 1

22 pages, 2500 KiB  
Article
Improving the Positional Accuracy of Traditional Cadastral Index Maps with Membrane Adjustment in Slovenia
by Marjan Čeh, Frank Gielsdorf, Barbara Trobec, Mateja Krivic and Anka Lisec
ISPRS Int. J. Geo-Inf. 2019, 8(8), 338; https://doi.org/10.3390/ijgi8080338 - 30 Jul 2019
Cited by 14 | Viewed by 4378
Abstract
The main purpose of this research is to evaluate the improvement in positional accuracy (PAI) of cadastral boundary points’ coordinates through the adjustment of a large set of digital cadastral index maps of rural regions based on traditional Franciscan-origin maps of heterogeneous geometric [...] Read more.
The main purpose of this research is to evaluate the improvement in positional accuracy (PAI) of cadastral boundary points’ coordinates through the adjustment of a large set of digital cadastral index maps of rural regions based on traditional Franciscan-origin maps of heterogeneous geometric quality. The distribution of residuals of local coordinates of reference points onto the as yet unconnected neighboring points is researched. In this article, we use the adjustment method based on neighborhood transformation with a mechanical membrane model deriving from Hooke’s Law and consider a general case study of a Slovenian traditional cadastral graphic database of various historical origins. The number of geometric errors in fieldbook information from outdated measurement technologies and inappropriate implementations of cadastral index map geometric maintenance reduces the number of complying datasets of relative geometry by 50%. Previous experiments in traditional cadastral index maps of rural regions, with triangle-based piecewise affine plane transformation (RMSE = 2.4 m), have been improved by the membrane method (RMSE = 1.0 m), based on tests at 623 control points. Positional accuracy improvement of cadastral geospatial data and the integration of geometric subsystems provided recognizable benefits for the future maintenance of a unique, integrated, centralized graphical cadastral subsystem, which is in the testing phase in Slovenia. Full article
(This article belongs to the Special Issue Applications of GIScience for Land Administration)
Show Figures

Figure 1

9 pages, 5067 KiB  
Editorial
Guest Editor’s Editorial “Cognitive Aspects of Human-Computer Interaction for GIS”
by Dieter Fritsch
ISPRS Int. J. Geo-Inf. 2019, 8(8), 337; https://doi.org/10.3390/ijgi8080337 - 30 Jul 2019
Cited by 1 | Viewed by 3858
Abstract
The first Hypertext System and HCI [...] Full article
(This article belongs to the Special Issue Cognitive Aspects of Human-Computer Interaction for GIS)
Show Figures

Figure 1

16 pages, 6025 KiB  
Article
The Distribution Pattern of the Railway Network in China at the County Level
by Minmin Li, Renzhong Guo, You Li, Biao He and Yong Fan
ISPRS Int. J. Geo-Inf. 2019, 8(8), 336; https://doi.org/10.3390/ijgi8080336 - 30 Jul 2019
Cited by 7 | Viewed by 5085
Abstract
Evaluation of the railway network distribution and its impacts on social and economic development has great significance for building an efficient and comprehensive railway system. To address the lack of evaluation indicators to assess the railway network distribution pattern at the macro scale, [...] Read more.
Evaluation of the railway network distribution and its impacts on social and economic development has great significance for building an efficient and comprehensive railway system. To address the lack of evaluation indicators to assess the railway network distribution pattern at the macro scale, this study selects eight indicators—railway network density, railway network proximity, the shortest travel time, train frequency, population, Gross Domestic Product (GDP), the gross industrial value above designated size, and fixed asset investment—as the basis of an integrated railway network distribution index which is used to characterize China’s railway network distribution using geographical information system (GIS) technology. The research shows that, in 2015, the railway network distribution was low in almost half of China’s counties and that there were obvious differences in distribution between counties in the east and west. In addition, multiple dense areas of railway network distribution were identified. The results suggest that it might be advisable to strengthen the connections between large and small cities in the eastern region and that the major urban agglomerations in the midwest could focus on strengthening the construction of railway facilities to increase the urban vitality of the western region. This study can be used to guide the optimization of railway network structures and provide a macro decision-making reference for the planning and evaluation of major railway projects in China. Full article
Show Figures

Figure 1

17 pages, 8332 KiB  
Article
Multi-Scale Flow Field Mapping Method Based on Real-Time Feature Streamlines
by Yu Fang, Bo Ai, Jing Fang, Wenpeng Xin, Xiangwei Zhao and Guannan Lv
ISPRS Int. J. Geo-Inf. 2019, 8(8), 335; https://doi.org/10.3390/ijgi8080335 - 30 Jul 2019
Cited by 3 | Viewed by 3628
Abstract
Traditional static flow field visualization methods suffer from many problems, such as a lack of continuity expression in the vector field, uneven distribution of seed points, messy visualization, and time-consuming calculations. In response to these problems, this paper proposes a multi-scale mapping method [...] Read more.
Traditional static flow field visualization methods suffer from many problems, such as a lack of continuity expression in the vector field, uneven distribution of seed points, messy visualization, and time-consuming calculations. In response to these problems, this paper proposes a multi-scale mapping method based on real-time feature streamlines. The method uses feature streamlines to solve the problem of continuity expression in flow fields and introduces a streamline tracking algorithm which combines adaptive step length with velocity matching to render feature streamlines in a real-time and multi-scale way. In order to improve the stability and uniformity of the seed point layout, this method uses two different point placement methods which utilize a global regular grid distribution algorithm and feature area random distribution algorithm. In addition, this method uses a collision detection algorithm to detect and deal with the unreasonable covering between streamlines, which alleviates visual confusion in the resulting drawing. This method also uses HTML5 Canvas to render streamlines, which greatly improves the drawing speed. Therefore, use of this method can not only improve the uniformity of the seed point layout and the speed of drawing but also solve the problems of continuity expression in the vector field and messy visualization. Full article
Show Figures

Figure 1

25 pages, 3746 KiB  
Article
Fleet Size and Rebalancing Analysis of Dockless Bike-Sharing Stations Based on Markov Chain
by Yong Zhai, Jin Liu, Juan Du and Hao Wu
ISPRS Int. J. Geo-Inf. 2019, 8(8), 334; https://doi.org/10.3390/ijgi8080334 - 29 Jul 2019
Cited by 21 | Viewed by 3664
Abstract
In order to improve the dynamic optimization of fleet size and standardized management of dockless bike-sharing, this paper focuses on using the Markov stochastic process and linear programming method to solve the problem of bike-sharing fleet size and rebalancing. Based on the analysis [...] Read more.
In order to improve the dynamic optimization of fleet size and standardized management of dockless bike-sharing, this paper focuses on using the Markov stochastic process and linear programming method to solve the problem of bike-sharing fleet size and rebalancing. Based on the analysis of characters of bike-sharing, which are irreducible, aperiodic and positive-recurrence, we prove that the probability limits the state (steady-state) of bike-sharing Markov chain only exists and is independent of the initial probability distribution. Then a new “Markov chain dockless bike-sharing fleet size solution” algorithm is proposed. The process includes three parts. Firstly, the irreducibility of the bike-sharing transition probability matrix is analyzed. Secondly, the rank-one updating method is used to construct the transition probability random prime matrix. Finally, an iterative method for solving the steady-state probability vector is therefore given and the convergence speed of the method is analyzed. Furthermore, we discuss the dynamic solution of the bike-sharing steady-state fleet size according to the time period, so as improving the practicality of the algorithm. To verify the efficiency of this algorithm, we adopt the linear programming method for bicycle rebalancing analysis. Experiment results show that the algorithm could be used to solve the disordered deployment of dockless bike-sharing. Full article
Show Figures

Figure 1

Previous Issue
Next Issue
Back to TopTop