Next Issue
Volume 6, December
Previous Issue
Volume 6, June


Risks, Volume 6, Issue 3 (September 2018) – 41 articles

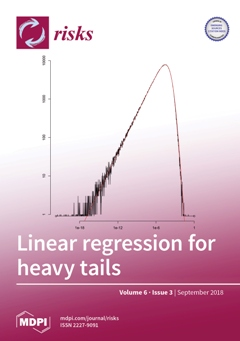
Cover Story (view full-size image): The block plot shows the frequency of the Right Median estimate for the absolute slope of the regression line based on 1,000,000 simulations of a sample of 100 observations. The error and explanatory variable both have very heavy tails. The error has a Student distribution with 1/4 degrees of freedom; the explanatory variable has a Pareto distribution that is the third power of the inverse of a standard uniform variable. The estimate is a bisector of the sample and of the 21 rightmost sample points. The red curve is the associated Exponential Generalized Prime Beta fit. View this paper.
  • Issues are regarded as officially published after their release is announced to the table of contents alert mailing list.
  • You may sign up for e-mail alerts to receive table of contents of newly released issues.
  • PDF is the official format for papers published in both, html and pdf forms. To view the papers in pdf format, click on the "PDF Full-text" link, and use the free Adobe Reader to open them.
Order results
Result details
Select all
Export citation of selected articles as:
20 pages, 508 KiB  
Article
The Impact of Management Fees on the Pricing of Variable Annuity Guarantees
by Jin Sun, Pavel V. Shevchenko and Man Chung Fung
Risks 2018, 6(3), 103; https://doi.org/10.3390/risks6030103 - 19 Sep 2018
Cited by 4 | Viewed by 2805
Abstract
Variable annuities, as a class of retirement income products, allow equity market exposure for a policyholder’s retirement fund with optional guarantees to limit the downside risk of the market. Management fees andguarantee insurance fees are charged respectively for the market exposure and for [...] Read more.
Variable annuities, as a class of retirement income products, allow equity market exposure for a policyholder’s retirement fund with optional guarantees to limit the downside risk of the market. Management fees andguarantee insurance fees are charged respectively for the market exposure and for the protection from the downside risk. We investigate the pricing of variable annuity guarantees under optimal withdrawal strategies when management fees are present. We consider from both policyholder’s and insurer’s perspectives optimal withdrawal strategies and calculate the respective fair insurance fees. We reveal a discrepancy where the fees from the insurer’s perspective can be significantly higher due to the management fees serving as a form of market friction. Our results provide a possible explanation of lower guarantee insurance fees observed in the market than those predicted from the insurer’s perspective. Numerical experiments are conducted to illustrate the results. Full article
Show Figures

Figure 1

24 pages, 629 KiB  
Article
Fluctuation Theory for Upwards Skip-Free Lévy Chains
by Matija Vidmar
Risks 2018, 6(3), 102; https://doi.org/10.3390/risks6030102 - 18 Sep 2018
Cited by 4 | Viewed by 2486
Abstract
A fluctuation theory and, in particular, a theory of scale functions is developed for upwards skip-free Lévy chains, i.e., for right-continuous random walks embedded into continuous time as compound Poisson processes. This is done by analogy to the spectrally negative class of Lévy [...] Read more.
A fluctuation theory and, in particular, a theory of scale functions is developed for upwards skip-free Lévy chains, i.e., for right-continuous random walks embedded into continuous time as compound Poisson processes. This is done by analogy to the spectrally negative class of Lévy processes—several results, however, can be made more explicit/exhaustive in the compound Poisson setting. Importantly, the scale functions admit a linear recursion, of constant order when the support of the jump measure is bounded, by means of which they can be calculated—some examples are presented. An application to the modeling of an insurance company’s aggregate capital process is briefly considered. Full article
Show Figures

Figure 1

17 pages, 897 KiB  
Article
A Quantum-Type Approach to Non-Life Insurance Risk Modelling
by Claude Lefèvre, Stéphane Loisel, Muhsin Tamturk and Sergey Utev
Risks 2018, 6(3), 99; https://doi.org/10.3390/risks6030099 - 14 Sep 2018
Cited by 6 | Viewed by 3497
Abstract
A quantum mechanics approach is proposed to model non-life insurance risks and to compute the future reserve amounts and the ruin probabilities. The claim data, historical or simulated, are treated as coming from quantum observables and analyzed with traditional machine learning tools. They [...] Read more.
A quantum mechanics approach is proposed to model non-life insurance risks and to compute the future reserve amounts and the ruin probabilities. The claim data, historical or simulated, are treated as coming from quantum observables and analyzed with traditional machine learning tools. They can then be used to forecast the evolution of the reserves of an insurance company. The following methodology relies on the Dirac matrix formalism and the Feynman path-integral method. Full article
14 pages, 3791 KiB  
Article
Optimum Technology Product Life Cycle Technology Innovation Investment-Using Compound Binomial Options
by Chuan-Chuan Ko, Tyrone T. Lin, Fu-Min Zeng and Chien-Yu Liu
Risks 2018, 6(3), 98; https://doi.org/10.3390/risks6030098 - 14 Sep 2018
Cited by 7 | Viewed by 3527
Abstract
The study considers the product life cycle in the stages of technological innovation, and focuses on how to evaluate the optimal investment strategy and the project value. It applies different product stages (three stages including production innovation, manufacture innovation, and business innovation) factors [...] Read more.
The study considers the product life cycle in the stages of technological innovation, and focuses on how to evaluate the optimal investment strategy and the project value. It applies different product stages (three stages including production innovation, manufacture innovation, and business innovation) factors to different risks to build a technology innovation strategy model. This study of option premiums aims for the best strategy timing for each innovation stage. It shows that the variation of business cycle will affect the purchasing power under the uncertainty of Gross Domestic Product (GDP). In application, the compound binomial options for the manufacture innovation will only be considered after the execution of the production innovation, whereas the operation innovation will only be considered after the execution of the manufacture innovation. Thus, this paper constructs the dynamic investment sequential decision model, assesses the feasibility of an investment strategy, and makes a decision on the appropriate project value and option premiums for each stage under the possible change of GDP. Numerically, the result shows the equity value of the investment is greater than 0. Therefore, this paper recommends the case firm to invest in its innovation project known as one-time passwords. Sensitivity analysis shows when the risk-adjusted discounted rate r increases, the risk of the investment market increases accordingly, hence the equity value must also be higher in order to attract the case firm’s investment interest. Also, the average GDP growth rate u sensitivity analysis results in different phenomena. The equity value gradually decreases when the average GDP growth rate rises. When the average GDP growth rate u rises to a certain extent, however, its equity value is gradually growing. The study investigates the product life cycle innovation investment topic by using the compound binomial options method and therefore provide a more flexible strategy decision compared with other trend forecast criteria. Full article
Show Figures

Figure 1

21 pages, 417 KiB  
Article
The Interaction of Borrower and Loan Characteristics in Predicting Risks of Subprime Automobile Loans
by Yaseen Ghulam, Kamini Dhruva, Sana Naseem and Sophie Hill
Risks 2018, 6(3), 101; https://doi.org/10.3390/risks6030101 - 14 Sep 2018
Cited by 5 | Viewed by 4068
Abstract
We utilize the data of a very large UK automobile loan firm to study the interaction of the characteristics of borrowers and loans in predicting the subsequent loan performance. Our broader findings confirm the earlier research on the issue of subprime auto loans. [...] Read more.
We utilize the data of a very large UK automobile loan firm to study the interaction of the characteristics of borrowers and loans in predicting the subsequent loan performance. Our broader findings confirm the earlier research on the issue of subprime auto loans. More importantly, unmarried borrowers living with furnished tenancy agreements who have relatively new jobs have a probability of defaulting of more than 60% compared to an average 7% default rate in overall subprime borrowers in the dataset. Also, in the above category are those who live in a less prosperous part of the UK such as the north-west, are full-time self-employed, have other large loan arrears, fall into the bottom 25% percentile of monthly income, secure loans with high loan to total value (LTV), purchase expensive automobiles with shorter loan duration payment plans, and have a high dependency on government support. This in fact is also true of those who go into arrears, except that the highest probability in this context is around 40% compared to 6% for an overall sample. These findings shall help in the understanding of subprime auto loans performance in relation to borrowers and loan features alongside helping auto finance firms improve predictive models and decision-making. Full article
11 pages, 765 KiB  
Article
A User-Friendly Algorithm for Detecting the Influence of Background Risks on a Model
by Nadezhda Gribkova and Ričardas Zitikis
Risks 2018, 6(3), 100; https://doi.org/10.3390/risks6030100 - 14 Sep 2018
Cited by 5 | Viewed by 3054
Abstract
Background, or systematic, risks are integral parts of many systems and models in insurance and finance. These risks can, for example, be economic in nature, or they can carry more technical connotations, such as errors or intrusions, which could be intentional or unintentional. [...] Read more.
Background, or systematic, risks are integral parts of many systems and models in insurance and finance. These risks can, for example, be economic in nature, or they can carry more technical connotations, such as errors or intrusions, which could be intentional or unintentional. A most natural question arises from the practical point of view: is the given system really affected by these risks? In this paper we offer an algorithm for answering this question, given input-output data and appropriately constructed statistics, which rely on the order statistics of inputs and the concomitants of outputs. Even though the idea is rooted in complex statistical and probabilistic considerations, the algorithm is easy to implement and use in practice, as illustrated using simulated data. Full article
(This article belongs to the Special Issue Risk, Ruin and Survival: Decision Making in Insurance and Finance)
Show Figures

Figure 1

47 pages, 969 KiB  
Article
General Quantile Time Series Regressions for Applications in Population Demographics
by Gareth W. Peters
Risks 2018, 6(3), 97; https://doi.org/10.3390/risks6030097 - 13 Sep 2018
Cited by 5 | Viewed by 3947
Abstract
The paper addresses three objectives: the first is a presentation and overview of some important developments in quantile times series approaches relevant to demographic applications—secondly, development of a general framework to represent quantile regression models in a unifying manner, which can further enhance [...] Read more.
The paper addresses three objectives: the first is a presentation and overview of some important developments in quantile times series approaches relevant to demographic applications—secondly, development of a general framework to represent quantile regression models in a unifying manner, which can further enhance practical extensions and assist in formation of connections between existing models for practitioners. In this regard, the core theme of the paper is to provide perspectives to a general audience of core components that go into construction of a quantile time series model. The third objective is to compare and discuss the application of the different quantile time series models on several sets of interesting demographic and mortality related time series data sets. This has relevance to life insurance analysis and the resulting exploration undertaken includes applications in mortality, fertility, births and morbidity data for several countries, with a more detailed analysis of regional data in England, Wales and Scotland. Full article
Show Figures

Figure 1

30 pages, 1107 KiB  
Article
Bootstrapping Average Value at Risk of Single and Collective Risks
by Eric Beutner and Henryk Zähle
Risks 2018, 6(3), 96; https://doi.org/10.3390/risks6030096 - 12 Sep 2018
Cited by 1 | Viewed by 2832
Abstract
Almost sure bootstrap consistency of the blockwise bootstrap for the Average Value at Risk of single risks is established for strictly stationary β -mixing observations. Moreover, almost sure bootstrap consistency of a multiplier bootstrap for the Average Value at Risk of collective risks [...] Read more.
Almost sure bootstrap consistency of the blockwise bootstrap for the Average Value at Risk of single risks is established for strictly stationary β -mixing observations. Moreover, almost sure bootstrap consistency of a multiplier bootstrap for the Average Value at Risk of collective risks is established for independent observations. The main results rely on a new functional delta-method for the almost sure bootstrap of uniformly quasi-Hadamard differentiable statistical functionals, to be presented here. The latter seems to be interesting in its own right. Full article
19 pages, 823 KiB  
Article
CoRisk: Credit Risk Contagion with Correlation Network Models
by Paolo Giudici and Laura Parisi
Risks 2018, 6(3), 95; https://doi.org/10.3390/risks6030095 - 12 Sep 2018
Cited by 21 | Viewed by 4704
Abstract
We propose a novel credit risk measurement model for Corporate Default Swap (CDS) spreads that combines vector autoregressive regression with correlation networks. We focus on the sovereign CDS spreads of a collection of countries that can be regarded as idiosyncratic measures of credit [...] Read more.
We propose a novel credit risk measurement model for Corporate Default Swap (CDS) spreads that combines vector autoregressive regression with correlation networks. We focus on the sovereign CDS spreads of a collection of countries that can be regarded as idiosyncratic measures of credit risk. We model CDS spreads by means of a structural vector autoregressive model, composed by a time dependent country specific component, and by a contemporaneous component that describes contagion effects among countries. To disentangle the two components, we employ correlation networks, derived from the correlation matrix between the reduced form residuals. The proposed model is applied to ten countries that are representative of the recent financial crisis: top borrowing/lending countries, and peripheral European countries. The empirical findings show that the contagion variable derived in this study can be considered as a network centrality measure. From an applied viewpoint, the results indicate that, in the last 10 years, contagion has induced a “clustering effect” between core and peripheral countries, with the two groups further diverging through, and because of, contagion propagation, thus creating a sort of diabolic loop extremely difficult to be reversed. Finally, the outcomes of the analysis confirm that core countries are importers of risk, as contagion increases their CDS spread, whereas peripheral countries are exporters of risk. Greece is an unfortunate exception, as its spreads seem to increase for both idiosyncratic factors and contagion effects. Full article
(This article belongs to the Special Issue Systemic Risk in Finance and Insurance)
Show Figures

Figure 1

22 pages, 929 KiB  
Article
Country Risk Ratings and Stock Market Returns in Brazil, Russia, India, and China (BRICS) Countries: A Nonlinear Dynamic Approach
by Adnen Ben Nasr, Juncal Cunado, Rıza Demirer and Rangan Gupta
Risks 2018, 6(3), 94; https://doi.org/10.3390/risks6030094 - 10 Sep 2018
Cited by 16 | Viewed by 5341
Abstract
This study examines the linkages between Brazil, Russia, India, and China (BRICS) stock market returns, country risk ratings, and international factors via Non-linear Auto Regressive Distributed Lags models (NARDL) that allow for testing the asymmetric effects of changes in country risk ratings on [...] Read more.
This study examines the linkages between Brazil, Russia, India, and China (BRICS) stock market returns, country risk ratings, and international factors via Non-linear Auto Regressive Distributed Lags models (NARDL) that allow for testing the asymmetric effects of changes in country risk ratings on stock market returns. We show that BRICS countries exhibit quite a degree of heterogeneity in the interaction of their stock market returns with country-specific political, financial, and economic risk ratings. Positive and negative rating changes in some BRICS countries are found to have significant implications for both local stock market returns, as well as commodity price dynamics. While the commodity market acts as a catalyst for these emerging stock markets in the long-run, we also observe that negative changes in the country risk ratings generally command a higher impact on stock returns, implying the greater impact of bad news on market dynamics. Our findings suggest that not all BRICS nations are the same in terms of how they react to ratings changes and how they interact with global market variables. Full article
(This article belongs to the Special Issue Measuring and Modelling Financial Risk and Derivatives)
Show Figures

Figure A1

70 pages, 3893 KiB  
Article
Linear Regression for Heavy Tails
by Guus Balkema and Paul Embrechts
Risks 2018, 6(3), 93; https://doi.org/10.3390/risks6030093 - 10 Sep 2018
Cited by 5 | Viewed by 4289
Abstract
There exist several estimators of the regression line in the simple linear regression: Least Squares, Least Absolute Deviation, Right Median, Theil–Sen, Weighted Balance, and Least Trimmed Squares. Their performance for heavy tails is compared below on the basis of a quadratic loss function. [...] Read more.
There exist several estimators of the regression line in the simple linear regression: Least Squares, Least Absolute Deviation, Right Median, Theil–Sen, Weighted Balance, and Least Trimmed Squares. Their performance for heavy tails is compared below on the basis of a quadratic loss function. The case where the explanatory variable is the inverse of a standard uniform variable and where the error has a Cauchy distribution plays a central role, but heavier and lighter tails are also considered. Tables list the empirical sd and bias for ten batches of one hundred thousand simulations when the explanatory variable has a Pareto distribution and the error has a symmetric Student distribution or a one-sided Pareto distribution for various tail indices. The results in the tables may be used as benchmarks. The sample size is n = 100 but results for n = are also presented. The error in the estimate of the slope tneed not be asymptotically normal. For symmetric errors, the symmetric generalized beta prime densities often give a good fit. Full article
(This article belongs to the Special Issue Heavy Tailed Distributions in Economics)
Show Figures

Figure 1

13 pages, 906 KiB  
Article
On the Basel Liquidity Formula for Elliptical Distributions
by Janine Balter and Alexander J. McNeil
Risks 2018, 6(3), 92; https://doi.org/10.3390/risks6030092 - 07 Sep 2018
Cited by 2 | Viewed by 2598
Abstract
A justification of the Basel liquidity formula for risk capital in the trading book is given under the assumption that market risk-factor changes form a Gaussian white noise process over 10-day time steps and changes to P&L (profit-and-loss) are linear in the risk-factor [...] Read more.
A justification of the Basel liquidity formula for risk capital in the trading book is given under the assumption that market risk-factor changes form a Gaussian white noise process over 10-day time steps and changes to P&L (profit-and-loss) are linear in the risk-factor changes. A generalization of the formula is derived under the more general assumption that risk-factor changes are multivariate elliptical. It is shown that the Basel formula tends to be conservative when the elliptical distributions are from the heavier-tailed generalized hyperbolic family. As a by-product of the analysis, a Fourier approach to calculating expected shortfall for general symmetric loss distributions is developed. Full article
13 pages, 401 KiB  
Article
The Stability of the Aggregate Loss Distribution
by Riccardo Gatto
Risks 2018, 6(3), 91; https://doi.org/10.3390/risks6030091 - 05 Sep 2018
Cited by 2 | Viewed by 2590
Abstract
In this article we introduce the stability analysis of a compound sum: it consists of computing the standardized variation of the survival function of the sum resulting from an infinitesimal perturbation of the common distribution of the summands. Stability analysis is complementary to [...] Read more.
In this article we introduce the stability analysis of a compound sum: it consists of computing the standardized variation of the survival function of the sum resulting from an infinitesimal perturbation of the common distribution of the summands. Stability analysis is complementary to the classical sensitivity analysis, which consists of computing the derivative of an important indicator of the model, with respect to a model parameter. We obtain a computational formula for this stability from the saddlepoint approximation. We apply the formula to the compound Poisson insurer loss with gamma individual claim amounts and to the compound geometric loss with Weibull individual claim amounts. Full article
Show Figures

Figure 1

17 pages, 417 KiB  
Article
Mean Field Game with Delay: A Toy Model
by Jean-Pierre Fouque and Zhaoyu Zhang
Risks 2018, 6(3), 90; https://doi.org/10.3390/risks6030090 - 01 Sep 2018
Cited by 5 | Viewed by 2862
Abstract
We study a toy model of linear-quadratic mean field game with delay. We “lift” the delayed dynamic into an infinite dimensional space, and recast the mean field game system which is made of a forward Kolmogorov equation and a backward Hamilton-Jacobi-Bellman equation. We [...] Read more.
We study a toy model of linear-quadratic mean field game with delay. We “lift” the delayed dynamic into an infinite dimensional space, and recast the mean field game system which is made of a forward Kolmogorov equation and a backward Hamilton-Jacobi-Bellman equation. We identify the corresponding master equation. A solution to this master equation is computed, and we show that it provides an approximation to a Nash equilibrium of the finite player game. Full article
(This article belongs to the Special Issue Systemic Risk in Finance and Insurance)
16 pages, 353 KiB  
Article
The Determinants of CDS Spreads in Multiple Industry Sectors: A Comparison between the US and Europe
by Jatin Malhotra and Angelo Corelli
Risks 2018, 6(3), 89; https://doi.org/10.3390/risks6030089 - 31 Aug 2018
Cited by 4 | Viewed by 3420
Abstract
The paper analyzes the relationship between the credit default swaps (CDS) spreads for 5-year CDS in Europe and US, and fundamental macroeconomic variables such as regional stock indices, oil prices, gold prices, and interest rates. The dataset includes consideration of multiple industry sectors [...] Read more.
The paper analyzes the relationship between the credit default swaps (CDS) spreads for 5-year CDS in Europe and US, and fundamental macroeconomic variables such as regional stock indices, oil prices, gold prices, and interest rates. The dataset includes consideration of multiple industry sectors in both economies, and it is split in two sections, before and after the global financial crisis. The analysis is carried out using multivariate regression of each index vs. the macroeconomic variables, and a Granger causality test. Both approaches are performed on the change of value of the variables involved. Results show that equity markets lead in price discovery, bidirectional causality between interest rate, and CDS spreads for most sectors involved. There is also bidirectional causality between stock and oil returns to CDS spreads. Full article
15 pages, 1657 KiB  
Article
Some Results on Measures of Interaction between Paired Risks
by Rui Fang and Xiaohu Li
Risks 2018, 6(3), 88; https://doi.org/10.3390/risks6030088 - 27 Aug 2018
Cited by 4 | Viewed by 2825
Abstract
Co-risk measures and risk contribution measures have been introduced to evaluate the degree of interaction between paired risks in actuarial risk management. This paper attempts to study the ordering behavior of measures on interaction between paired risks. For various co-risk measures and risk [...] Read more.
Co-risk measures and risk contribution measures have been introduced to evaluate the degree of interaction between paired risks in actuarial risk management. This paper attempts to study the ordering behavior of measures on interaction between paired risks. For various co-risk measures and risk contribution measures, we investigate how the marginal distributions and the dependence structure impact on the level of interaction between paired risks. Also, several numerical examples based on Monte Carlo simulation are presented to illustrate the main findings. Full article
(This article belongs to the Special Issue Heavy-Tail Phenomena in Insurance, Finance, and Other Related Fields)
Show Figures

Figure 1

14 pages, 413 KiB  
Article
On the Evaluation of the Distribution of a General Multivariate Collective Model: Recursions versus Fast Fourier Transform
by Raluca Vernic
Risks 2018, 6(3), 87; https://doi.org/10.3390/risks6030087 - 26 Aug 2018
Cited by 2 | Viewed by 2385
Abstract
With the purpose of introducing dependence between different types of claims, multivariate collective models have recently gained a lot of attention. However, when it comes to the evaluation of the corresponding compound distribution, the problems increase with the dimensionality of the model. In [...] Read more.
With the purpose of introducing dependence between different types of claims, multivariate collective models have recently gained a lot of attention. However, when it comes to the evaluation of the corresponding compound distribution, the problems increase with the dimensionality of the model. In this paper, we consider a multivariate collective model that generalizes a model already studied from the point of view of recursive and FFT evaluation of its distribution, and we extend the same study to the general model. With the intention to see which method works better for this general model, we compare the recursive method with the FFT technique, and emphasize the advantages and drawbacks of each one, based on numerical examples. Full article
17 pages, 1018 KiB  
Article
Moments of Compound Renewal Sums with Dependent Risks Using Mixing Exponential Models
by Fouad Marri, Franck Adékambi and Khouzeima Moutanabbir
Risks 2018, 6(3), 86; https://doi.org/10.3390/risks6030086 - 24 Aug 2018
Cited by 4 | Viewed by 3110
Abstract
In this paper, we study the discounted renewal aggregate claims with a full dependence structure. Based on a mixing exponential model, the dependence among the inter-claim times, the claim sizes, as well as the dependence between the inter-claim times and the claim sizes [...] Read more.
In this paper, we study the discounted renewal aggregate claims with a full dependence structure. Based on a mixing exponential model, the dependence among the inter-claim times, the claim sizes, as well as the dependence between the inter-claim times and the claim sizes are included. The main contribution of this paper is the derivation of the closed-form expressions for the higher moments of the discounted aggregate renewal claims. Then, explicit expressions of these moments are provided for specific copulas families and some numerical illustrations are given to analyze the impact of dependency on the moments of the discounted aggregate amount of claims. Full article
(This article belongs to the Special Issue Risk, Ruin and Survival: Decision Making in Insurance and Finance)
11 pages, 859 KiB  
Article
A VaR-Type Risk Measure Derived from Cumulative Parisian Ruin for the Classical Risk Model
by Mohamed Amine Lkabous and Jean-François Renaud
Risks 2018, 6(3), 85; https://doi.org/10.3390/risks6030085 - 24 Aug 2018
Cited by 6 | Viewed by 3258
Abstract
In this short paper, we study a VaR-type risk measure introduced by Guérin and Renaud and which is based on cumulative Parisian ruin. We derive some properties of this risk measure and we compare it to the risk measures of Trufin et al. [...] Read more.
In this short paper, we study a VaR-type risk measure introduced by Guérin and Renaud and which is based on cumulative Parisian ruin. We derive some properties of this risk measure and we compare it to the risk measures of Trufin et al. and Loisel and Trufin. Full article
(This article belongs to the Special Issue Risk, Ruin and Survival: Decision Making in Insurance and Finance)
Show Figures

Figure 1

19 pages, 1233 KiB  
Article
The Impact of Sovereign Yield Curve Differentials on Value-at-Risk Forecasts for Foreign Exchange Rates
by Holger Fink, Andreas Fuest and Henry Port
Risks 2018, 6(3), 84; https://doi.org/10.3390/risks6030084 - 20 Aug 2018
Cited by 2 | Viewed by 4785
Abstract
A functional ARMA-GARCH model for predicting the value-at-risk of the EURUSD exchange rate is introduced. The model implements the yield curve differentials between EUR and the US as exogenous factors. Functional principal component analysis allows us to use the information of basically the [...] Read more.
A functional ARMA-GARCH model for predicting the value-at-risk of the EURUSD exchange rate is introduced. The model implements the yield curve differentials between EUR and the US as exogenous factors. Functional principal component analysis allows us to use the information of basically the whole yield curve in a parsimonious way for exchange rate risk prediction. The data analyzed in our empirical study consist of the EURUSD exchange rate and the EUR- and US-yield curves from 15 August 2005–30 September 2016. As a benchmark, we take an ARMA-GARCH and an ARMAX-GARCHX with the 2y-yield difference as the exogenous variable and compare the forecasting performance via likelihood ratio tests. However, while our model performs better in one situation, it does not seem to improve the performance in other setups compared to its competitors. Full article
Show Figures

Figure 1

16 pages, 1043 KiB  
Article
Bayesian Adjustment for Insurance Misrepresentation in Heavy-Tailed Loss Regression
by Michelle Xia
Risks 2018, 6(3), 83; https://doi.org/10.3390/risks6030083 - 17 Aug 2018
Cited by 3 | Viewed by 2831
Abstract
In this paper, we study the problem of misrepresentation under heavy-tailed regression models with the presence of both misrepresented and correctly-measured risk factors. Misrepresentation is a type of fraud when a policy applicant gives a false statement on a risk factor that determines [...] Read more.
In this paper, we study the problem of misrepresentation under heavy-tailed regression models with the presence of both misrepresented and correctly-measured risk factors. Misrepresentation is a type of fraud when a policy applicant gives a false statement on a risk factor that determines the insurance premium. Under the regression context, we introduce heavy-tailed misrepresentation models based on the lognormal, Weibull and Pareto distributions. The proposed models allow insurance modelers to identify risk characteristics associated with the misrepresentation risk, by imposing a latent logit model on the prevalence of misrepresentation. We prove the theoretical identifiability and implement the models using Bayesian Markov chain Monte Carlo techniques. The model performance is evaluated through both simulated data and real data from the Medical Panel Expenditure Survey. The simulation study confirms the consistency of the Bayesian estimators in large samples, whereas the case study demonstrates the necessity of the proposed models for real applications when the losses exhibit heavy-tailed features. Full article
(This article belongs to the Special Issue Heavy-Tail Phenomena in Insurance, Finance, and Other Related Fields)
Show Figures

Figure 1

54 pages, 11812 KiB  
Article
Bank Stress Testing: A Stochastic Simulation Framework to Assess Banks’ Financial Fragility
by Giuseppe Montesi and Giovanni Papiro
Risks 2018, 6(3), 82; https://doi.org/10.3390/risks6030082 - 17 Aug 2018
Cited by 8 | Viewed by 8795
Abstract
We present a stochastic simulation forecasting model for stress testing that is aimed at assessing banks’ capital adequacy, financial fragility, and probability of default. The paper provides a theoretical presentation of the methodology and the essential features of the forecasting model on which [...] Read more.
We present a stochastic simulation forecasting model for stress testing that is aimed at assessing banks’ capital adequacy, financial fragility, and probability of default. The paper provides a theoretical presentation of the methodology and the essential features of the forecasting model on which it is based. Also, for illustrative purposes and to show in practical terms how to apply the methodology and the types of outcomes and analysis that can be obtained, we report the results of an empirical application of the methodology proposed to the Global Systemically Important Banks (G-SIB) banks. The results of the stress test exercise are compared with the results of the supervisory stress tests performed in 2014 by the Federal Reserve and EBA/ECB. Full article
Show Figures

Figure 1

14 pages, 332 KiB  
Article
Health Insurance in Myanmar: The Views and Perception of Healthcare Consumers and Health System Informants on the Establishment of a Nationwide Health Insurance System
by Marjolein Van Rooijen, Chaw-Yin Myint, Milena Pavlova and Wim Groot
Risks 2018, 6(3), 81; https://doi.org/10.3390/risks6030081 - 17 Aug 2018
Cited by 3 | Viewed by 5720
Abstract
(1) Background: Health insurance and social protection in Myanmar are negligible, which leaves many citizens at risk of financial hardship in case of a serious illness. The aim of this study is to explore the views of healthcare consumers and compare them to [...] Read more.
(1) Background: Health insurance and social protection in Myanmar are negligible, which leaves many citizens at risk of financial hardship in case of a serious illness. The aim of this study is to explore the views of healthcare consumers and compare them to the views of key informants on the design and implementation of a nationwide health insurance system in Myanmar. (2) Method: Data were collected through nine focus group discussions with healthcare consumers and six semi-structured interviews with key health system informants. (3) Results: The consumers supported a mandatory basic health insurance and voluntary supplementary health insurance. Tax-based funding was suggested as an option that can help to enhance healthcare utilization among the poor and vulnerable groups. However, a fully tax-based funding was perceived to have limited chances of success given the low level of government resources available. Community-based insurance, where community members pool money in a healthcare fund, was seen as more appropriate for the rural areas. (4) Conclusion: This study suggests a healthcare financing mechanism based on a mixed insurance model for the creation of nationwide health insurance. Further inquiry into the feasibility of the vital aspects of the nationwide health insurance is needed. Full article
20 pages, 567 KiB  
Article
Where is the Risk Reward? The Impact of Volatility-Based Fund Classification on Performance
by Martin Ewen
Risks 2018, 6(3), 80; https://doi.org/10.3390/risks6030080 - 13 Aug 2018
Cited by 1 | Viewed by 5225
Abstract
This paper examines the impact of volatility-based fund classification on portfolio performance. Using historical data on equity indices, we find that a strategy based on long-term portfolio volatility, as is imposed by the Synthetic Risk Reward Indicator (SRRI), yields better Sharpe Ratios (SR) [...] Read more.
This paper examines the impact of volatility-based fund classification on portfolio performance. Using historical data on equity indices, we find that a strategy based on long-term portfolio volatility, as is imposed by the Synthetic Risk Reward Indicator (SRRI), yields better Sharpe Ratios (SR) and Buy and Hold Returns (BHR) than passive investments. However, accounting for the Fama–French factors in the historical data reveals no significant alphas for the vast majority of the strategies. Further analyses conducted by running a simulation study based on a GJR(1,1)-model show no significant difference in mean returns, but significantly lower SRs for the volatility-based strategies. This evidence suggests that neither the higher leverage induced by the SRRI, nor the potential protection in downside markets pay off on a risk adjusted basis. Full article
Show Figures

Graphical abstract

20 pages, 1544 KiB  
Article
On a Multiplicative Multivariate Gamma Distribution with Applications in Insurance
by Vadim Semenikhine, Edward Furman and Jianxi Su
Risks 2018, 6(3), 79; https://doi.org/10.3390/risks6030079 - 12 Aug 2018
Cited by 9 | Viewed by 3954
Abstract
One way to formulate a multivariate probability distribution with dependent univariate margins distributed gamma is by using the closure under convolutions property. This direction yields an additive background risk model, and it has been very well-studied. An alternative way to accomplish the same [...] Read more.
One way to formulate a multivariate probability distribution with dependent univariate margins distributed gamma is by using the closure under convolutions property. This direction yields an additive background risk model, and it has been very well-studied. An alternative way to accomplish the same task is via an application of the Bernstein–Widder theorem with respect to a shifted inverse Beta probability density function. This way, which leads to an arguably equally popular multiplicative background risk model (MBRM), has been by far less investigated. In this paper, we reintroduce the multiplicative multivariate gamma (MMG) distribution in the most general form, and we explore its various properties thoroughly. Specifically, we study the links to the MBRM, employ the machinery of divided differences to derive the distribution of the aggregate risk random variable explicitly, look into the corresponding copula function and the measures of nonlinear correlation associated with it, and, last but not least, determine the measures of maximal tail dependence. Our main message is that the MMG distribution is (1) very intuitive and easy to communicate, (2) remarkably tractable, and (3) possesses rich dependence and tail dependence characteristics. Hence, the MMG distribution should be given serious considerations when modelling dependent risks. Full article
(This article belongs to the Special Issue Risk, Ruin and Survival: Decision Making in Insurance and Finance)
Show Figures

Figure 1

15 pages, 378 KiB  
Article
On Fund Mapping Regressions Applied to Segregated Funds Hedging Under Regime-Switching Dynamics
by Denis-Alexandre Trottier, Frédéric Godin and Emmanuel Hamel
Risks 2018, 6(3), 78; https://doi.org/10.3390/risks6030078 - 10 Aug 2018
Cited by 5 | Viewed by 2606
Abstract
Insurers issuing segregated fund policies apply dynamic hedging to mitigate risks related to guarantees embedded in such policies. A typical industry practice consists of using fund mapping regressions to represent basis risk stemming from the imperfect correlation between the underlying fund and its [...] Read more.
Insurers issuing segregated fund policies apply dynamic hedging to mitigate risks related to guarantees embedded in such policies. A typical industry practice consists of using fund mapping regressions to represent basis risk stemming from the imperfect correlation between the underlying fund and its corresponding hedging instruments. The current work discusses the implications of using fund mapping regressions when the joint dynamics of the underlying and hedging assets is a regime-switching process. The potential underestimation of capital requirements stemming from the use of a fund mapping regression under such dynamics is discussed. The magnitude of the latter phenomenon is quantified through simulations calibrated on market data. Full article
33 pages, 504 KiB  
Article
Calendar Spread Exchange Options Pricing with Gaussian Random Fields
by Donatien Hainaut
Risks 2018, 6(3), 77; https://doi.org/10.3390/risks6030077 - 08 Aug 2018
Cited by 1 | Viewed by 2829
Abstract
Most of the models leading to an analytical expression for option prices are based on the assumption that underlying asset returns evolve according to a Brownian motion with drift. For some asset classes like commodities, a Brownian model does not fit empirical covariance [...] Read more.
Most of the models leading to an analytical expression for option prices are based on the assumption that underlying asset returns evolve according to a Brownian motion with drift. For some asset classes like commodities, a Brownian model does not fit empirical covariance and autocorrelation structures. This failure to replicate the covariance introduces a bias in the valuation of calendar spread exchange options. As the payoff of these options depends on two asset values at different times, particular care must be taken for the modeling of covariance and autocorrelation. This article proposes a simple alternative model for asset prices with sub-exponential, exponential and hyper-exponential autocovariance structures. In the proposed approach, price processes are seen as conditional Gaussian fields indexed by the time. In general, this process is not a semi-martingale, and therefore, we cannot rely on stochastic differential calculus to evaluate options. However, option prices are still calculable by the technique of the change of numeraire. A numerical illustration confirms the important influence of the covariance structure in the valuation of calendar spread exchange options for Brent against WTI crude oil and for gold against silver. Full article
Show Figures

Figure 1

31 pages, 3269 KiB  
Article
A General Framework for Portfolio Theory. Part II: Drawdown Risk Measures
by Stanislaus Maier-Paape and Qiji Jim Zhu
Risks 2018, 6(3), 76; https://doi.org/10.3390/risks6030076 - 07 Aug 2018
Cited by 7 | Viewed by 4064
Abstract
The aim of this paper is to provide several examples of convex risk measures necessary for the application of the general framework for portfolio theory of Maier-Paape and Zhu (2018), presented in Part I of this series. As an alternative to classical portfolio [...] Read more.
The aim of this paper is to provide several examples of convex risk measures necessary for the application of the general framework for portfolio theory of Maier-Paape and Zhu (2018), presented in Part I of this series. As an alternative to classical portfolio risk measures such as the standard deviation, we, in particular, construct risk measures related to the “current” drawdown of the portfolio equity. In contrast to references Chekhlov, Uryasev, and Zabarankin (2003, 2005), Goldberg and Mahmoud (2017), and Zabarankin, Pavlikov, and Uryasev (2014), who used the absolute drawdown, our risk measure is based on the relative drawdown process. Combined with the results of Part I, Maier-Paape and Zhu (2018), this allows us to calculate efficient portfolios based on a drawdown risk measure constraint. Full article
(This article belongs to the Special Issue Computational Methods for Risk Management in Economics and Finance)
Show Figures

Figure 1

29 pages, 1053 KiB  
Article
One-Year Change Methodologies for Fixed-Sum Insurance Contracts
by Michel Dacorogna, Alessandro Ferriero and David Krief
Risks 2018, 6(3), 75; https://doi.org/10.3390/risks6030075 - 30 Jul 2018
Cited by 3 | Viewed by 2909
Abstract
We study the dynamics of the one-year change in P&C insurance reserves estimation by analyzing the process that leads to the ultimate risk in the case of “fixed-sum” insurance contracts. The random variable ultimately is supposed to follow a binomial distribution. We compute [...] Read more.
We study the dynamics of the one-year change in P&C insurance reserves estimation by analyzing the process that leads to the ultimate risk in the case of “fixed-sum” insurance contracts. The random variable ultimately is supposed to follow a binomial distribution. We compute explicitly various quantities of interest, in particular the Solvency Capital Requirement for one year change and the Risk Margin, using the characteristics of the underlying model. We then compare them with the same figures calculated with existing risk estimation methods. In particular, our study shows that standard methods (Merz–Wüthrich) can lead to materially incorrect results if the assumptions are not fulfilled. This is due to a multiplicative error assumption behind the standard methods, whereas our example has an additive error propagation as often happens in practice. Full article
Show Figures

Figure 1

12 pages, 848 KiB  
Article
Systemic Risk and Insurance Regulation
by Fabiana Gómez and Jorge Ponce
Risks 2018, 6(3), 74; https://doi.org/10.3390/risks6030074 - 27 Jul 2018
Cited by 5 | Viewed by 3004
Abstract
This paper provides a rationale for the macro-prudential regulation of insurance companies, where capital requirements increase in their contribution to systemic risk. In the absence of systemic risk, the formal model in this paper predicts that optimal regulation may be implemented by capital [...] Read more.
This paper provides a rationale for the macro-prudential regulation of insurance companies, where capital requirements increase in their contribution to systemic risk. In the absence of systemic risk, the formal model in this paper predicts that optimal regulation may be implemented by capital regulation (similar to that observed in practice, e.g., Solvency II ) and by actuarially fair technical reserve. However, these instruments are not sufficient when insurance companies are exposed to systemic risk: prudential regulation should also add a systemic component to capital requirements that is non-decreasing in the firm’s exposure to systemic risk. Implementing the optimal policy implies separating insurance firms into two categories according to their exposure to systemic risk: those with relatively low exposure should be eligible for bailouts, while those with high exposure should not benefit from public support if a systemic event occurs. Full article
(This article belongs to the Special Issue Capital Requirement Evaluation under Solvency II framework)
Show Figures

Figure 1

Previous Issue
Next Issue
Back to TopTop